

Abstract
Background
With the development of sequencing technology, an increasing number of biomarkers have been identified in ovarian cancer (OC). However, there have been few comprehensive analyses of CRIP1 in patients with OC.
Methods
Logistic regression analysis was conducted to analyze the correlations between clinical characteristics and CRIP1 expression. Kaplan-Meier survival analysis was used to explore the difference in survival in each clinical subgroup. In addition, univariate and multivariate Cox regression analyses were further used to confirm the independent prognostic values of CRIP1. We further constructed ceRNA network based on the difference analysis. Subsequently, we used the ssGSEA algorithm to excavate the correlation between CRIP1 and tumor-infiltrating immune cells. Moreover, the potential biological functions of CRIP1 were investigated by gene function annotation. Finally, we knocked down CRIP1 gene for preliminary biological function verification in A2780 and SKOV-3 cell lines.
Results
The overexpression of CRIP1 was confirmed in The Cancer Genome Atlas (TCGA) cohort, immunohistochemistry, and OC cell lines. CRIP1 overexpression was correlated with the FIGO stage according to a logistic regression analysis that used the median of CRIP1 expression as a categorization of the dependent variable. Survival analysis revealed that CRIP1 was associated with a poor prognosis in most clinical subgroups and acts as an independent prognostic marker in OC patients. In immuno-bioinformatics analysis, CRIP1 is associated to majority of immune cells. This is noteworthy given that we identified that the ceRNA network based on CRIP1 may regulate progression in OC. In addition, gene enrichment analysis suggested CRIP1 may be involved in the JAK-STAT signaling pathway, etc. Finally, we found that knockdown CRIP1 could inhibit the proliferation of OC cells.
Conclusion
We provided robust evidences that CRIP1 is an indicator of poor prognosis and a potential target for immunotherapy in patients with OC.
1. Introduction
Globally, ovarian cancer (OC) is an important cause of gynecological cancer-related death. Because a large proportion of patients lack specific clinical manifestations in early stage, resulting in 70% of patients being diagnosed at an advanced stage [1], therefore, exploring new diagnostic strategies of OC patients is currently an urgent problem to be addressed.
Cysteine-rich intestinal protein (CRIP) is one of the important members of LIM/double zinc-finger protein family [2]. At present, relevant basic research have demonstrated that CRIP1 is involved in intestinal zinc transport [3] and has a prognostic value in various tumors, such as thyroid cancer [4], acute myeloid leukemia [5], and hypertension-related renal cell carcinoma [6]. Meanwhile, CRIP1 is overexpressed in immune cells of the epithelium and may play an important role in gut immunity [7]. Furthermore, experimental animal models confirmed that porcine crip1 is activated by Enterococcus faecalis in gastrointestinal epithelial cells [7]. Our study found that this CRIP1 is overexpressed in all gynecological tumors in pan-cancer analysis. Although one study has discovered the mechanism of CRIP1 in cervical cancer [8] at present, it has not been studied in depth in other gynecological tumors.
In this study, we deeply investigated the role of CRIP1 in OC with in vitro assays combined with bioinformatics analysis. We found that CRIP1 is overexpressed in OC tissues and is associated with multiple immune cells. Meanwhile, we found an important ceRNA axis potentially involved in OC progression. Furthermore, the clinical association and prognosis value of CRIP1 were explored. Finally, the effect of silencing CRIP1 on cell proliferation was evaluated in A2780 and SKOV-3 cell lines. In summary, we provided robust evidences that CRIP1 is an indicator of poor prognosis and a potential target for immunotherapy in patients with OC.
2. Materials and Methods
2.1. Differential Expression Analysis
We download RNA-sequence data (Level-3 HTseq-FPKM) from the Pan-cancer Project in The Cancer Genome Atlas (TCGA) Database. The expression of CRIP1 was compared between the normal and tumor tissues after log2-transformation of FPKM raw data. In addition, the RNA-sequence data of 88 normal ovarian epithelial tissues as the same format was downloaded from GTEx database to perform CRIP1 difference analysis of unpaired (427 OC tissues and 88 adjacent normal tissues). The expression of CRIP1 protein was excavated from the Human Protein Atlas (HPA) database, including immunohistochemical images and statistical results of staining intensity of different tissues.
2.2. Clinical Prognosis and Characteristic Analysis
The clinical data was downloaded from the TCGA database. The clinical characteristics include FIGO stage, age, BMI, histologic grade, FIGO stage, tumor status, lymphatic invasion, anatomic neoplasm subdivison, and tumor residual; survival information include overall survival (OS), disease-specific survival (DSS), and progress-free interval (PFI), as detailed in Table 1. We calculated the median expression of CRIP1 of OC patients, which is used to select “high-CRIP1” and “low-CRIP1” groups. Kaplan-Meier survival analysis and log-rank test were used to suggest the survival differences (OS, DSS, and PFI) in two groups. In addition, independent prognostic factors were identified by univariate and multivariate Cox regression analyses. In addition, we used ‘rms' package in R software to plot a nomogram for visualizing the prognosis value of CRIP1. The distinction and calibration were evaluated by the ROC curve and calibration curve.
Table 1.
Clinical characteristics of OC patients in the TCGA database.
| Characteristic | Overall |
|---|---|
| n | 379 |
| Age, n (%) | |
| ≤60 | 208 (54.9%) |
| >60 | 171 (45.1%) |
| FIGO stage, n (%) | |
| Stage I | 1 (0.3%) |
| Stage II | 23 (6.1%) |
| Stage III | 295 (78.5%) |
| Stage IV | 57 (15.2%) |
| Histologic grade, n (%) | |
| G1 | 1 (0.3%) |
| G2 | 45 (12.2%) |
| G3 | 322 (87.3%) |
| G4 | 1 (0.3%) |
| Anatomic neoplasm, n (%) | |
| Unilateral | 102 (28.6%) |
| Bilateral | 255 (71.4%) |
| Venous invasion, n (%) | |
| No | 41 (39%) |
| Yes | 64 (61%) |
| Lymphatic invasion, n (%) | |
| No | 48 (32.2%) |
| Yes | 101 (67.8%) |
| Tumor residual, n (%) | |
| NRD | 67 (20%) |
| RD | 268 (80%) |
| Tumor status, n (%) | |
| Tumor free | 72 (21.4%) |
| With tumor | 265 (78.6%) |
2.3. Enrichment Analysis of Differentially Expressed Genes
We divided samples into two groups (high-CRIP1 and low-CRIP1) based on the median expression of CRIP1. The differentially expressed genes (DEGs) in CRIP1-high samples and CRIP1-low samples were screened using ‘limma' package in R software. The thresholds were set to ∣log2(FC) | >2 and p.adj < 0.05. Moreover, Gene Ontology (GO) and Kyoto Encyclopedia of Genes and Genomes (KEGG) analyses were performed using related packages. The thresholds were set to p.adj < 0.05 and q value < 0.2.
2.4. Immune-Infiltration Analysis
The immune-infiltration algorithm used in this study was ssGSEA, which was implemented through the ‘GSVA' package in R software. The 24 types of immune cells include aDC, B cells, CD8 T cells, cytotoxic cells, DC, eosinophils, iDC, macrophages, mast cells, neutrophils, NK CD56bright cells, NK CD56dim cells, NK cells, pDC, T cells, T helper cells, Tcm, Tem, Tfh, Tgd, Th1 cells, Th17 cells, Th2 cells, and TReg.
2.5. The Construction and Comprehensive Analysis of CRIP1-Related ceRNA Networks
As previously mentioned, we divided samples into two groups (high-CRIP1 and low-CRIP1) based on the median expression of CRIP1. The differentially expressed lncRNAs (DELs) in high-CRIP1 samples and low-CRIP1 samples were screened using ‘deseq2' package in R software. The thresholds were set to ∣log2(FC) | >2 and p.adj < 0.05. We used Starbase (http://starbase.sysu.edu.cn/) to predict target miRNAs of CRIP1. Correlation analysis was conducted between all target miRNAs predicted by databases and CRIP1. Finally, we only retained miRNAs that was negatively correlated with CRIP1 and analyzed the prognostic value of the above miRNAs in OC patients. The miRNA (the study was miR-503-5p) involved in the ceRNA network construction were determined by the above methods. At the same time, we also predicted the targeted-lncRNAs of miR-503-5p in the Starbase. Subquently, we constructed the intersection of targeted-lncRNAs and the above DELs as our final lncRNAs involved in the ceRNA network. In addition, we also conducted correlation analysis and survival analysis of the abovementioned lncRNAs. Finally, these genes were combined to construct a lncRNA-miRNA-mRNA CRIP1 network by Cytoscape software.
2.6. Function Detection of CRIP1 in Cell Level
In this study, we used cell culture, transfection, CCK-8, and qRT-PCR as in vitro assays. The Shanghai Cell Institute Country Cell Bank provided the cell lines SKOV-3, A2780, and IOSE80. GenePharma generated and annealed small-interfering RNA (si-RNA-1/2/3) oligos for CRIP1 and a general negative control. Following the manufacturer's procedure [4], each siRNA duplex was transfected into the cells using Lipofectamine® 2000 (Invitrogen, Carlsbad, CA, USA). A2780 and SKOV-3 cells were planted in a 96-well plate with or without CRIP1 knockdown. After cell culture for 0, 1, 2, 3, and 4 days, cell viability was determined using the CCK-8 (Dojindo, Tokyo, Japan). In addition, CRIP1 and GAPDH gene primers were as follows: CRIP1-F: 5′-GGAGCGAGATCCCTCCAAAAT-3′, CRIP1-R: 5′-GGCTGTTGTCATACTTCTCATGG-3′ and GAPDH-F: 5′-AATTCGGCACGAGGCATGATCCAA-3′, GAPDH-R: 5′-AGAAGCCCCAGGAAAAGACTGACA-3′. The details of the methods are provided in references [4, 8].
2.7. Statistical Analysis
All statistical analyses were performed using the R software (v.3.6.3). Detailed statistical methods about Transcriptome data are covered in the bioinformatics method section. p < 0.05 was considered statistically significant.
3. Result
3.1. CRIP1 Expression in Pan-Cancer and OC Patients
Firstly, we identified the expression of CRIP1 in various cancers and focused on OC. We found that there were significant differences in the expression of CRIP1 in pan-cancer patients (30/33, p < 0.05), as shown in Figures 1(a) and 1(b) (paired samples). Of note, CRIP1 was upregulated in all gynecological tumors. In addition, we explored expression of CRIP1 by combining 88 normal ovarian tissue samples in GTEx database, and the same results were found (p < 0.001, Figure 1(c)). Meanwhile, representative immunohistochemical staining of CRIP1 protein in the HPA database revealed a lower expression in normal samples (Figure 1(d)). Not surprisingly, in in vitro assays, the result validated the upregulated CRIP1 in A2780 and SKOC-3 cell lines (Figure 2(a)).
Figure 1.
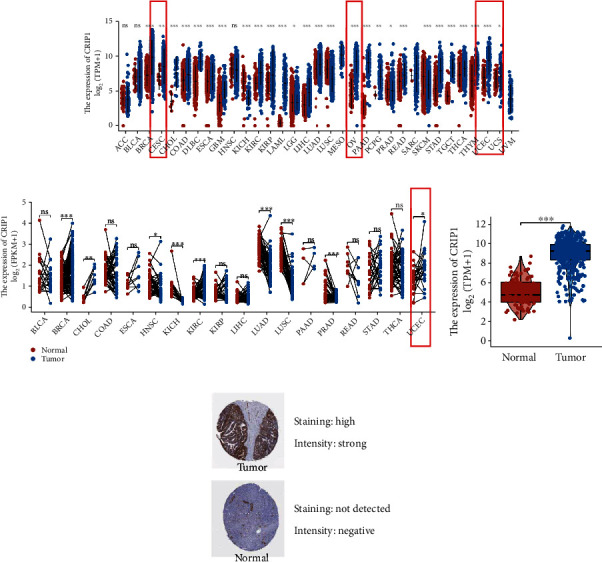
CRIP1 expression in pan-cancer and OC patients. (a) Differential expression of CRIP1 in pan-cancer patients, gynecological tumors in the red frame. (b) Differential expression CRIP1 of paired samples from the TCGA database, gynecological tumors in the red frame. (c) The expression of CRIP1 was explored by combining normal ovairan tissue samples in GTEx database. (d) Representative Immunohistochemical staining of CRIP1 in the HPA database. ∗∗p < 0.01, ∗∗∗p < 0.001.
Figure 2.
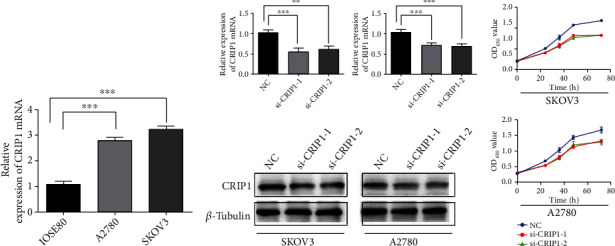
Cell function assays of knockdown CRIP1. (a) Relative expression of CRIP1 mRNA in IOSE80, A2780, and SKOV-3 cell lines. (b) Relative expression of CRIP1 mRNA and protein in OC cell lines transfected with si-CRIP1. (c) CCK8 assays in OC cell lines transfected with si-CRIP1. ∗p < 0.05, ∗∗p < 0.01, and ∗∗∗p < 0.001.
3.2. Identification of the Correlation between CRIP1 Expression and Clinical Characteristics
Correlation analysis was performed between CRIP1 expression and corresponding clinical characteristics. As presented in Figure 3, increased expression of CRIP1 is remarkably related to multiple factors, including FIGO stage (p < 0.001, Figure 3(c)) and tumor status (p < 0.01, Figure 3(d)). Meanwhile, it should also be noted that the expression of CRIP1 was not statistically correlated with the following clinical characteristics: age (Figure 3(a)), histologic grade (Figure 3(b)), lymphatic invasion (Figure 3(e)), venous invasion (Figure 3(f)), anatomic neoplasm subdivision (Figure 3(g)), and tumor residual (Figure 3(h)). Furthermore, as shown in Table 2, using the median of CRIP1 expression as the dependent variable, logistic regression analysis revealed that overexpression of CRIP1 was significantly linked with FIGO stage (advanced stage vs. early stage, p = 0.01).
Figure 3.
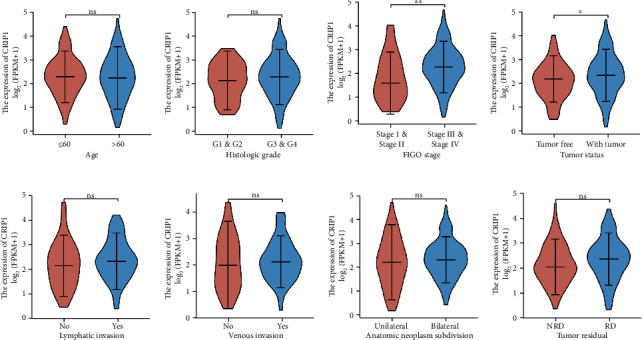
Correlation analysis between CRIP1 expression and clinical characteristics: (a) age, (b) histologic grade, (c) FIGO stage, (d) tumor status, (e) lymphatic invasion, (f) venous invasion, (g) anatomic neoplasm subdivision, and (h) tumor residual. ∗p < 0.05, ∗∗p < 0.01.
Table 2.
Logistic regression analysis between CRIP1 expression and clinical characteristics.
| Characteristics | Odds ratio (OR) | p value |
|---|---|---|
| Age (>60 vs. ≤60) | 0.954 (0.758-1.200) | 0.689 |
| FIGO stage (stage III & stage IV vs. stage I & stage II) | 1.909 (1.175-3.176) | 0.010 |
| Primary therapy outcome (PD vs. PR & CR) | 1.037 (0.663-1.619) | 0.872 |
| Histologic grade (G3 & G4 vs. G1 & G2) | 1.276 (0.894-1.834) | 0.182 |
| Venous invasion (yes vs. no) | 1.101 (0.703-1.742) | 0.676 |
| Lymphatic invasion (yes vs. no) | 1.262 (0.859-1.881) | 0.242 |
| Anatomic neoplasm (bilateral vs. unilateral) | 1.200 (0.926-1.564) | 0.171 |
| Tumor residual (NRD vs. RD) | 0.749 (0.544-1.024) | 0.072 |
3.3. Prognostic Value and Subgroup Analysis of CRIP1
To further explore the prognostic value of CRIP, we performed survival analysis of clinical subgroup. Firstly, we calculated the median expression of CRIP1 of OC patients, which is used to select “high-CRIP1” and “low-CRIP1” groups. Kaplan-Meier survival analysis and log-rank test were used to suggest the survival differences (OS, DSS, and PFI) in two groups. The results showed that except for PFS, the survival time of the high-expression group is significantly shorter than the low-expression group (OS, p = 0.028, Figure 4(a); DFS, p = 0.035, Figure 4(b); PFI, p = 0.144, Figure 4(c)). In addition, we also analyzed the prediction value of CRIP1 in OS, and the ROC curve results showed that CRIP1 had a good predictive performance (AUC:0.655, Figure 4(d)). In the survival analysis of the clinical subgroups, the survival time of the high-CRIP1 group was significantly shorter than the low-CRIP1 group in the advanced group (p = 0.035, Figure 4(e)), nonelderly group (p = 0.027, Figure 4(f)), G1 & G2 group (p = 0.0002, Figure 4(g)), nonvascular invasion group (p = 0.006, Figure 4(h)), and primary therapy outcome: CR group (p = 0.033, Figure 4(j)). Although there was no significant difference in survival time among the subgroups of lymphatic invasion (no, p = 0.088; yes, p = 0.052; Figure 4(i)), it is of concern.
Figure 4.
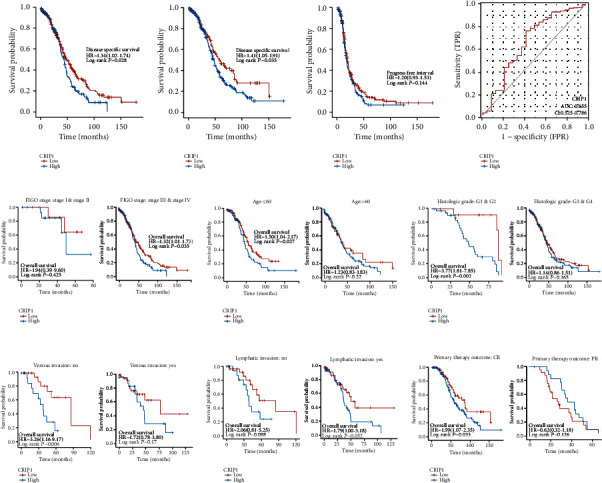
Prognostic value of CRIP1 in OC Patients. (a) OS: overall survival; (b) DSS: disease-specific survival. (c) PFI: progress-free interval. (d) ROC analysis for OS. Survival analysis of clinical subgroups, including (e) FIGO stage, (f) age, (g) histologic grade, (h) venous invasion, (i) lymphatic invasion, and (j) primary therapy outcome.
3.4. Identification of Immune-Infiltration Landscapes Based on CRIP1
Especially, infiltrating immune cells are independent predictor of survival in patients with OC. Therefore, we explored the correlation between CRIP1 and 24 immune cells, as well as the relationship between the expression of CRIP1 mRNA and immune cells. Based on the median expression value of CRIP1, all OC patients were classified into the high- and low-expression groups. It showed that NK CD56bright cells, NK cells, Tcm, Tgd, and Th2 cells differed significantly between groups (Figures 5(b)–5(d), Table 3). Moreover, the results showed that CRIP1 was negative correlation with only seven immune cells, including eosinophils, Tem, Th2 cells, Tgd, T helper cells, Tcm, and NK cells (Figure 5(a)).
Figure 5.
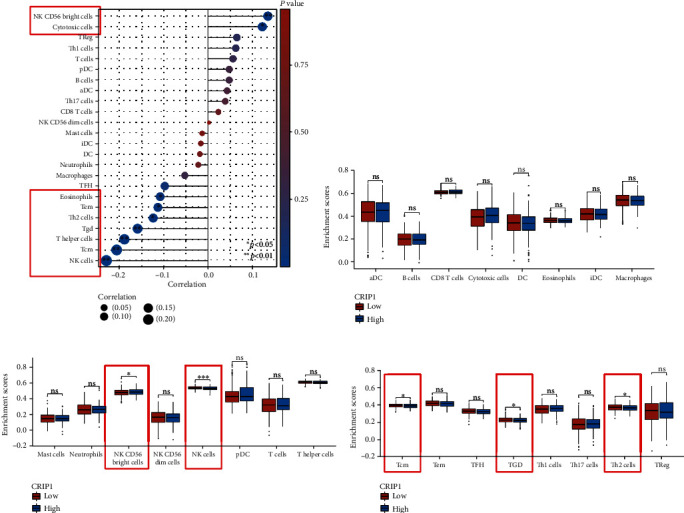
Correlation between CRIP1 expression and immune infiltration in OC. (a) Person analysis of 24 immune cells and CRIP1 expression. (c–d) Differential expression analysis of 24 immune cells in patients with different CRIP1 expressions. ∗p < 0.05, ∗∗p < 0.01, and ∗∗∗p < 0.001.
Table 3.
Correlation analysis between CRIP1 and immune cells.
| Genes | Immune cells | Coefficient | p value |
|---|---|---|---|
| CRIP1 | aDC | 0.043 | 0.399 |
| CRIP1 | B cells | 0.048 | 0.350 |
| CRIP1 | CD8 T cells | 0.024 | 0.646 |
| CRIP1 | Cytotoxic cells | 0.124 | 0.016 |
| CRIP1 | DC | -0.018 | 0.726 |
| CRIP1 | Eosinophils | -0.108 | 0.036 |
| CRIP1 | iDC | -0.016 | 0.758 |
| CRIP1 | Macrophages | -0.052 | 0.311 |
| CRIP1 | Mast cells | -0.013 | 0.803 |
| CRIP1 | Neutrophils | -0.021 | 0.677 |
| CRIP1 | NK CD56bright cells | 0.136 | 0.008 |
| CRIP1 | NK CD56dim cells | 0.002 | 0.962 |
| CRIP1 | NK cells | -0.229 | <0.001 |
| CRIP1 | pDC | 0.048 | 0.349 |
| CRIP1 | T cells | 0.057 | 0.270 |
| CRIP1 | T helper cells | -0.189 | <0.001 |
| CRIP1 | Tcm | -0.206 | <0.001 |
| CRIP1 | Tem | -0.113 | 0.028 |
| CRIP1 | TFH | -0.097 | 0.059 |
| CRIP1 | Tgd | -0.159 | 0.002 |
| CRIP1 | Th1 cells | 0.063 | 0.221 |
| CRIP1 | Th17 cells | 0.039 | 0.444 |
| CRIP1 | Th2 cells | -0.124 | 0.016 |
| CRIP1 | TReg | 0.065 | 0.204 |
3.5. Construction of Nomogram Based on CRIP1
To investigate the independent prognostic value of CRIP1 in OC patients, in which univariate Cox analysis revealed that CRIP1 same age and FIGO stage were high-risk factors, while tumor residual was a low-risk factor (Figure 6(a)). Moreover, further multivariate Cox analysis showed that CRIP1 and tumor residual were independently associated with OS, which may imply that CRIP1 may be an independent prognostic predictor for OC patients (Figure 6(b)). Meanwhile, considering the clinical value of FIGO stage, we combined FIGO stage and significance factors in multivariate analysis to construct a visual prognostic model (Figure 6(c)). The ROC curve and calibration curve also showed that the model had better predictive value (Figures 6(d) and 6(e)).
Figure 6.
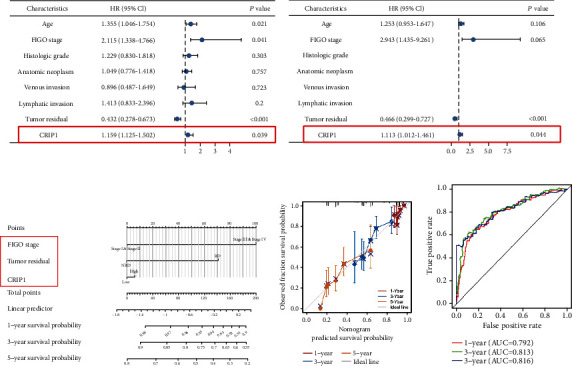
Construction of nomogram based on CRIP1. Univariate (a) and multivariate Cox regression analysis (b) based on CRIP1 and clinicopathologic factors. Nomogram (c), calibration curve (d), and ROC analysis (e) based on tumor residual, FIGO stage, and CRIP1.
3.6. The Construction and Comprehensive Analysis of CRIP1-Related ceRNA Networks
We divided samples into two groups (high-CRIP1 and low-CRIP1) based on the median expression of CRIP1. The DELs and DEGs in two groups were screened using the thresholds set to ∣log2(FC) | >2 and p.adj < 0.05. Finally, we screened out 100 differential genes, of which 88 were downregulated and 12 upregulated (Figure 7(a)). The gene heatmaps showed the DELs (Figure 7(b)) and the top 20 DEGs (Figure 7(c)).
Figure 7.
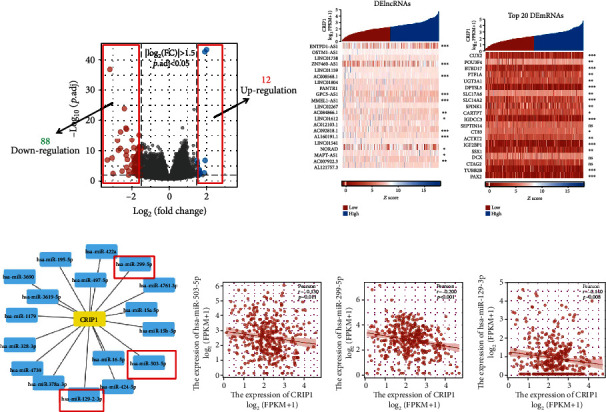
Identification of targeted-miRNAs and screening of DElncRNAs. (a) Volcanic plot of differential gene expression. (b) The heatmap of DElncRNAs in OC patients. (c) The heatmap of DEGs in OC patients. (d) A network of CRIP1 and target miRNAs. The Pearson correlation analysis of miR-503-5p (e), miR-299-5p (f), and miR-129-2-3p (g).
To build the ceRNA network, we used Starbase to predict target miRNAs of CRIP1 (Figure 7(d)), subsequently, correlation analysis was conducted between all target miRNAs predicted by databases and CRIP1. Only three target miRNAs were negatively correlated with CRIP1 in OC, including miR-503-5p (r = −0.13, p = 0.11, Figure 7(e)), miR-299-5p (r = −0.2, p < 0.001, Figure 7(f)), and miR-129-2-3p (r = −0.14, p = 0.008, Figure 7(g)). Meanwhile, we analyzed the prognostic value of the above miRNAs in OC patients. The miR-503-5p with prognostic value was included in the construction of the ceRNA network (p = 0.004, HR = 0.68, Figure 8(a)). Moreover, we also predicted the targeted lncRNAs of miR-503-5p in Starbase. In the following, we constructed the intersection of targeted lncRNAs and the above DELs as our final lncRNAs involved in the ceRNA network (Figure 8(b)). Similar to miRNA treatment, we also performed correlation analysis and survival analysis for above lncRNAs in intersection (ENTPD1-AS1, ZNF460-AS1, and NORAD). All the three lncRNAs were negatively correlated with miR-503-5p (Figures 8(c) and 8(d)), and only ZNF460-AS1 showed statistical difference in the survival analysis (p = 0.013). Finally, these genes were combined to construct a ZNF460-AS1/NORAD/ENTPD1-AS1-miR-503-5p-CRIP1 network (Figure 8(f)).
Figure 8.
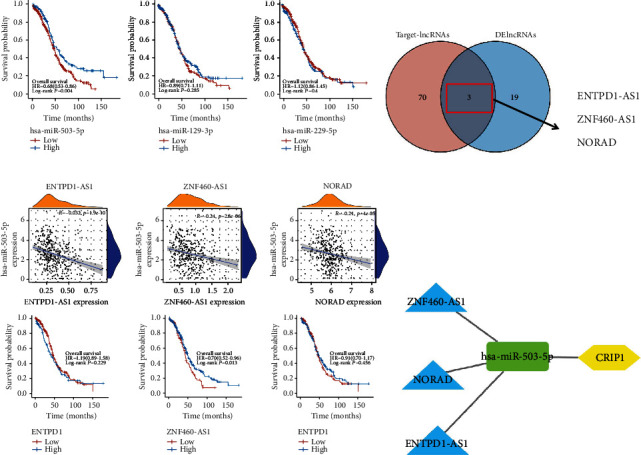
Construction of ceRNA network based on CRIP1. (a) Survival analysis of target miRNAs. (b) A Venn plot for target lncRNAs and DElncRNAs. The Pearson correlation analysis and survival analysis of ENTPD1-AS1 (c), ZNF460-AS1 (d), and NORAD (e). (f) A ceRNA network based on CRIP1.
3.7. Conjecture of the Potential Mechanisms of CRIP1
In order to explore the potential mechanism of CRIP1 involvement, we performed gene enrichment analysis on all the above DEGs. In the results of GO enrichment analysis of DEGs, the genes were mainly enriched in endocrine system development, hormone binding, and forebrain development, etc. (Figure 9(a)). In the results of KEGG pathway enrichment analysis of DEGs, the genes were mainly enriched in protein digestion and absorption, neuroactive ligand-receptor interaction, and cardiac muscle contraction, etc. (Figure 9(b)). In addition, we also conducted GSEA enrichment analysis on the above genes, and the results showed that these genes may be related to the process of nervous system development (Figure 9(c)).
Figure 9.
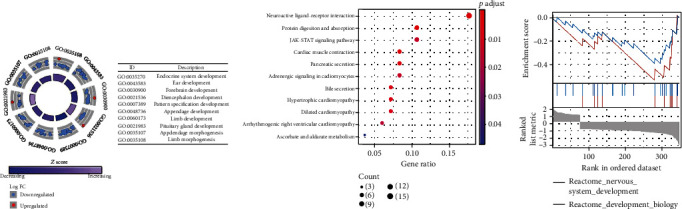
Gene enrichment analysis of DEGs. (a) GO enrichment analysis. (b) KEGG enrichment analysis. (c) GSEA enrichment analysis.
3.8. CRIP1 Expression Analyzed In Vitro
To further validate the above bioinformatics results, we detected the expression level of CRIP1 mRNA in OC cell lines. The results showed that the expression of CRIP1 was upregulated in OC cancer cell lines (A2780 and SKOV-3) compared to IOSE80, as shown in Figure 2(a). In addition, si-CRIP1 and si-NC were transfected in A2780 and SKOV-3 cells, respectively, and qRT-PCR and western blot were used to detect the protein expression of CRIP1. It was found that CRIP1 expression was downregulated in OC cell lines with transfection (Figure 2(b)). Similarly, CCK-8 assays showed that OC cell proliferation was inhibited after transfection with CRIP1 (Figure 2(c)).
4. Discussion
With the rapid development of second-generation sequencing and bioinformatics, it is easier to obtain differentially expressed genes in OC [9]. It provides a broader idea, better conditions, and new perspective for the pathogenesis of OC. This study focused on the prognostic value and potential mechanism of CRIP1 in OC. Although CRIP1 can promote or inhibit the development of different tumors under different conditions, it has not been discussed in detail in OC.
The correlation between CRIP1 expression and clinical variables was investigated using logistic regression analysis and clinical correlation analysis. We also performed Kaplan-Meier and Cox regression analyses to see if there was an association between CRIP1 expression and survival outcomes. We also analyzed the relationship between CRIP1 expression and immune-infiltrating cells. The possible mechanism of CRIP1 was then investigated using GO and KEGG. Finally, in OC cell lines, the ceRNA regulation network based on CRIP1 was built and confirmed. To our knowledge, no study has been done on CRIP1 expression in OC and its possible predictive significance. CRIP1 has been demonstrated in a few studies to operate as an oncogene. Zhang et al. [8] found that overexpression of CRIP1 in cervical cancer was associated with shorter survival time. Our data also support the carcinogenic effect of CRIP1. On the contrary, a few studies have shown that CRIP1 may have an antitumor effect. Baumhoer et al. [10] found that CRIP1 was associated with good prognosis and less metastasis in patients with osteosarcoma.
In conclusion, based on public sequencing and clinical data, we constructed ceRNA regulatory network based on CRIP1 expression. We further explored the role of CRIP1 in ovarian cancer by qRT-PCR and western blot in the OC cell line. This study may provide a new understanding of the pathogenesis of OC and reveal potential therapeutic targets.
5. Conclusions
We provided robust evidences that CRIP1 is an indicator of poor prognosis and a potential target for immunotherapy in patients with OC.
Data Availability
The following information was supplied regarding data availability. Data is available at the TCGA (https://portal.gdc.cancer.gov/).
Disclosure
The authors are accountable for all aspects of the work in ensuring that questions related to the accuracy or integrity of any part of the work are appropriately investigated and resolved.
Conflicts of Interest
The authors declare that they have no conflicts of interest.
Authors' Contributions
B.Q. conceived and designed the study. S.L. was responsible for the materials. D.L. drafted the article. H.Y. and R.Y. revised the article critically. All authors had final approval of the submitted versions.
References
- 1.Lheureux S., Braunstein M., Oza A. M. Epithelial ovarian cancer: evolution of management in the era of precision medicine. CA: a Cancer Journal for Clinicians . 2019;69(4):280–304. doi: 10.3322/caac.21559. [DOI] [PubMed] [Google Scholar]
- 2.O'Dell B. L. Cysteine-rich intestinal protein (CRIP): a new intestinal zinc transport protein. Nutrition Reviews . 1992;50(8):232–233. doi: 10.1111/j.1753-4887.1992.tb01334.x. [DOI] [PubMed] [Google Scholar]
- 3.He G., Zhu H., Yao Y., et al. Cysteine-rich intestinal protein 1 silencing alleviates the migration and invasive capability enhancement induced by excessive zinc supplementation in colorectal cancer cells. American Journal of Translational Research . 2019;11(6):3578–3588. [PMC free article] [PubMed] [Google Scholar]
- 4.Li H., Zhao L. H., Zhang Z. H., et al. The impact of cysteine-rich intestinal protein 1 (CRIP1) on thyroid carcinoma. Cellular Physiology and Biochemistry . 2018;43(5):2037–2046. doi: 10.1159/000484184. [DOI] [PubMed] [Google Scholar]
- 5.Ma B. B., Li Y., Wen J., Zhao Y. m6A RNA methylation regulators contribute to malignant development and have a clinical prognostic effect on cervical cancer. American Journal of Translational Research . 2020;12(12):8137–8146. [PMC free article] [PubMed] [Google Scholar]
- 6.Huang W., Wu K., Wu R., Chen Z., Zhai W., Zheng J. Bioinformatic gene analysis for possible biomarkers and therapeutic targets of hypertension-related renal cell carcinoma. Translational Andrology and Urology . 2020;9(6):2675–2687. doi: 10.21037/tau-20-817. [DOI] [PMC free article] [PubMed] [Google Scholar]
- 7.Cai H., Chen J., Liu J., et al. CRIP1, a novel immune-related protein, activated by Enterococcus faecalis in porcine gastrointestinal epithelial cells. Gene . 2017;598:84–96. doi: 10.1016/j.gene.2016.11.009. [DOI] [PubMed] [Google Scholar]
- 8.Zhang L. Z., Huang L. Y., Huang A. L., Liu J. X., Yang F. CRIP1 promotes cell migration, invasion and epithelial-mesenchymal transition of cervical cancer by activating the Wnt/β‑catenin signaling pathway. Life Sciences . 2018;207:420–427. doi: 10.1016/j.lfs.2018.05.054. [DOI] [PubMed] [Google Scholar]
- 9.Tariq H., Gul A., Khadim T., et al. Next generation sequencing-based germline panel testing for breast and ovarian cancers in Pakistan. Asian Pacific Journal of Cancer Prevention . 2021;22(3):719–724. doi: 10.31557/APJCP.2021.22.3.719. [DOI] [PMC free article] [PubMed] [Google Scholar]
- 10.Baumhoer D., Elsner M., Smida J., et al. CRIP1 expression is correlated with a favorable outcome and less metastases in osteosarcoma patients. Oncotarget . 2011;2(12):970–975. doi: 10.18632/oncotarget.398. [DOI] [PMC free article] [PubMed] [Google Scholar]
Associated Data
This section collects any data citations, data availability statements, or supplementary materials included in this article.
Data Availability Statement
The following information was supplied regarding data availability. Data is available at the TCGA (https://portal.gdc.cancer.gov/).