

Abstract
Statement of Novelty. Poultry feed contamination due to mycotoxins is one of the major threats to the growing poultry industry. Surveillance of different mycotoxins, including aflatoxin, is very important to control economic and health hazards associated with these toxins. Studies reporting aflatoxin levels in poultry feed are limited. Therefore, this study was conducted to examine the occurrence of total aflatoxin in poultry feed. This study is the first-ever documentation about the frequency and quantitative estimations of total aflatoxin levels in poultry feed consumed to provide solid feedback to the poultry industrialists and researchers involved in studying the mycotoxins. Objective. Contamination of poultry feed with mycotoxins such as aflatoxin is a major concern for the poultry industry that results in a significant economic loss and directly affects consumers. Monitoring the aflatoxin levels in poultry feed is crucial for controlling economic loss and decreasing the health hazards to the population. This study was conducted to examine the occurrence of total aflatoxin in poultry feed in a high consumption area. Three different poultry feeds, i.e., starter, grower, and finisher, were assessed through continuous sampling from farms. The incidence of positive samples for aflatoxin contamination was 92.5%. Grower feed had the highest frequency (100%) of aflatoxin positive samples and aflatoxin levels with a mean value of 56.34 ppb. Further, the range of moisture content was around 6.8%-10.98%. No significant correlation between humidity and aflatoxin contamination was revealed when analyzed by Pearson's correlation coefficient with r2 of 0.05 and p value of 0.13. The results warrant the need for constant monitoring programs for the prevention of aflatoxin contamination in local poultry farms
1. Introduction
Aspergillus is soil fungal species that have been recognized as a major contaminant of different grains utilized for poultry diets [1]. They grow rapidly under high moisture conditions and produce biologically active hepatotoxic aflatoxins [2]. Maize, cereals like rice, wheat, pistachios, cottonseed, copra groundnuts, and many other feed stuffs are contaminated by these fungal species [3–5]. Aflatoxin actually covers three words in accordance with its definition, i.e., “a” from genus Aspergillus, “fla” from flavis species, and toxin means poison [6]. Aflatoxins are the most studied toxins due to their association with high morbidity and mortality rate in poultry. Therefore, aflatoxins in several feed grains are a major public health concern, which adversely affects human and animal health [5]. Among livestock and poultry, this toxin is mainly responsible for aflatoxicosis, and the disease leads to acute suppression of the immune system and a low production rate [7]. Several other studies have reported that aflatoxin has carcinogenic and hepatotoxigenic effects as well [8–10]. It has the ability to cross the placenta and cause slow growth rate of neonates [11, 12]. Toxins such as aflatoxin B1 affects lungs, causing different diseases in animals [10, 13]. Contamination of food or feed of poultry with fungal toxins reduces its safety and quality causing a huge loss at the industrial level. However, Food and Drug Administrative Authority considers aflatoxin as an unavoidable food contaminant and has set regulatory levels for it. The permissible level for poultry is 20 ppb [14, 15]. The toxin production can take place in either preharvest or postharvest stage of the crop. In addition to feed, aflatoxin can also be found in dairy milk products of animals exposed to these feeds. The environmental factors directly effecting the aflatoxin production include temperature, oxygen, and moisture contents. Usually, the production of aflatoxin G occurs at 28°C while that of aflatoxin B typically takes place at 11-37°C [16]. As the temperature in many areas increases due to sudden global changes, a higher temperature can facilitate the production of fungi, e.g., Aspergillus species that flourish in warmer climatic regions. This, in turn, results in increased aflatoxin production [17]. Pakistan is one of the countries affected adversely due to climate change. Therefore, an increased risk of aflatoxin is expected in the coming few years. In Pakistan, the poultry industry contributes 26.8% to total meat production. The poultry sector has emerged as a source of employment for more than 1.5 million people in the last few years [18]. Poultry feeds/ingredients have been routinely polluted by aflatoxins in different regions of Pakistan [19–21]. Different studies have reported different ratios of aflatoxin B1 and B2 contamination in the feed of poultry starter chick and poultry starter broiler with concentrations ranging between 100 and 320 μgkg−1 [19]. Keeping in view the importance of aflatoxins, the present study was conducted to investigate the occurrence of total aflatoxin in poultry feed consumed in poultry farms located in Northern Pakistan. The selected area has a high consumption of poultry feed due to an increased number of farms but lacks any authentic data about the frequency and levels of aflatoxin contamination. This study is the first-ever documentation about the frequency and quantitative estimations of total aflatoxin level in poultry feed consumed in Northern Pakistan in order to provide a solid feedback to the researchers involved in studying the mycotoxins.
2. Material and Methods
The study was performed on broiler poultry feed supplied in different poultry farms of Northern Pakistan through a random feed sampling method. A framework was designed with the help of previous research done in the field of aflatoxin.
2.1. Sample Collection
Forty samples of poultry feed were collected from local poultry farms of Northern Pakistan in 4 months (March 2018 to July 2018). The feed samples represented three poultry feed categories: broiler-starter feed (1-19 days), broiler-grower feed (19-30 days), and broiler-finisher feed (31-50 days). The collected samples were ground, carefully mixed, and then stored at 2-8°C (35-46°F) in sealed plastic bags.
2.2. Sample Extraction
For extraction, 70% methanol solution was prepared by mixing seven parts of ACS grade methanol with three parts of distilled water. For every tested sample, the sample was ground and 5 grams of it was vigorously shaken in 25 mL of methanol for four minutes. 5 ml of the suspension was filtered through a Whatman filter, and the filtrate was collected for further assays.
2.3. Detection of Aflatoxin through Direct ELISA
The level of aflatoxin was determined through ELISA using the kit and protocol supplied by Neogen Veratox Corporation USA. Briefly, 100 μl conjugate was added to red marked mixing wells to initiate the process of aflatoxin detection. A 100 μl of each standard (0 ppb, 5 ppb, 15 ppb, and 50 ppb) was added in the first four red microwells. Similarly, 100 μl of sample extract was added in the 5th red microwell. The conjugate and sample extract in all red wells were thoroughly mixed by a multichannel pipette, and 100 μl from each red microwell was transferred to the corresponding white microwells. The solution in white microwells was gently shaken for 10 to 15 seconds and incubated for two minutes. Following this, the liquid from white wells was removed and the wells were thoroughly washed five times with deionized water. The wells were dried on an absorbent paper towel, and 100 μl of the substrate provided within the kit was added in each white microwell and gently shaken (10 to 15 times). After three minutes of incubation, 100 μl of red stop solution was added into white microwells. The results were obtained on an ELISA reader at 650 nm within 20 minutes of solution addition.
2.4. Calculation of the Moisture Content
Hot air oven method was used to determine the dry factor following the standard procedures. The samples were weighed before drying and again after drying at 105°C.
The moisture content was measured using the following equation:
| (1) |
| (2) |
where W2 is the weight after drying and W1 is the weight before or empty crucible dish.
3. Results
3.1. Frequency of Aflatoxin in Feed Samples in All Samples Collected from Selected Regions of Northern Pakistan
A total of 40 feed samples were analyzed from selected regions of Northern Pakistan. Among all 40 tested samples, 92.5% (n = 37) were found positive for aflatoxin, whereas only 7.5% (n = 3) were negative (Figure 1). Hence, a high percentage of samples contaminated with aflatoxins was evident.
Figure 1.
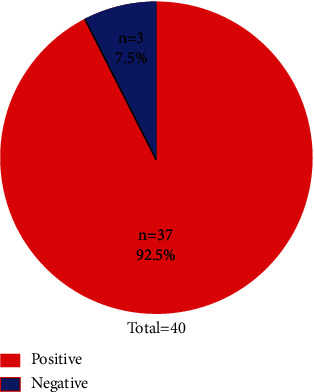
Frequency of positive and negative samples.
3.2. Regions-Wise Frequency, Total Aflatoxin Level, and Moisture Content in Poultry Feed Supplied to Northern Pakistan
The frequency of aflatoxin was also determined in selected regions (Mansehra, Oghi, and Balakot) of Northern Pakistan. The highest frequency of aflatoxin was reported in samples obtained from the Balakot region where 100% of feed samples were contaminated with aflatoxins. The samples obtained from the Mansehra region showed 96.0% of contamination, while those collected from the Oghi region had 80% aflatoxin contamination (Figure 2(a)).
Figure 2.
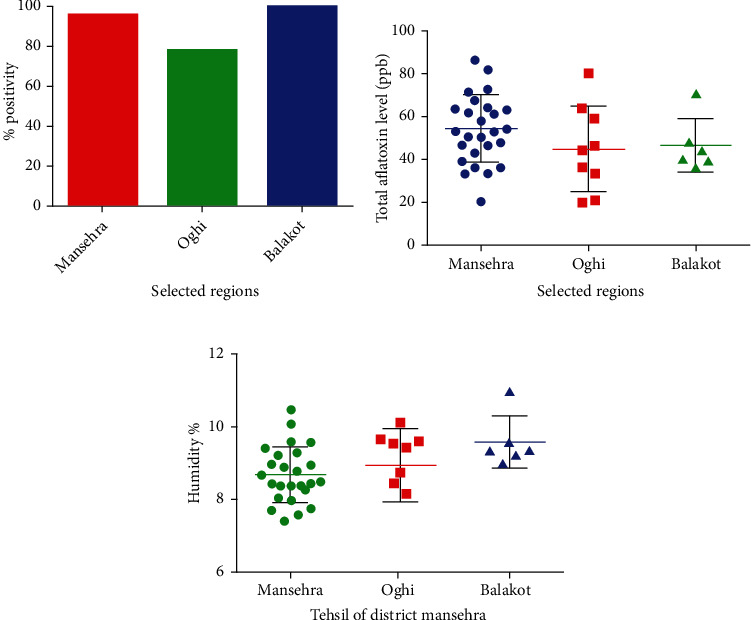
(a) Frequency, (b) total aflatoxin level, and (c) moisture content in poultry feed in selected regions of Mansehra, Pakistan. Results shown in (a) are represented in percentages, whereas results in (b, c) are shown as mean ± SEM of parts per billion and percent humidity of 40 samples tested.
Mean aflatoxin level in parts per billion was highest (54.56 ppb) in the Mansehra region, followed by the Balakot region (46.5 ppb) and Oghi region (44.8 ppb). There was no significant difference when mean parts per billion values were compared between each region (Figure 2(b)). The highest percentage of moisture content was detected in Balakot (9.56%), followed by Oghi (9.43%) and Mansehra (8.41%). Mean values of Balakot region were significantly higher when compared with Mansehra (with a p value of 0.015 by Student's unpaired t-test), whereas the rest of the comparisons did not reveal any statistical difference (Figure 2(c)).
3.3. Frequency, Total Aflatoxin Levels, and Moisture Contents in Different Types of Poultry Feed
Three different types of feed, i.e., broiler-starter feed, broiler-grower feed, and broiler-finisher feed, were targeted for a detailed evaluation of aflatoxin contamination. The highest frequency of aflatoxin positive samples was detected in grower feed samples (100%) followed by starter feed samples (94.4%) and in finisher (87.5%) (Figure 3(a)). Mean aflatoxin level in parts per billion was highest in grower feed samples (56.34 ppb) followed by finisher feed (50.38 ppb) and starter (49.52 ppb). There was no significant difference when mean parts per billion values of different feed types were compared (Figure 3(b)). However, the mean moisture content level was highest in finisher feed samples (9.07%) followed by starter (8.95%) and grower feed (8.22%). Mean values of moisture content in the finisher feed were significantly higher when compared to the grower with p value of 0.01 by Student's unpaired t-test. In contrast, the rest of the comparisons did not reveal any statistical difference (Figure 3(c)).
Figure 3.
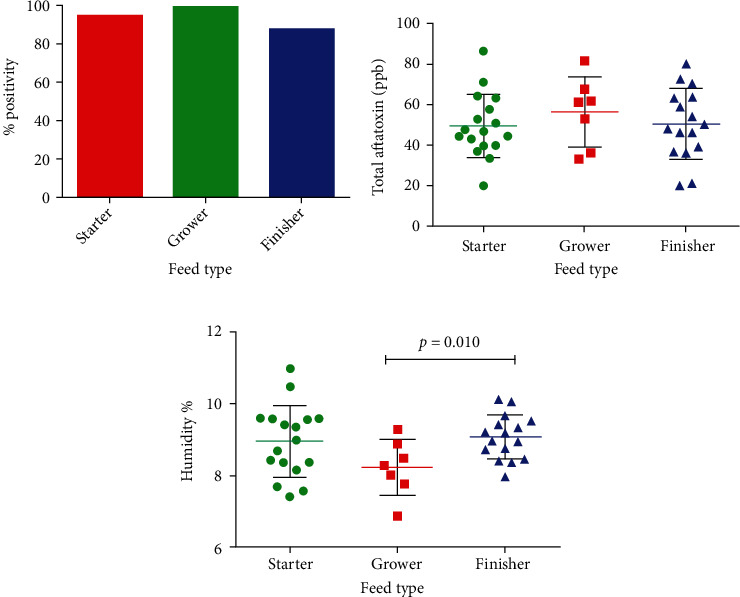
(a) Frequency, (b) total aflatoxin level, and (c) moisture content in different feed types. Results shown in (a) are represented in percentages, whereas results in (b, c) are shown as mean ± SEM of parts per billion and percent humidity of 40 samples tested.
3.4. Total Aflatoxin Level and Moisture Contents in Poultry Feed of Different Feed Companies
All 40 samples investigated in this study were from five different feed companies designated as A, B, C, D, and E. Names of companies are not mentioned to adhere to ethical guidelines. Feed from all the companies tested had 100% aflatoxin, except company D which had 75% positive aflatoxin samples (Figure 4(a)). Mean parts per billion of aflatoxin varied among different companies with the highest values reported from company A (59.50 ppb), followed by company C (59.50 ppb), E (47.8 ppb), B (45.6 ppb), and D (24.27 ppb) (Figure 4(b)). However, the highest moisture content was reported in company B (9.46%), followed by D (9.26%), A (8.84%), E (8.15%), and C (7.41%) (Figure 4(c)).
Figure 4.
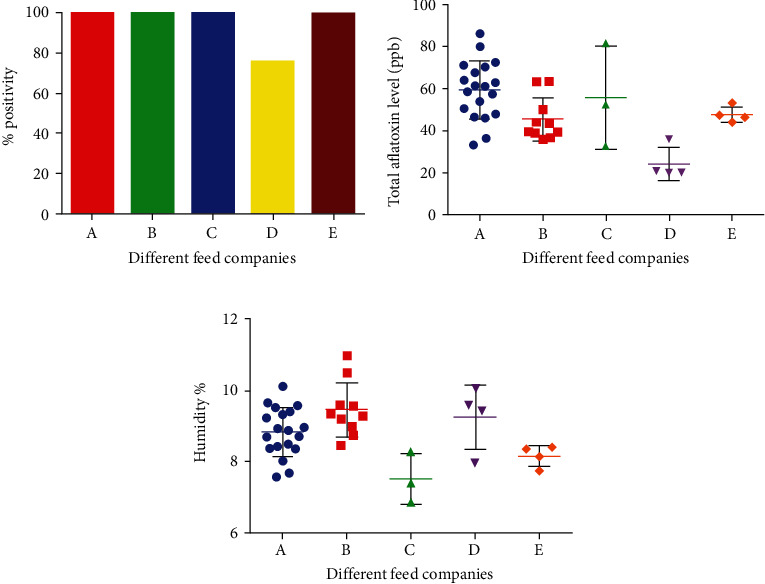
(a) Frequency, (b) total aflatoxin level, and (c) moisture content in poultry feed of different companies. Results shown in (a) are represented in percentages, whereas results in (b, c) are shown as mean ± SEM of parts per billion and percent humidity of 40 samples tested.
3.5. Correlation between Total Aflatoxin Level and Moisture Content
Correlation between moisture content and aflatoxin level was evaluated by drawing a scattered graph. Pearson's correlation coefficient revealed no significant degree of correlation between these two parameters. r2 was 0.05 with p value of 0.13 (Figure 5).
Figure 5.
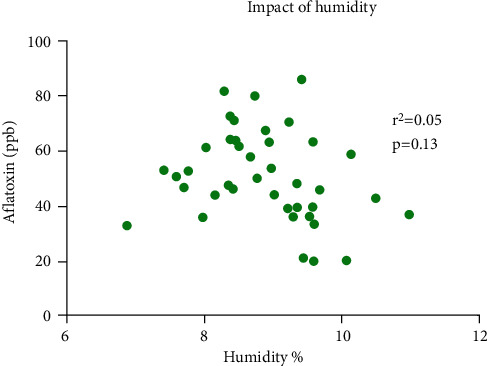
Correlation between moisture contents and total aflatoxin level of poultry feed using Pearson's correlation coefficient. Each dot represents one sample, whereas Y axis shows respective aflatoxin level in parts per billion, and X axis represents respective level of humidity in percent.
4. Discussion
Aflatoxins are toxic fungal metabolites that naturally contaminate poultry feed. A. flavus and A. parasiticus are the major species that produce these toxic secondary metabolites [22]. High temperature and humidity are optimal for mold growth and toxin production [23, 24]. According to the present study results, 92.5% of samples were found positive for the detection of aflatoxin ranging between 34 and 86.2 ppb. Such a high percentage of total aflatoxins might be due to the lack of awareness for proper storage of chicken feedstuff at the farm. In addition, other factors such as the lack of systems for appropriate airing and maintaining a suitable temperature are also likely to play a role in a higher percentage of contamination. Globally, different studies have reported varying frequencies and levels of aflatoxin. Rossi et al. [25] reported aflatoxins in 88.2% of samples collected from Brazil and analyzed through indirect competitive ELISA. Our findings are in good agreement with this study. Similarly, Anjum et al. [19] documented the high levels of AFB1 in commercial poultry feed ingredients collected from a specific region of Pakistan. Zinedine et al. [26] collected a few poultry feed samples (n = 21) from Morocco and observed that the percentage of contamination by aflatoxin is about 66.6%. Dawlatana et al. [27] reported the frequency and the level of aflatoxin in poultry feed from India and Bangladesh. In Bangladesh, the level ranged from 7 to 160 ppb, while in India, 60% of positive samples contained >10 ppb aflatoxins. Ata-Ur-Rehman et al. [28] reported that 42% of commercial poultry feed was contaminated with aflatoxins, which was quite low as compared to the findings of our study. The present study revealed that the level of total aflatoxin is higher in poultry feed of the Mansehra region, which is following the findings of Cavalheiro [29] who reported that aflatoxins are recurrent contaminants of harvested feed and foods and other grains stored under high-temperature conditions. Although moister content levels of the Mansehra region are lower compared to Oghi and Balakot regions, the temperature range of the Mansehra region is quite higher as compared to the other two, which may be the reason for higher aflatoxin contamination in feeds stored in this region. The level of total aflatoxin in poultry grower feed was found high compared to the other two feeds, i.e., starter and finisher. In different feed ingredients, the high levels of aflatoxin affect the quality of the grower feed. According to Xiulan et al. [30], the higher level of aflatoxin in grower feed is due to its ingredients. These findings are also in agreement with the results of del Pilar Monge et al. [31] who analyzed 108 poultry feed samples from Argentina and reported that 79 percent of grower poultry feed samples exceeded the maximum acceptable total fungal count which is an indication that aflatoxin levels may be higher due to high fungal counts. According to Ewaidah [32], 38% of grower feed samples were higher than the FDA plan of 20 μgkg1. In contrast, Anjum et al. [19] reported high levels of aflatoxins in chick starter and broiler ranging from 100 to 320 μgkg−1 among 700 samples tested. In conclusion, the present study provides information about the occurrence of aflatoxin in the broiler feed of District Mansehra Pakistan. From 40 samples investigated, about 92.5% were found positive in total aflatoxin. Three samples (7.5%) had quantities of 20 ppb in total aflatoxin. These figures are very high as compared to many of the studies reported previously. The results warrant the need for surveillance and constant monitoring programs. Considerably higher concentrations of total aflatoxin might risk the poultry industry with increased economic losses. To ensure food safety, aflatoxin contamination in different types of poultry feed should be monitored.
Acknowledgments
The authors would like to extend their sincere appreciation to the Researchers Supporting Project Number (RSP-2021/144), King Saud University, Riyadh, Saudi Arabia. The authors are also grateful to Livestock and Dairy Development (Research), KP, and Higher Education Commission of Pakistan (HEC) for financial support and access to research facilities.
Contributor Information
Kashif Syed Haleem, Email: kashifhaleem@hu.edu.pk.
Shakira Ghazanfar, Email: shakira_akmal@yahoo.com.
Data Availability
All data generated and analyzed during this study are included in this published article.
Conflicts of Interest
Authors declare no conflict of interest.
Authors' Contributions
Muhammad Naveed conducted the research. Kashif Syed Haleem designed the experiments. Isfahan Tauseef analyzed the data. Shakira Ghazanfar wrote the manuscript. Naseem Bano performed the collection of research data. Charles Oluwaseun Adetunji did grammar checking. Muhammad Hamzah Saleem and Huda Alshaya did English editing. Bilal Ahamad Paray contributed to the funding and English editing.
References
- 1.Binder E., Tan L., Chin L., Handl J., Richard J. Worldwide occurrence of mycotoxins in commodities, feeds and feed ingredients. Animal Feed Science and Technology . 2007;137(3-4):265–282. doi: 10.1016/j.anifeedsci.2007.06.005. [DOI] [Google Scholar]
- 2.Edds G., Bortell R. Biological effects of aflatoxins: poultry . Southern cooperative series bulletin; 1983. [Google Scholar]
- 3.Attia Y. A., Allakany H. F., Abd Al-Hamid A. E., Al-Saffar A. A., Hassan R. A., Mohamed N. A. Capability of different non-nutritive feed additives on improving productive and physiological traits of broiler chicks fed diets with or without aflatoxin during the first 3 weeks of life. Journal of Animal Physiology and Animal Nutrition (Berl) . 2013;97(4):754–772. doi: 10.1111/j.1439-0396.2012.01317.x. [DOI] [PubMed] [Google Scholar]
- 4.Lee H. J., Ryu D. Worldwide occurrence of mycotoxins in cereals and cereal-derived food products: public health perspectives of their co-occurrence. Journal of Agricultural and Food Chemistry . 2017;65(33):7034–7051. doi: 10.1021/acs.jafc.6b04847. [DOI] [PubMed] [Google Scholar]
- 5.Attia Y., Abd Al-Hamid A., Allakany H., Al-Harthi M., Mohamed N. Necessity of continuing of supplementation of non-nutritive feed additive during days 21–42 of age following 3 weeks of feeding aflatoxin to broiler chickens. Journal of Applied Animal Research . 2016;44:87–98. doi: 10.1080/09712119.2015.1013964. [DOI] [Google Scholar]
- 6.Bhat R., Rai R. V., Karim A. A. Mycotoxins in food and feed: present status and future concerns. Comprehensive Reviews in Food Science and Food Safety . 2010;9(1):57–81. doi: 10.1111/j.1541-4337.2009.00094.x. [DOI] [PubMed] [Google Scholar]
- 7.Yang C., Song G., Lim W. Effects of mycotoxin-contaminated feed on farm animals. Journal of Hazardous Materials . 2020;389, article 122087 doi: 10.1016/j.jhazmat.2020.122087. [DOI] [PubMed] [Google Scholar]
- 8.Chen B., Li D., Li M., et al. Induction of mitochondria-mediated apoptosis and PI3K/Akt/mTOR-mediated autophagy by aflatoxin B2 in hepatocytes of broilers. Oncotarget . 2016;7(51):84989–84998. doi: 10.18632/oncotarget.13356. [DOI] [PMC free article] [PubMed] [Google Scholar]
- 9.Gan F., Yang Y., Chen Y., Che C., Pan C., Huang K. Bush sophora root polysaccharide could help prevent aflatoxin B1-induced hepatotoxicity in the primary chicken hepatocytes. Toxicon . 2018;150:180–187. doi: 10.1016/j.toxicon.2018.05.019. [DOI] [PubMed] [Google Scholar]
- 10.Nazhand A., Durazzo A., Lucarini M., Souto E. B., Santini A. Characteristics, occurrence, detection and detoxification of aflatoxins in foods and feeds. Foods . 2020;9(5):p. 644. doi: 10.3390/foods9050644. [DOI] [PMC free article] [PubMed] [Google Scholar]
- 11.Chen C., Mitchell N. J., Gratz J., et al. Exposure to aflatoxin and fumonisin in children at risk for growth impairment in rural Tanzania. Environment International . 2018;115:29–37. doi: 10.1016/j.envint.2018.03.001. [DOI] [PMC free article] [PubMed] [Google Scholar]
- 12.Leslie J. F., Bandyopadhyay R., Visconti A. Mycotoxins: Detection Methods, Management, Public Health and Agricultural Trade . CABI; 2008. [DOI] [Google Scholar]
- 13.Hou L., Zhou X., Gan F., et al. Combination of selenomethionine and N-acetylcysteine alleviates the joint toxicities of aflatoxin B1 and ochratoxin A by ERK MAPK signal pathway in porcine alveolar macrophages. Journal of Agricultural and Food Chemistry . 2018;66(23):5913–5923. doi: 10.1021/acs.jafc.8b01858. [DOI] [PubMed] [Google Scholar]
- 14.Alshannaq A., Yu J. H. Occurrence, toxicity, and analysis of major mycotoxins in food. International Journal of Environmental Research and Public Health . 2017;14(6):p. 632. doi: 10.3390/ijerph14060632. [DOI] [PMC free article] [PubMed] [Google Scholar]
- 15.Sarma U. P., Bhetaria P. J., Devi P., Varma A. Aflatoxins: implications on health. Indian Journal of Clinical Biochemistry . 2017;32(2):124–133. doi: 10.1007/s12291-017-0649-2. [DOI] [PMC free article] [PubMed] [Google Scholar]
- 16.Obrian G., Georgianna D., Wilkinson J., et al. The effect of elevated temperature on gene transcription and aflatoxin biosynthesis. Mycologia . 2007;99(2):232–239. doi: 10.1080/15572536.2007.11832583. [DOI] [PubMed] [Google Scholar]
- 17.Srianujata S. Proceedings of FFTC-KU 2011 conference: International Seminar on Risk Assessment and Risk Management of Mycotoxins for Food Safety in Asia . Bangkok, Thailand: Kasetsart University; 2011. (Year) Published. Regulatory update and control measures for prevention and reduction of mycotoxins contamination in foods and feeds. [Google Scholar]
- 18.Sadiq M. Pakistan poultry sector still on an upward swing. World Poult . 2004;20:10–11. [Google Scholar]
- 19.Anjum M., Sahota A., Akram M., Ali I. Prevalence of mycotoxins in poultry feeds and feed ingredients in Punjab (Pakistan) The Journal of Animal and Plant Sciences . 2011;2:117–120. [Google Scholar]
- 20.Hanif N. Q., Naseem M., Khatoon S., Malik N. Prevalance of mycotoxins in poultry finished feed. Journal of Animal and Veterinary Advances . 2005 [Google Scholar]
- 21.Rashid N., Bajwa M., Rafeeq M., et al. Prevalence of aflatoxin B1 in finished commercial broiler feed from west central Pakistan. J Anim Plant Sci . 2012;22:6–10. [Google Scholar]
- 22.Ali N., Hashim N., Saad B., Safan K., Nakajima M., Yoshizawa T. Evaluation of a method to determine the natural occurrence of aflatoxins in commercial traditional herbal medicines from Malaysia and Indonesia. Food and Chemical Toxicology . 2005;43(12):1763–1772. doi: 10.1016/j.fct.2005.05.019. [DOI] [PubMed] [Google Scholar]
- 23.Abidin Z., Khatoon A., Arooj N., et al. Estimation of ochratoxin A in poultry feed and its ingredients with special reference to temperature conditions. British Poultry Science . 2017;58(3):251–255. doi: 10.1080/00071668.2017.1293797. [DOI] [PubMed] [Google Scholar]
- 24.Ventura M., Gómez A., Anaya I., et al. Determination of aflatoxins B1, G1, B2 and G2 in medicinal herbs by liquid chromatography–tandem mass spectrometry. Journal of Chromatography A . 2004;1048(1):25–29. [PubMed] [Google Scholar]
- 25.Rossi C. N., Takabayashi C. R., Ono M. A., et al. Immunoassay based on monoclonal antibody for aflatoxin detection in poultry feed. Food Chemistry . 2012;132(4):2211–2216. doi: 10.1016/j.foodchem.2011.12.067. [DOI] [Google Scholar]
- 26.Zinedine A., Juan C., Soriano J., Molto J., Idrissi L., Manes J. Limited survey for the occurrence of aflatoxins in cereals and poultry feeds from Rabat, Morocco. International Journal of Food Microbiology . 2007;115(1):124–127. doi: 10.1016/j.ijfoodmicro.2006.10.013. [DOI] [PubMed] [Google Scholar]
- 27.Dawlatana M., Coker R., Nagler M., Wild C., Hassan M., Blunden G. The occurrence of mycotoxins in key commodities in Bangladesh: surveillance results from 1993 to 1995. Journal of Natural Toxins . 2002;11(4):379–386. [PubMed] [Google Scholar]
- 28.Ata-Ur-Rehman R., Shakoori A., Rizvi S. Aflatoxin contamination of commercial poultry feeds in Punjab, Pakistan. Pakistan Journal of Zoology . 1990;22:387–398. [Google Scholar]
- 29.Cavalheiro A. C. Aflatoxin and aflatoxicosis—a review. World's Poultry Science Journal . 1981;37(1):34–38. doi: 10.1079/WPS19810004. [DOI] [Google Scholar]
- 30.Xiulan S., Xiaolian Z., Jian T., Xiaohong G., Jun Z., Chu F. Development of an immunochromatographic assay for detection of aflatoxin B1 in foods. Food Control . 2006;17(4):256–262. doi: 10.1016/j.foodcont.2004.10.007. [DOI] [Google Scholar]
- 31.Del Pilar Monge M., Magnoli C. E., Chiacchiera S. M. Survey of Aspergillus and Fusarium species and their mycotoxins in raw materials and poultry feeds from Córdoba, Argentina. Mycotoxin Research . 2012;28(2):111–122. doi: 10.1007/s12550-011-0121-8. [DOI] [PubMed] [Google Scholar]
- 32.Ewaidah E. Survey of poultry feeds for aflatoxins from Riyadh region. Arab Gulf Journal of Scientific Research . 1988;6:1–7. [Google Scholar]
Associated Data
This section collects any data citations, data availability statements, or supplementary materials included in this article.
Data Availability Statement
All data generated and analyzed during this study are included in this published article.