

Abstract
A large body of research has documented how personality develops across adulthood, yet very little longitudinal work has examined whether these findings generalize beyond predominantly middle-class, highly-educated White American or Western European individuals. This pre-registered study uses longitudinal data from 1,110 Mexican-origin adults who completed a well-validated personality measure, the Big Five Inventory, up to 6 times across 12 years. Individuals generally maintained their rank ordering on the Big Five over time (rs=.66–.80), and the relative ordering of the Big Five within persons was also highly stable (rs=.58–.66). All of the Big Five traits showed small, linear mean-level decreases across adulthood. These trajectories showed few associations with sociodemographic factors (sex, education level, and IQ) and cultural factors (generational status, age at immigration, Spanish/English language preference, Mexican cultural values, American cultural values, and ethnic discrimination). The statistically significant findings we did observe mostly concerned associations between cultural values and Extraversion, Agreeableness, and Openness. Acquiescence bias was also positively associated with Big Five personality trait scores at every wave. There was no evidence of mean-level change in the Big Five when including time-varying acquiescence scores as covariates in the models. Divergences between the present findings and previous research highlight the need to study personality development with more diverse aging samples.
Keywords: personality development, adulthood, Big Five, Mexican, generalizability
Decades of research have been dedicated to understanding how personality changes across the lifespan, and there seems to be a consensus that personality traits: (1) are both stable and changing, and (2) develop in socially-desirable ways over time (i.e., individuals increase on “positive” traits with age; McCrae et al., 1999; Roberts et al., 2006). Although personality psychologists have dedicated a significant amount of effort towards understanding cross-sectional age differences in personality traits across cultures (Terracciano, 2015), almost all longitudinal research on personality development has been conducted with predominantly middle-class, highly educated White American or Western European individuals. People who fall in this particular demographic sub-group only comprise 12% of the world population (Arnett, 2008), yet are dramatically overrepresented in psychological research more generally (Rad et al., 2018) and most longitudinal studies of personality stability and change are no exception. Thus, the question remains as to whether the personality development findings documented in past longitudinal research generalize to individuals from different socioeconomic backgrounds and ethnicities. The present study is the first to examine Big Five personality development using longitudinal data from a sample comprised exclusively of Mexican-origin adults, the vast majority of whom are 1st generation immigrants who have endured considerable economic hardship and other forms of adversity.
Stability and Change in the Big Five across Adulthood
Personality development can be quantified in three main ways: rank-order stability, profile stability, and mean-level change. Rank-order stability characterizes the degree to which individuals maintain their relative ordering on traits over time (e.g., if an individual is more extraverted than most people in young adulthood, are they also more extraverted than most people in middle adulthood and old age?). Previous work has shown that the Big Five are moderately-to-highly stable across adulthood, with test-retest correlations ranging from .54 to .70 across shorter time intervals and from .31 to .45 across long spans of time, such as 20–50 years (Damian et al., 2018; Roberts & DelVecchio, 2000).
Profile (or ipsative) stability characterizes the extent to which each individual’s configuration of personality traits (i.e., the relative ordering of traits within a person) remains consistent over time (e.g., if an individual has high levels of Extraversion and Openness and low levels of Conscientiousness, Agreeableness, Neuroticism as a young adulthood, do they have this same configuration of trait levels in middle adulthood and old age?). Previous work has shown that most individuals maintain a similar trait configuration over time, with the correlation averaging .61 over a 4-year period (Robins et al., 2001) and .63 across a 6-year period (Terracciano et al., 2010). These results suggest that individuals largely maintain their personality trait configuration over time, although there has been little work on this topic.
Finally, mean-level change characterizes the degree to which individuals, on average, show absolute increases, decreases, or no changes in a personality trait over time (e.g., does an individual’s level of Extraversion increase, decrease, or remain the same across the lifespan?). Previous work has suggested that individuals, on average, show marked increases in Agreeableness, Conscientiousness, and Emotional Stability from young adulthood to midlife (a pattern often referred to as the maturity principle), and then declines in these traits in old age (Costa et al., 2019; Roberts et al., 2006; Wortman et al., 2012; but see Graham et al., 2020 for some discrepant findings). Further, individuals generally exhibit small (or no) mean-level increases in Extraversion and Openness to Experience from early to middle adulthood, and then subsequently decline in these traits in late life (Costa et al., 2019; Roberts et al., 2006; Wortman et al., 2012).
Generalizability of Big Five Personality Development Trends
Personality scientists are quick to tout the replicability of the developmental trends described above, but their enthusiasm should be tempered by a critical unanswered question: to what extent do these findings generalize to more diverse samples? This question remains unanswered because there are remarkably few longitudinal studies of personality development in ethnic minority and/or low socioeconomic status (SES) samples, and the vast majority of prior longitudinal work has been conducted using predominantly middle-class, highly educated White American or Western European samples (but see Chopik & Kitayama, 2017; Löckenhoff et al., 2008). Although cross-sectional studies have explored the generalizability of age differences in personality (De Bolle et al., 2015; McCrae et al., 1999; McCrae et al., 2004; Walton et al., 2013) and age stereotypes of personality (Chan et al., 2012) across cultures, these studies provide little insight into developmental changes in personality. Prospective, longitudinal data are needed to understand how patterns of personality stability and change vary across sociocultural groups. We can begin to redress this imbalance using data from our large, longitudinal study of Mexican adults. We extend prior work not just in terms of sample characteristics, but also with regard to whether the personality trends observed in prior research vary as a function of cultural factors such as generational status (1st generation vs. 2nd+ generation), age of immigration to the U.S., language of interview (Spanish vs. English), Mexican cultural values, American cultural values, and personal experiences with ethnic discrimination. Moreover, as in past research, we also examine whether Big Five personality development varies as a function of other factors including sex, education level, IQ, and acquiescence response bias (the tendency to agree with all interview questions).
A Cultural Framework for Understanding Big Five Personality Development
Apart from gaining a better understanding of the generalizability of prior work to our sample of Mexican-origin adults, the present study also allows us to examine the predictors of within-group variability in personality development. Examining within-group variability in developmental and aging processes among ethnic minority adults is rare, but important, as it allows researchers to move away from the false need for a “comparison” or “control” group (Whitfield & Baker-Thomas, 1999). Further, examining individual differences in psychological processes within groups promotes a better understanding of the human experience and allows researchers to draw more comprehensive and inclusive conclusions about how all individuals develop.
There are two competing possibilities as to how personality develops for individuals from different sociocultural groups. On the one hand, an argument could be made that personality development is a normative (i.e., universal) developmental process, due to intrinsic maturational processes that occur with age (e.g., based on age-related biologically programmed changes) and common developmental milestones, tasks, and environments in which individuals find themselves as they get older such as adult social roles. Research has shown that genetic factors contribute to personality maturation in adulthood (Briley & Tucker-Drob, 2014), and these factors can account for normative personality development because they likely exert the same age-graded influences on traits across all individuals (regardless of the socio-cultural group to which they belong). Likewise, environmental perspectives, such as Social Investment Theory, suggest that universal social roles are responsible for normative personality maturation across the life course (Roberts & Wood, 2006). That is, individuals who enter into social roles (e.g., becoming an employee, spouse, and/or parent) experience socially desirable changes in Agreeableness, Conscientiousness, and Neuroticism as a result of the norms, constraints, and expectations that new social roles place on their personalities (Roberts & Wood, 2006). Because these social roles are “universal” (i.e., almost everyone experiences them), the direction in which personality traits change with age are also universal (Bleidorn et al., 2013). However, the timing of personality trait change differs depending on when the transition into “universal” social roles occurs (Bleidorn et al., 2013; but see McCrae et al., 2021; Terracciano, 2014). To the extent that the intrinsic maturational (e.g., age-graded biological changes) and social investment perspectives are true, we might expect that the generalizability of personality development trends is quite high across individuals from different nationalities, races/ethnicities, and socioeconomic circumstances because the same developmental genetic and environmental pressures operate regardless of the sociocultural groups to which one belongs.
On the other hand, because individuals develop in ever-changing and complex cultural environments, an argument could be made that individuals from different socio-cultural backgrounds should show important differences in the way their personality develops. This is likely due to complex interactions between one’s intrinsic propensities and sociocultural environments, given that the heritability of biologically-based behavioral phenotypes can shift as a result of generational and other socio-contextual factors shared among members of the same sociocultural group (Tropf et al., 2017). Specific to the present study, personality change may be affected by socio-contextual factors that uniquely affect ethnic minority groups in the United States. For example, although Garcia Coll and colleagues’ (1996) Integrative Model was initially proposed to explain the developmental competencies of ethnic minority children, it is also useful for thinking about the development and aging of ethnic minority adults. The Integrative Model proposes that developmental processes for ethnic minority individuals have unique components that are not shared by the majority culture such that ethnic minority individuals experience social stratification mechanisms – racism, segregation, and prejudice – that permeate all levels of one’s environment and thus, influence all subsequent developmental processes (Causadias & Umaña-Taylor, 2018; Garc’ıa Coll et al., 1996). Specific to the present study, not only are the participants of Mexican-origin, but the vast majority are also first-generation, Spanish-speaking individuals who immigrated to the United States as adults and have faced many socioeconomic challenges. It would be remiss to suggest that the acculturative stress of immigration and the social stratification mechanisms (racism, segregation, prejudice) these individuals have experienced would not affect their psychological development. The present study will be the first to examine how within-group variability in generational status, age at immigration, language preference, cultural values, and personal experiences with ethnic discrimination among Mexican-origin adults impacts the way their Big Five personality traits develop across adulthood.
Variability in Big Five Personality Development as a Function of Socio-Demographic Factors
Previous meta-analytic work suggests that there are little or no systematic differences between men and women in Big Five mean-level change patterns across adulthood (Roberts, Walton, & Viechtbauer, 2006). More recently, a coordinated analysis of 16 longitudinal studies of Big Five development across adulthood also showed few differences between men and women in Big Five mean-level change, with one exception: women tend to have higher levels of Neuroticism and steeper declines over time compared to men (Graham et al., 2020).
Prior cross-sectional work on the Big Five correlates of education level and IQ has found that Openness to Experience shows the most robust associations with education level and IQ (e.g., Bartels et al., 2012; Osmon et al., 2018; Rammstedt et al., 2016; Rammstedt et al., 2018; Sutin et al., 2011; von Stumm et al., 2009). However, there is very little longitudinal research on whether education level or IQ are associated with personality development (Löckenhoff et al., 2008; Sutin et al., 2017). Based on the few extant studies, we expect that education level and IQ will have the strongest impact on the development of Openness to Experience and Conscientiousness, such that more educated individuals, and those with higher IQ, will show greater increases in Openness to Experience and Conscientiousness over time.
Last, we expect acquiescence bias to be relatively strong in the present sample, given that the participants in our study have less formal education than the participants used to validate the Big Five Inventories (John et al., 2008; Laajaj et al., 2019; Soto & John, 2016). Previous research has found that acquiescent responding for the Big Five is remarkably stable across eight years (Wetzel et al., 2016), but to our knowledge, there has been no work on the impact of acquiescence bias on stability and change in the Big Five. We have no predictions about the impact of acquiescence bias on mean-level change in the Big Five; the present analyses are exploratory.
The Present Study
The present study uses a cohort-sequential (accelerated) longitudinal design spanning 12 years to examine stability and change in the Big Five, with participants ranging in age from 26 to 65 at the first assessment. Thus, our study design and sample covers personality development across most of adulthood. Moreover, we use one of the most frequently used and well-validated personality tests, the Big Five Inventory (John & Soto, in press; Soto & John, 2016). We also examine how the observed developmental trajectories vary as a function of several important cultural and sociodemographic factors (generational status, age at immigration, language preference, Mexican cultural values, American cultural values, personal experiences with ethnic discrimination, sex, education level, IQ) and acquiescence bias. Most important, the present study will be one of the first to use longitudinal data to examine the generalizability of personality development trends across adulthood in a sample comprised entirely of Mexican-origin individuals, the majority of whom immigrated to the United States as adults and have experienced a high degree of socioeconomic disadvantage.
The present study addresses the following research questions: (1) What are the rank-order stabilities of the Big Five domains across adulthood? (2) What is the profile stability of the Big Five across adulthood? (3) What are the mean-level trajectories of the Big Five domains across adulthood? (4) Does the degree of mean-level change in the Big Five vary by cultural factors (i.e., generational status, language of Big Five measure, age at immigration, Mexican cultural values, American cultural values, personal experiences with ethnic discrimination) and socio-demographic factors (i.e., sex, education level, IQ)? and (5) Do the personality trajectories differ when controlling for acquiescence bias?
Method
Participants and Procedures
We used data from the California Families Project, a longitudinal study of 674 Mexican-origin families. In the present study, we focused on data from the mothers and fathers who participated in the study (total N = 1,110 at the first assessment).1,2 To recruit families, children were drawn at random from rosters of students from the Sacramento and Woodland, CA school districts. The focal child had to be in the 5th grade, of Mexican origin, and living with his or her biological mother, in order to participate in the study. Approximately 72.6% of the eligible families agreed to participate in the study, which was granted approval by the University of California Davis Institutional Review Board (Protocol # 217484-21; Mexican Family Culture and Substance Use Risk and Resilience). The first assessment occurred in 2006–07 (Wave 1), and subsequent follow-up assessments were conducted annually through Wave 10 and then biennially to Wave 11 (2017–18). Participants were interviewed in their homes in Spanish or English, depending on their preference. Interviewers were all bilingual and almost all of Mexican heritage.
The analysis plan for the present study was pre-registered on the Open Science Framework (OSF). The pre-registration, a list of deviations from the pre-registration, study materials, Mplus syntax, and output can be found on the project OSF page here: https://osf.io/2gpm9/.3 The present study used data from the mothers and fathers at Waves 1, 3, 5, 7, 10 (mothers only), and 11 (total timespan = 12 years).4 Of the original 1,110 mothers and fathers, 87%, 90%, 86%, 81%, and 80% were interviewed at Waves 3, 5, 7, 10, and 11, respectively (note that in some cases, participants were interviewed but did not complete the Big Five Inventory (BFI); see Table 1 for exact Ns by wave). At the first assessment, the median participant age was 37.7 years old (Mean = 38.3 years, SD = 6.09, range = 26 to 65; 61% female). The median ages at Waves 3 through 11 were 39.7 years, 41.4 years, 43.4 years, 45.7 years, and 48.3 years, respectively. The median household income at Wave 1 was $32,500, and approximately 38% of families were living below the U.S. federal poverty line.
Table 1.
Descriptive Statistics
| Wave 1 | Wave 3 | Wave 5 | Wave 7 | Wave 10 | Wave 11 | |||||||||||||
|---|---|---|---|---|---|---|---|---|---|---|---|---|---|---|---|---|---|---|
| N | M (SD) | α | N | M (SD) | α | N | M (SD) | α | N | M (SD) | α | N | M (SD) | α | N | M (SD) | α | |
| Extraversion | 1,041 | 2.94 (.41) | .69 | 954 | 2.94 (.41) | .70 | 996 | 2.90 (.40) | .71 | 957 | 2.93 (.41) | .76 | 582 | 2.83 (.31) | .73 | 882 | 2.84 (.30) | .70 |
| Agreeableness | 1,041 | 3.09 (.33) | .60 | 954 | 3.15 (.34) | .65 | 996 | 3.15 (.33) | .69 | 957 | 3.14 (.34) | .72 | 582 | 3.05 (.31) | .79 | 882 | 3.05 (.29) | .73 |
| Conscientiousness | 1,041 | 3.05 (.34) | .67 | 954 | 3.09 (.35) | .70 | 996 | 3.09 (.35) | .75 | 957 | 3.09 (.35) | .78 | 582 | 3.04 (.33) | .83 | 882 | 3.03 (.29) | .78 |
| Neuroticism | 1,041 | 2.27 (.40) | .65 | 954 | 2.24 (.42) | .69 | 996 | 2.23 (.42) | .74 | 957 | 2.19 (.43) | .76 | 582 | 2.17 (.34) | .78 | 882 | 2.18 (.31) | .70 |
| Openness | 1,041 | 2.91 (.36) | .73 | 954 | 2.97 (.38) | .76 | 996 | 2.94 (.37) | .79 | 957 | 2.96 (.36) | .79 | 582 | 2.82 (.29) | .68 | 882 | 2.80 (.27) | .63 |
| Acquiescence | 1,041 | 2.75 (.21) | -- | 954 | 2.74 (.22) | -- | 996 | 2.70 (.21) | -- | 957 | 2.67 (.19) | -- | 582 | 2.61 (.15) | -- | 882 | 2.63 (.14) | -- |
Note. Only mothers (no fathers) were assessed at Wave 10. The distribution of the number of data points per age group was 109 data points for < 30 years old, 1,889 data points for 30–40 years old, 2,589 data points for 40–50 years old, 808 data points for 50–60 years old, and 97 data points for 60+ years old.
To investigate the potential role of attrition, we compared individuals who did and did not participate in the Wave 11 assessment on study variables (i.e., Big Five, generational status, language use, age at immigration, Mexican and American cultural values, ethnic discrimination, sex, education level and IQ) assessed at Wave 1. Compared to individuals who did not participate at Wave 11, individuals who participated at Wave 11 had higher education levels (M = 9.26 vs. 8.81, p = .04, d = .13), higher neuroticism (M = 2.29 vs. 2.22, p = .02, d = .18), lower conscientiousness (M = 3.04 vs. 3.10, p = .01, d = −.18), and endorsed fewer American cultural values (M = 2.71 vs. 2.79, p = .02, d = .18) at Wave 1. The Wave 11 participation rates for mothers and fathers were significantly different from one another, with 84.3% of mothers and 62.7% of fathers participating at the Wave 11 assessment (p < .001). There were no significant attrition differences for Extraversion, Agreeableness, Openness to Experience, generational status, age at immigration, language, Mexican cultural values, ethnic discrimination, verbal IQ, and fluid IQ, all ps > .05.
Measures
Big Five personality traits.
Participants were administered (in an interview format) the 44-item Big Five Inventory (BFI; John et al., 2008) at Waves 1, 3, 5, 7, and the 60-item Big Five Inventory-2 (BFI-2; Soto & John, 2016) at Waves 10 and 11. For both the BFI and the BFI-2, participants rated each item on a 4-point Likert scale, ranging from 1 (strongly disagree) to 4 (strongly agree). Benet-Martinez and John (1998) translated the BFI into Spanish and tested it with college students in Spain and the United States, a college-educated sample of bilingual Hispanics, and a working-class bilingual Hispanic sample. All items that were new to the BFI-2 (i.e., items that were not on the original BFI) were translated into Spanish using standard translation-back translation procedures by California Families Project staff interviewers, all of whom were native Spanish-speakers and of Mexican heritage.
Given that one of our research questions concerns mean-level change over time, it is critical to ensure that the switch from using the BFI at Waves 1, 3, 5, and 7 to using the BFI-2 at Waves 10 and 11 did not create a measurement artifact that would lead to erroneous conclusions about mean-level changes in the Big Five. Exploratory analyses revealed that two items that were only on the BFI (“prefers work that is routine”; “is reserved”) and two items that were only on the BFI-2 (“feels little sympathy for others”; “rarely feels anxious or afraid”) did not function well in the present sample and were not used in scoring the Big Five scales (see the Supplemental Material and Table S1 for more details). After removing these items, there were 7 BFI and 12 BFI-2 items for Extraversion, 9 BFI and 11 BFI-2 items for Agreeableness, 9 BFI and 12 BFI-2 items for Conscientiousness, 8 BFI and 11 BFI-2 items for Neuroticism, and 9 BFI and 12 BFI-2 items for Openness to Experience.
Using these items, we examined longitudinal measurement invariance and found that all of the Big Five domains were partially strong or strong invariant (see Table S2), suggesting that we measured the same constructs over time and are able to draw conclusions about meaningful mean-level changes in the Big Five that are not attributable to differences in assessment wave or instrument. The latent variable factor scores correlated between .94 and .99 with the observed scores for the Big Five domains, suggesting that there were few differences between scoring the Big Five as latent versus observed variables. Thus, in the service of model parsimony and ease of interpretation, we used observed scale scores for all subsequent analyses. Observed scale scores were computed by averaging across items. Across waves, alpha reliabilities ranged from .69 to .76 for Extraversion, .60 to .79 for Agreeableness, .67 to .83 for Conscientiousness, .65 to .78 for Neuroticism (scored in the direction of Neuroticism), and .63 to .80 for Openness to Experience (see Table 1 for alphas at each wave).
Generational status.
At Wave 1, participants reported where they were born. 86% of participants were born in Mexico and classified as 1st generation. The remaining 14% were born in the U.S. and classified as 2nd+ generation.
Age of immigration.
At Wave 1, participants reported the age when they first came to live in the U.S. The median age of immigration was 20 years old, and ranged from 0 years (born in the U.S.) to 50 years old (Mean = 21.6, SD = 7.49).
Language preference.
Because language preferences were highly stable over time, we used the language (English vs. Spanish) of the BFI at Wave 1 as a time-invariant predictor of the Big Five trajectories. Language was coded as “0” if the participant completed the BFI in English (17%), and as “1” if the participant completed the BFI in Spanish (83%).
Mexican and American cultural values.
At Wave 1, participants completed the 50-item Mexican American Cultural Values Scale (MACVS; Knight et al., 2010), which assesses the extent to which they endorse Mexican cultural values (traditional gender roles, religiosity, respect, and familism; 36 items) and American cultural values (self-reliance, material satisfaction, competition, and independence; 14 items). Participants reported on their Mexican and American cultural values using a 4-point scale ranging from 1 (not at all) to 4 (very much). We computed the average of 36 items for Mexican cultural values (M = 3.41, SD = .31) and 14 items for American cultural values (M = 2.73, SD = .45) to use as time-invariant predictors of the Big Five trajectories. Alpha reliabilities were .88 for Mexican cultural values and .78 for American cultural values.
Ethnic discrimination.
At Wave 1, participants reported on 10 items that assessed the degree to which they had personal experiences with discrimination and prejudice in their community because of their Mexican/Mexican-American identity. These items were adapted for the present study from two measures of workplace discrimination (Hughes & Dodge, 1997; James, Lovato, & Cropanzano, 1994) and from the University of Michigan’s National Study of American Lives, and includes items such as, “People assume that you are not as smart or capable as others because you are [Mexican/Mexican-American]” and “You are called names or insulted because you are [Mexican/Mexican-American].” Participants responded to the items on a 4-point Likert scale ranging from 1 (almost never or never) to 4 (almost always or always). We computed the average of the 10 items at Wave 1 (M = 1.35, SD = .39) to use as a time-invariant predictor of the Big Five trajectories. Alpha reliability for perceived ethnic discrimination was .87.
Education level.
At Wave 1, participants reported their education level using an open-ended question, “What is the highest grade you have completed?” Responses were recorded as numeric values equivalent to the highest grade completed (e.g., 9 = 9th grade). The median education level was 9th grade in the present sample (Mean = 9.1, SD = 3.5). Two percent of the sample have a college degree.
IQ.
At Wave 1, participants completed several subscales from the Woodcock-Johnson III Test (Woodcock, Mather, & McGrew, 2001), a widely-used measure of cognitive ability, including four subscales that assessed verbal ability (vocabulary, synonyms, antonyms, verbal analogies) and one subscale that assessed fluid intelligence (visual matching). In the present sample, the median verbal IQ score was 88 (Mean = 88.1, SD = 7.61) and the median fluid IQ score was 86 (Mean = 85.6, SD = 11.42).
Statistical Analyses
All analyses were conducted using Mplus Version 8 (Muthén & Muthén, 1998–2011). Mplus syntax and output can be found here: https://osf.io/2gpm9/. We used a robust maximum likelihood estimator (MLR) to account for non-normal distributions of observed variables and full information maximum likelihood procedure (FIML) to account for missing data (Allison, 2003; Schafer & Graham, 2002). We used observed variables for the Big Five and all predictors (i.e., sex, generational status, age at immigration, language, cultural values, ethnic discrimination, education level, and IQ).
To test rank-order stability, we computed test-retest correlations of the Big Five at adjacent assessments and across the entire study period (Wave 1 to Wave 11). We also calculated disattenuated test-retest correlations to account for measurement error (Heise, 1969). To test profile stability of the Big Five, we computed double-entry intraclass correlation coefficients (ICCs) at adjacent assessments and across the entire study period (McCrae, 2008; Terracciano, McCrae, & Costa, 2010).
Because of our longitudinal cohort sequential (accelerated) design, we conducted univariate latent growth curve (LGC) models scaled by continuous age (rather than by assessment wave) to examine growth (i.e., mean-level change) in the Big Five domains over time. These models aggregate the developmental trajectories from each person across the study period into one overall developmental trajectory, which spanned from the youngest (26 years) to oldest (84 years) time-points available in the data. Generally, LGC models describe the average initial level (intercept) and growth over time (slope) of a construct, as well as how much variability there is in the intercept and slope. In all univariate LGC models we centered the time scores at age 26 (the age of the youngest participant at the first assessment) to facilitate interpretation.
To find the best-fitting growth trajectory for each trait, we conducted a series of model comparisons and evaluated changes in Akaike Information Criterion (AIC) and Bayesian Information Criterion (BIC). Specifically, we compared three models: (1) no growth model, where only an intercept parameter is specified; (2) linear growth model, where a fixed linear change parameter is specified and the slope factor loadings are set to be equal to the participants’ centered age at each measurement occasion; and (3) a quadratic model, where a fixed quadratic change parameter is specified and the slope factor loadings are set to be equal to the participants’ squared centered age at each measurement occasion. Last, we conducted additional models to examine whether there are significant individual differences in participants’ initial level and trajectories by modeling the intercept and growth parameters as random (vs. fixed) effects.
To examine whether the personality trajectories differed by sex (women vs. men), generational status (1st vs. 2nd+ generation), and language (Spanish vs. English), we estimated multiple-group LGC models. Specifically, we compared a multiple group model that constrained the means of the intercepts and slopes to be equal across groups to a multiple group model that allowed the means of the intercepts and slopes to be freely estimated across groups. If the constrained model did not fit significantly worse than the freely estimated model, then we concluded that the developmental trajectory was the same across groups. To examine the association between age at immigration, Mexican and American cultural values, personal experiences with ethnic discrimination, education level, IQ and the Big Five trajectories, we entered each as a time-invariant covariate into the univariate LGC models by regressing the level and slope of each trait trajectory onto each predictor (in separate models). We adjusted the p-value to correct for multiple testing and consider p ≤ .001 as statistically significant.
Last, to examine the role of acquiescence bias, we computed an acquiescence index for each participant using the procedure recommended by Soto, John, Gosling, and Potter (2008) for the BFI and by Soto and John (2016) for the BFI-2. Specifically, for the BFI, we computed individual differences in acquiescence by averaging together responses on 32 items (a set of 16 pairs of BFI items with opposite implications for personality) at Waves 1, 3, 5, and Wave 7. Because the original BFI contained imbalanced content, using this subset of items (instead of all 44) to compute acquiescence eliminates the possibility of conflating the direction of item keying with personality content, and instead, equates the number of true-keyed and false-keyed items for each Big Five domain. For the BFI-2, we computed individual differences in acquiescence by averaging together all 60 items (without reversing the false-keyed items) at Waves 10 and 11 because the BFI-2 was revised to have a fully content-balanced item set. Then, we included the acquiescence indices as time-varying covariates of the occasion-specific personality scores in the LGC model.
Results
Table 1 shows descriptive statistics (Ns, means, standard deviations, alphas) of the Big Five at each wave. Because the men and women in the present study are in a long-term relationship with each other, we also conducted preliminary analyses to examine whether there is dependency in the Big Five scores. When we computed the intraclass coefficients (ICC) of the Big Five domains within couples at the first assessment, we found that Agreeableness (ICC = .19, p < .001), Neuroticism (ICC = .11, p = .02), and Openness (ICC = .09, p = .04) scores were significantly associated, suggesting some evidence for assortative mating. These associations indicated that we should use the CLUSTER option in Mplus to account for the dependency in the data and estimate less biased standard errors. For all subsequent latent growth curve analyses, we report the results when we use the CLUSTER option in Mplus. To maintain consistency across the Big Five, we used the CLUSTER estimation for the Extraversion and Conscientiousness models as well, even though men and women’s scores were not significantly associated at the first assessment (ICC = −.07, p = .92 and ICC = .07, p = .08, respectively).
Rank-Order Stability of the Big Five across Adulthood
Table 2 shows the test-retest correlations of the Big Five domains at adjacent assessments, as well as from the first to last assessment (see Table S3 for the full correlation matrix). There are several patterns worth noting from these associations. First, the Big Five were moderately-to-highly stable across 2- and 3-year intervals in adulthood; on average, these test-retest correlations ranged from .49 to .62 (.66 to .80 after disattenuating for measurement error). Second, the Big Five domains showed a moderate degree of rank-order stability even across the entire period from Wave 1 to 11 (average test-retest correlation was .33, and .48 after disattenuating for measurement error), suggesting that individuals maintain their relative ordering on the Big Five across more than a decade of life. Third, Extraversion generally showed the highest rank-order stability, whereas Agreeableness and Openness showed the lowest rank-order stabilities; this same pattern held after disattenuating for measurement error.
Table 2.
Test-Retest Correlations of the Big Five Personality Traits
| Wave 1 to Wave 3 | Wave 3 to Wave 5 | Wave 5 to Wave 7 | Wave 7 to Wave 10 | Wave 10 to Wave 11 | Wave 1 to Wave 11 | |
|---|---|---|---|---|---|---|
| Extraversion | .59 (.85) | .64 (.91) | .68 (.93) | .56 (.75) | .58 (.81) | .38 (.55) |
| Agreeableness | .47 (.75) | .55 (.82) | .55 (.78) | .48 (.64) | .40 (.53) | .29 (.44) |
| Conscientiousness | .54 (.79) | .56 (.77) | .62 (.81) | .56 (.70) | .48 (.60) | .34 (.47) |
| Neuroticism | .61 (.91) | .63 (.88) | .66 (.88) | .52 (.68) | .53 (.72) | .35 (.52) |
| Openness | .51 (.68) | .57 (.74) | .61 (.77) | .43 (.59) | .44 (.67) | .28 (.41) |
| Mean | .54 (.80) | .59 (.82) | .62 (.83) | .51 (.67) | .49 (.66) | .33 (.48) |
| Time interval | 2 years | 2 years | 2 years | 3 years | 2 years | 11 years |
Note. All coefficients are statistically significant at p < .001. Values in parentheses are the disattenuated test-retest correlations, which correct for measurement error in the scales.
We also conducted analyses to examine whether there were any age effects on rank-order stability (i.e., do individuals become more or less stable with age?). The average test-retest correlations by age group (across the Big Five domains) were .53 for age 30–40, .55 for age 40–50, and .59 for 50–60 year olds.5 These results suggest that there are small age effects on rank-order stability, in that people become more stable on the Big Five domains as they get older.
Profile Stability of the Big Five across Adulthood
The average profile stability of the Big Five (as assessed by double-entry ICCs) was: .58 from Wave 1 to Wave 3, .63 from Wave 3 to Wave 5, .66 from Wave 5 to Wave 7, .59 from Wave 7 to Wave 10, .66 from Wave 10 to Wave 11, and .48 across the entire study period, from Wave 1 to Wave 11. These findings show that the within-person configuration of Big Five traits was moderately stable over time, indicating that ordering of the Big Five within each person is largely maintained across adulthood. The average double-entry ICCs by age group were .63 for age 30–40, .64 for age 40–50, and .60 for 50–60 year olds.
Mean-Level Change of the Big Five across Adulthood
All Big Five scores at each wave were z-scored (according to the Wave 1 means and standard deviations) to facilitate interpretation.6 Table S4 shows the model comparisons from the univariate latent growth curve models. For all Big Five domains, the linear change models showed the lowest AIC and BIC values compared to the no change and quadratic change models, suggesting that we have the most certainty that linear trends are evident in this dataset.7
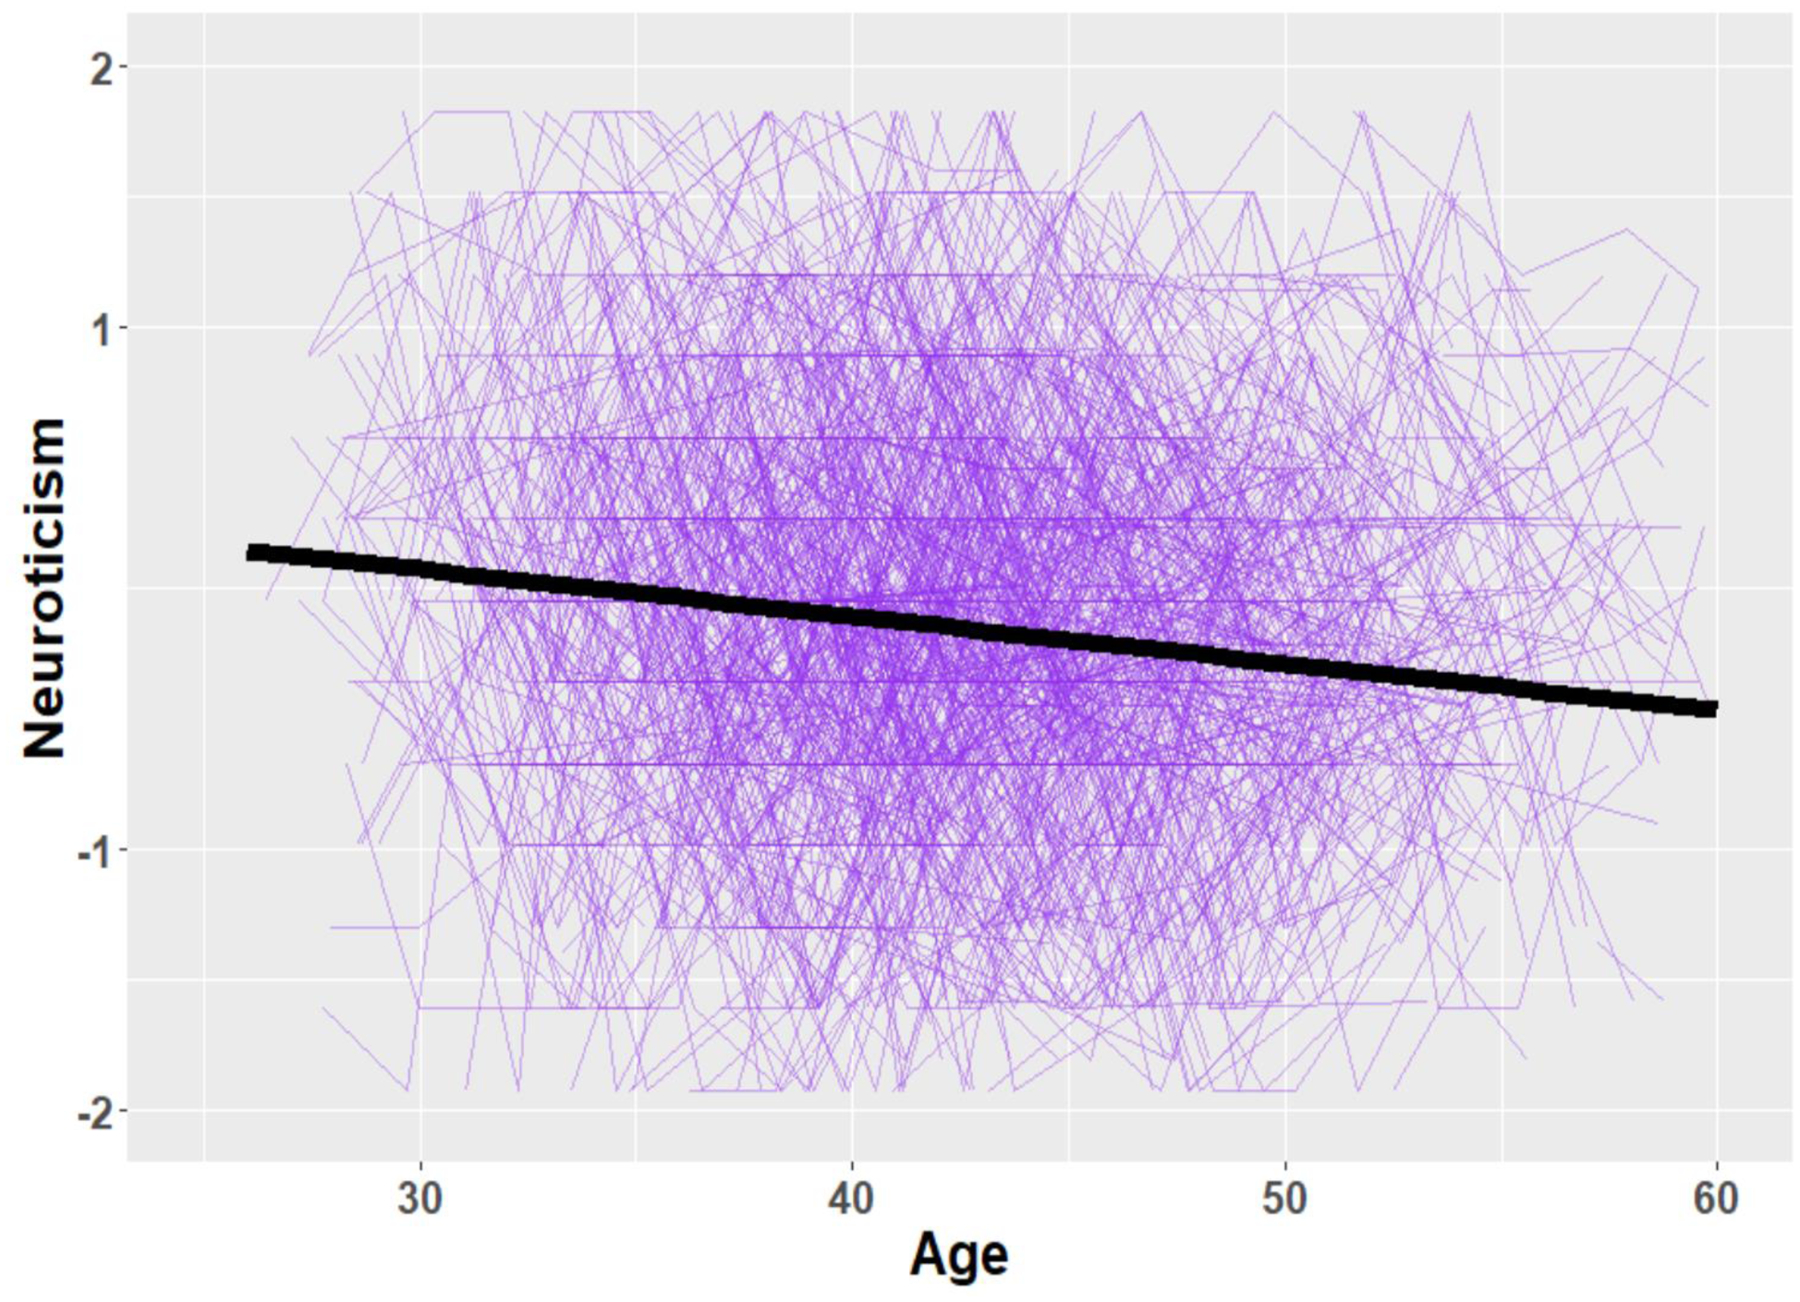
In Figures 1–5, the Big Five mean-level trajectories of the sample are represented by the bold, black lines, and all of the individual participants’ Big Five trajectories are represented by the thin colored lines. We found that all of the Big Five domain scores linearly decreased across adulthood. We conducted follow-up analyses to further examine whether there were significant individual differences in change across adulthood. We compared the models where the variances of the intercept and linear slopes were fixed at zero versus when the variances of the intercept and linear slope are freely estimated, and examined changes in AIC and BIC. Table S5 (supplemental material) shows the results from these model comparisons. In all cases, when we modeled individual differences in change (freely estimated model), the AIC and BIC values were lower. Thus, we have some certainty that allowing for individual differences in Big Five change across adulthood are a better representation of the data.
Figure 1. Mean-level change in Extraversion across adulthood.
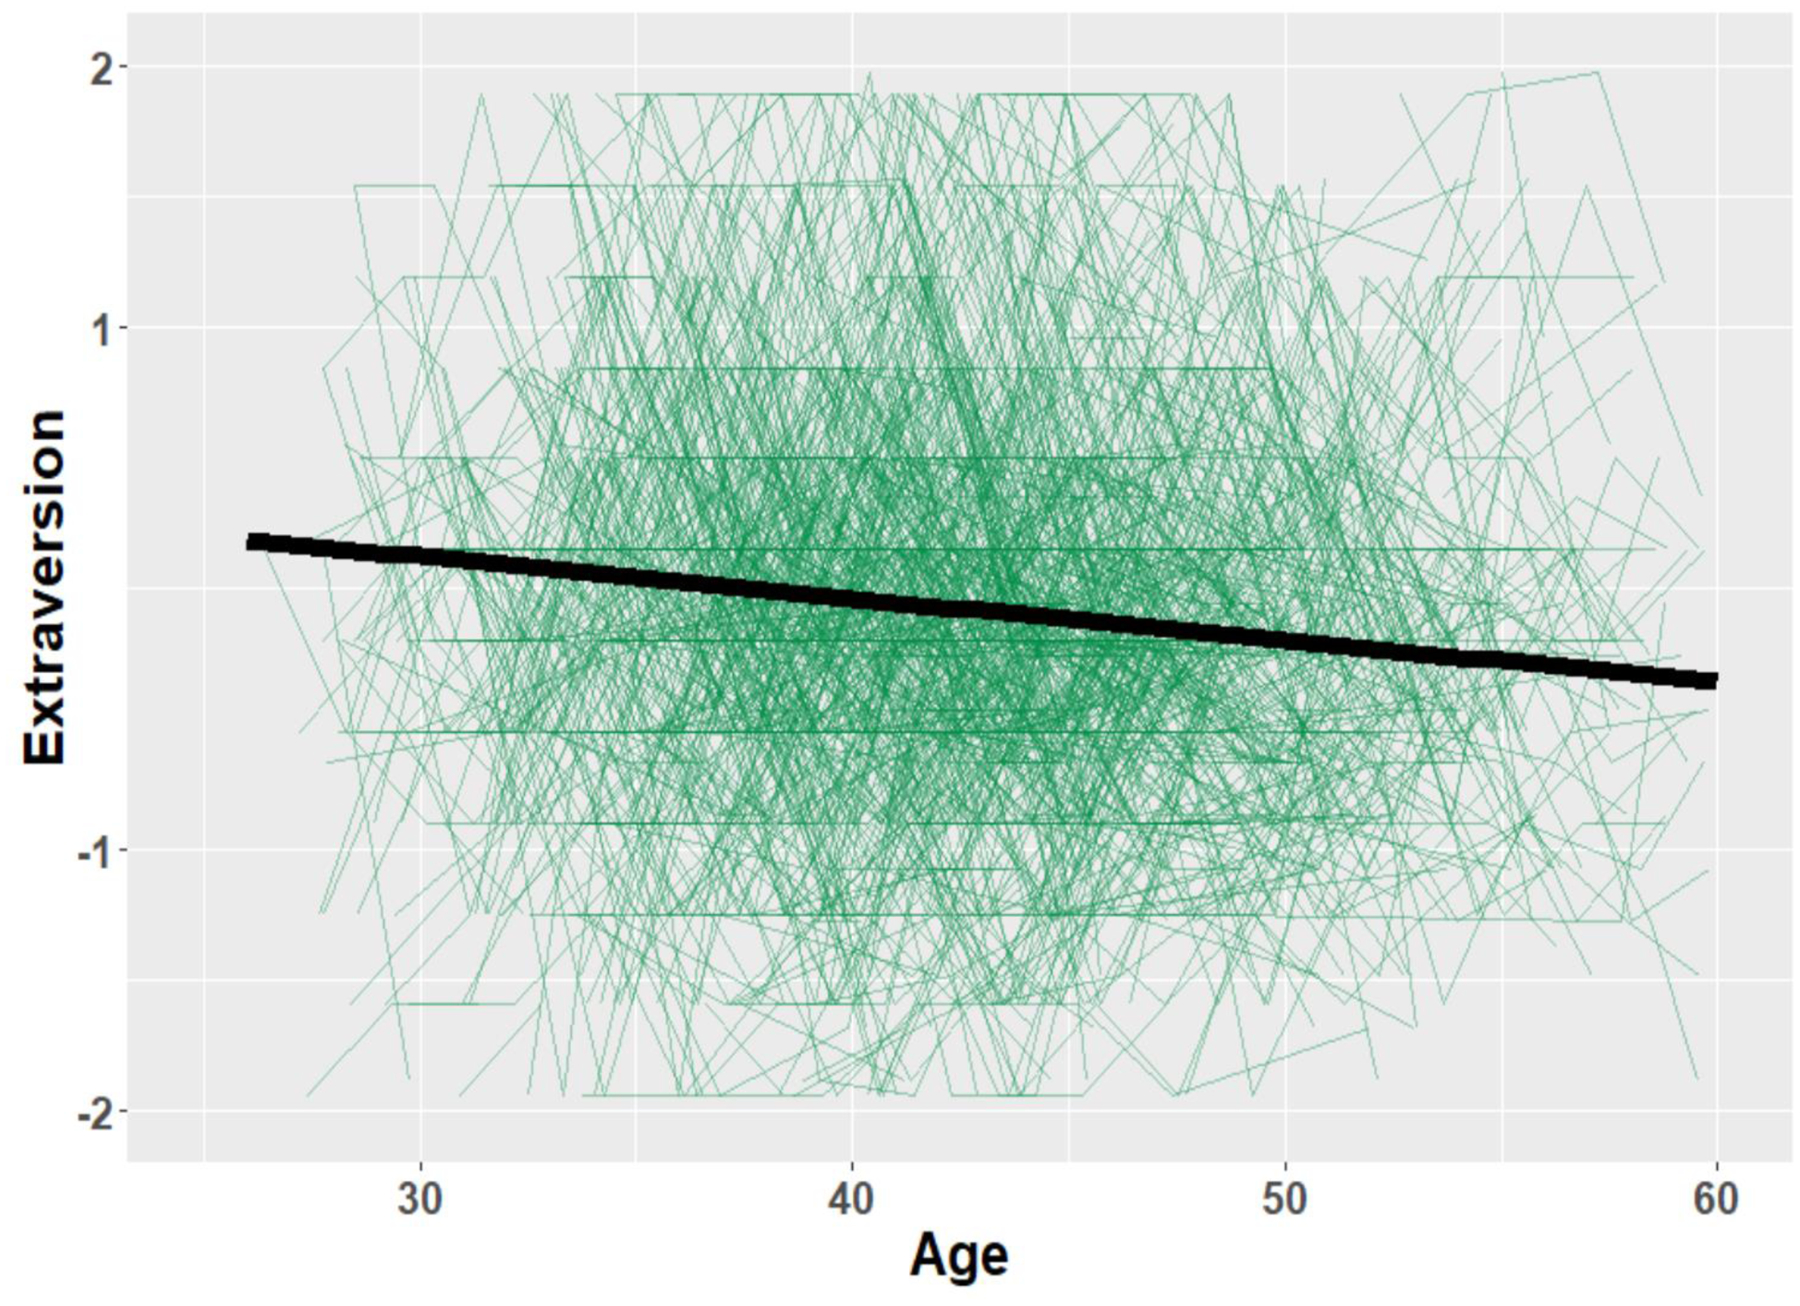
Note. Black solid line represents the mean-level trajectory of the sample. Colored lines (or gray lines in print version) represent each participant’s trajectory.
Figure 5. Mean-level change in Openness to Experience across adulthood.
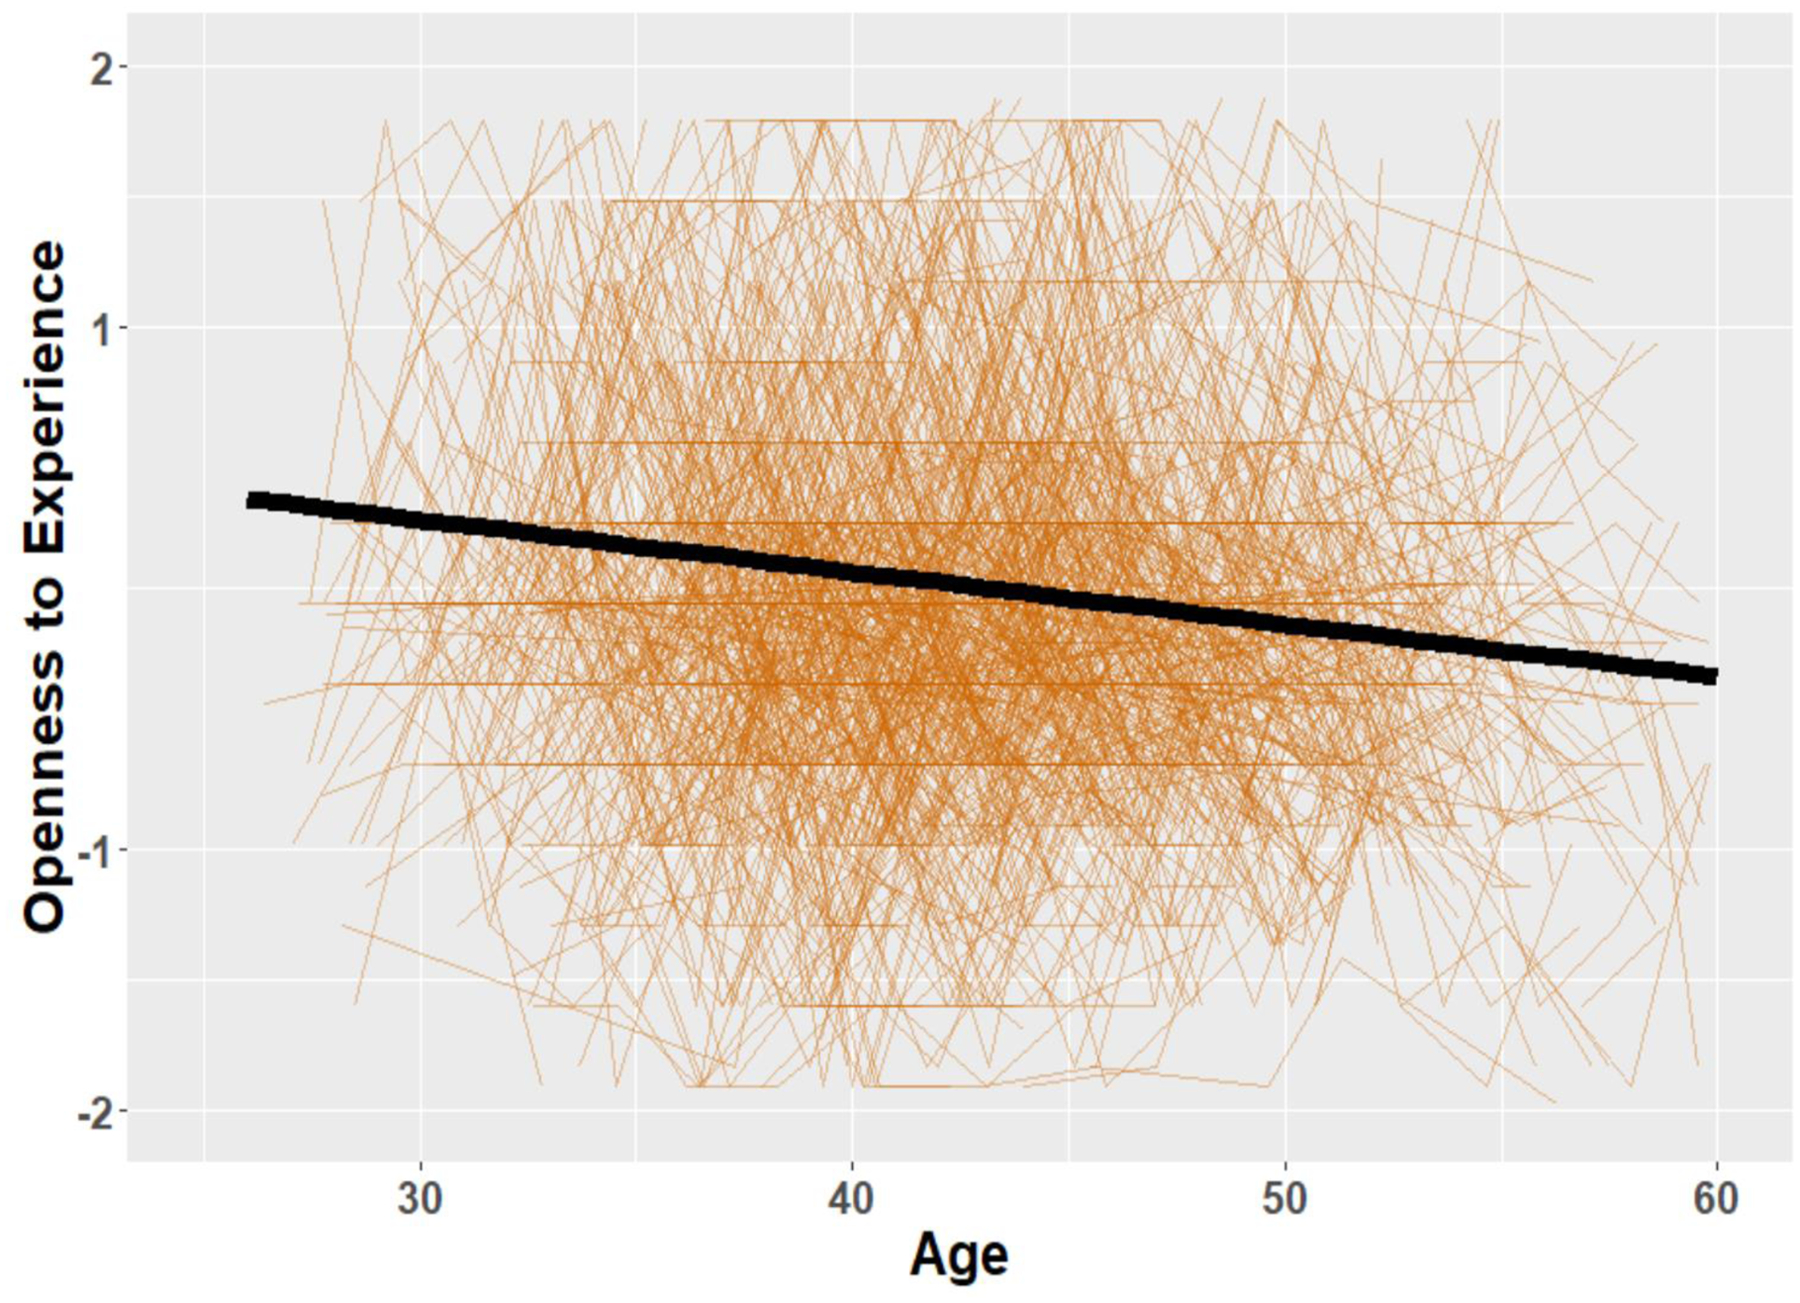
Note. Black solid line represents the mean-level trajectory of the sample. Colored lines (or gray lines in print version) represent each participant’s trajectory.
As noted above, we found strong/partial strong measurement invariance for all Big Five domains, which suggests that we measured the same constructs over time. Nonetheless, to alleviate concerns that the switch from the BFI to the BFI-2 might account for the observed mean-level trends, we replicated our continuous-age latent growth curve models using only the 32 items that are on both the BFI and the BFI-2. These follow-up analyses led us to draw the same conclusions about the linear trends for all of the Big Five domains based on AIC and BIC. Moreover, the means of the slope factors were the same in terms of magnitude and statistical significance (see Table S6) compared to the LGC models with the full set of BFI/BFI-2 items, with the exception of Openness to Experience which showed no statistically significant mean-level change or variability in change with the reduced subset of items. Thus, the observed mean-level trajectories largely seem to reflect actual age changes, rather than the switch from the BFI to the BFI-2.
Big Five Trajectories as a Function of Cultural and Socio-Demographic Factors
For the dichotomous predictors (sex, generational status, and language preference), we conducted multiple group models of the univariate latent growth trajectories for the Big Five domains. Table S7 shows model comparisons from when we constrain versus free the means and variances of the intercepts and slopes across groups. For all model comparisons, there were few differences in AIC and BIC for the constrained versus freely estimated multiple group models. There were multiple cases where either the AIC or BIC was lower in the freely estimated model when compared to the constrained model, but there were only three models (i.e., sex differences in Neuroticism and Openness, and language differences in Openness) where both AIC and BIC were lower in the freely estimated model compared to the constrained model. Taken together, these findings suggest that, for all of the Big Five domains, there were little-to-no differences in the mean-level trajectories for females and males, 1st vs. 2nd+ generation immigrants, or those who were interviewed in English versus Spanish. The exceptions were that women started out at a higher level of Neuroticism in young adulthood and showed greater declines in Neuroticism across adulthood compared to men (see Figure S5); men and women started out at the same level of Openness in young adulthood, but then women showed more rapid declines across adulthood compared to men (see Figure S6); and predominantly Spanish-speakers declined in Openness across adulthood whereas predominantly English-speakers increased in Openness across adulthood (see Figure S7).
For age at immigration, Mexican cultural values, American cultural values, and ethnic discrimination, we entered each as a time-invariant predictor of the Big Five trajectories. Table 3 shows the unstandardized beta coefficients for the association between these cultural predictors and the levels and slopes of each Big Five trajectory. Out of 56 effects, eight effects were statistically significant at p ≤ .001. Individuals who had more personal experiences with ethnic discrimination tended to be higher in Neuroticism, and individuals who endorsed more American cultural values tended to be higher in Openness. Mexican cultural values were also associated with initial levels and changes in Extraversion, Agreeableness, and Openness. Individuals who endorsed more Mexican cultural values tended to be higher in Extraversion, Agreeableness, and Openness. Further, compared to individuals who endorsed fewer Mexican cultural values, individuals who endorsed more Mexican cultural values tended to show higher initial levels of, and greater declines in, Extraversion, Agreeableness, and Openness over time (see Figures S8–S10).
Table 3.
Conditional Latent Growth Curve Models with Age at Immigration, Cultural Values, and Ethnic Discrimination as Predictors
| Age at Immigration | ||
|---|---|---|
| X→Intercept | X→Linear Slope | |
| B (SE) | B (SE) | |
| Extraversion | .01 (.01) | −.001 (.00) |
| Agreeableness | −.01 (.01) | .00 (.00) |
| Conscientiousness | −.01 (.01) | .00 (.00) |
| Neuroticism | .02 (.01) | .00 (.00) |
| Openness | .01 (.01) | −.001 (.00) |
| Mexican Cultural Values | ||
| X→Intercept | X→Linear Slope | |
| Extraversion | .64* (.17) | −.03* (.01) |
| Agreeableness | .77* (.15) | −.03* (.01) |
| Conscientiousness | .36 (.17) | −.01 (.01) |
| Neuroticism | −.21 (.17) | .02 (.01) |
| Openness | .73* (.16) | −.03* (.01) |
| American Cultural Values | ||
| X→Intercept | X→Linear Slope | |
| Extraversion | .21 (.11) | −.01 (.01) |
| Agreeableness | −.03 (.12) | −.01 (.01) |
| Conscientiousness | −.05 (.12) | .00 (.01) |
| Neuroticism | .04 (.12) | .002 (.01) |
| Openness | .39* (.12) | −.02 (.01) |
| Personal Experiences with Ethnic Discrimination | ||
| X→Intercept | X→Linear Slope | |
| Extraversion | .03 (.15) | −.01 (.01) |
| Agreeableness | .00 (.13) | −.01 (.01) |
| Conscientiousness | .10 (.15) | −.01 (.01) |
| Neuroticism | .55* (.16) | −.01 (.01) |
| Openness | .30 (.14) | −.02 (.01) |
Note. B = unstandardized beta coefficients. SE = Standard error. Values are unstandardized beta coefficients based on z-scored Big Five scores (using Wave 1 means and standard deviations).
p ≤ .001.
For education level, verbal IQ, and fluid IQ, we entered each as a time-invariant predictor of the Big Five trajectories (in separate models). Table 4 shows the unstandardized beta coefficients for the association between education level, verbal IQ, and fluid IQ, and the level and slope(s) of each univariate trajectory. Out of 42 effects, only two were statistically significant at p ≤ .001. Education level was a significant predictor of the initial levels of Conscientiousness and Neuroticism, such that individuals who had higher education levels had higher Conscientiousness scores and lower Neuroticism scores in young adulthood.
Table 4.
Conditional Latent Growth Curve Models with Education Level and IQ as Predictors
| Education Level | ||
|---|---|---|
| X→Intercept | X→Linear Slope | |
| B (SE) | B (SE) | |
| Extraversion | −.001 (.01) | .001 (.001) |
| Agreeableness | .01 (.01) | .001 (.001) |
| Conscientiousness | .08* (.02) | −.002 (.001) |
| Neuroticism | −.05* (.02) | .001 (.001) |
| Openness | .03 (.02) | .00 (.001) |
| Verbal IQ | ||
| X→Intercept | X→Linear Slope | |
| Extraversion | .003 (.01) | .00 (.00) |
| Agreeableness | −.001 (.01) | .001 (.00) |
| Conscientiousness | .02 (.01) | .00 (.00) |
| Neuroticism | −.02 (.007) | .00 (.00) |
| Openness | .02 (.01) | .00 (.00) |
| Fluid IQ | ||
| X→Intercept | X→Linear Slope | |
| Extraversion | .002 (.004) | .00 (.00) |
| Agreeableness | .00 (.004) | .00 (.00) |
| Conscientiousness | .01 (.01) | .00 (.00) |
| Neuroticism | −.004 (.01) | .00 (.00) |
| Openness | .001 (.01) | .00 (.00) |
Note. B = unstandardized beta coefficients. SE = Standard error. Values are unstandardized beta coefficients based on z-scored Big Five scores (using Wave 1 means and standard deviations).
p ≤ .001.
The Role of Acquiescence on Big Five Trajectories
Table 1 also shows the descriptive statistics (Ns, means, standard deviations) for individual differences in acquiescence at each wave. Acquiescence scores showed small declines across waves and were correlated between .27 and .48 at adjacent waves, suggesting that individual differences in acquiescent responding were moderately consistent over time and on average, acquiescent responding showed small declines over time (see Figure S11).
Table 5 shows the unstandardized beta coefficients of the role of acquiescence on occasion-specific personality scores in the LGC models. These findings show that all of the Big Five domains were consistently associated with acquiescent responding across the study period, such that individuals who had higher acquiescence scores tended to score significantly higher on Extraversion, Agreeableness, Conscientiousness, Neuroticism, and Openness at all Waves (with the exception of Conscientiousness at Waves 1, 10, and 11). The role of acquiescence on occasion-specific personality scores was largest for Openness to Experience and smallest for Conscientiousness.
Table 5.
Associations between Acquiescent Responding and LGC Occasion-Specific Personality Scores
| Wave 1 | Wave 3 | Wave 5 | Wave 7 | Wave 10 | Wave 11 | |
|---|---|---|---|---|---|---|
| ACQ→B5 | ACQ→B5 | ACQ→B5 | ACQ→B5 | ACQ→B5 | ACQ→B5 | |
| Extraversion | .53* | .53* | .50* | .53* | .44* | .45* |
| Agreeableness | .31* | .38* | .38* | .29* | .28* | .29* |
| Conscientiousness | .18 | .22* | .23* | .24* | .18 | .17 |
| Neuroticism | .68* | .67* | .66* | .64* | .61* | .64* |
| Openness | 1.38* | 1.44* | 1.43* | 1.47* | 1.36* | 1.30* |
Note. Values in the table are unstandardized beta coefficients based on z-scored Big Five scores (using Wave 1 means and standard deviations). ACQ = acquiescence score. B5 = Big Five score.
p ≤ .001.
Additionally, with these models, we were able to examine the extent to which the means of the slope factors remained statistically significant while including the time-varying acquiescence variables in the model. When these acquiescence covariates were included in the model, the means of the slope factors became non-significant for all of the Big Five domains (see Figures S12–S16 for how the mean-level trajectories change when acquiescence is in included in the models).
Discussion
Personality development is a vibrant area of research, yet conclusions about patterns of stability and change in personality across the life course rest primarily on research involving highly-educated White Americans or Western Europeans. The generalizability of personality development trends to other populations is not well established due to the dearth of prospective longitudinal data on ethnic minority populations. In the present pre-registered study, we aimed to fill this gap by using data from a longitudinal study of 1,110 Mexican-origin adults who completed a well-validated personality measure up to 6 times over a 12-year period. Through this work, we were able to address fundamental questions about stability and change in the Big Five across adulthood, as well as investigate how these trends vary as a function of cultural and sociodemographic factors. Several noteworthy results emerged.
Stability and Change in the Big Five across Adulthood
As in previous research on rank-order stability, we found that individuals generally maintained their rank ordering on the Big Five across adulthood (2- and 3-year test-retest rs = .49 to .62; rs =.66–.80, corrected for measurement error), suggesting that if an individual tends to be higher on a trait (relative to others) in young adulthood, they also tend to be higher on that trait (relative to others) in middle adulthood. These rank-order stability coefficients are higher than what was found in previous work with a Black/African-American sample (Lockenhoff et al., 2008) and comparable to previous meta-analytic work showing that the average one-year test-retest correlation was estimated to be .55 (not corrected for measurement error; Roberts & DelVecchio, 2000).
With regard to profile stability, we found that individuals generally maintained their within-person configurations of Big Five trait scores across adulthood (rs=.58–.66), with .58 and .57 for 4- and 6-year stabilities, respectively. These profile stability coefficients are similar to, but slightly lower than, previous research that found an average profile stability of .61 across 4 years (Robins et al., 2001) and .63 across 6 years (Terracciano et al., 2010).
Last, we partially replicated previous work on mean-level changes in personality. Contrary to some prior work that has shown mean-level increases in Agreeableness, Conscientiousness, Emotional Stability and little to no mean-level changes or declines in Extraversion or Openness (Costa et al., 2019; Roberts et al., 2006; Wortman et al., 2012), we found that there were mean-level declines in all Big Five domains across adulthood in the present sample. These decreasing patterns more closely replicate recent work on the development of the Big Five in 16 longitudinal samples from five countries, which shows declines in the majority of the Big Five from middle adulthood into old age (e.g., Graham et al., 2020).
In terms of generalizability, it seems as though there are at least some common developmental processes that universally affect individuals regardless of the sociocultural group to which they belong, given the commonalities in the directions of Big Five change in the present sample and some prior work (e.g., Graham et al., 2020). These commonalities are likely due to both intrinsic maturational factors and environmental mechanisms that affect all individuals, regardless of their socio-cultural background. For example, it is possible that accelerated aging is at play, where Mexican-origin individuals perceive themselves to be older than they are, maybe due to adopting social roles sooner or for objectively faster biological aging due to the burden of fewer economic resources, poor work conditions, and frequent experiences with discrimination. Subjective perceptions of age have been shown to contribute to earlier maturity in the Big Five (Stephan et al., 2013), suggesting that there may be psychological and/or biological aging processes that underlie personality development trends across adulthood. Specifically for Mexican-origin individuals, it is possible that we find less evidence for personality maturity in the present study because our assessments generally begin later in adulthood at approximately age 30, which may be missing gains in personality maturity due to accelerated aging or intrinsic factors that have already occurred prior to age 30. It will be critical for future research to collect data earlier in adulthood (and even in late adolescence) to examine directly whether accelerated aging is at play.
Likewise, universally-experienced environmental contexts may lead to common personality changes with age. Although more work is needed, our results are not necessarily inconsistent with Social Investment Theory. The personality assessments in the present study began at age 26 and continued to approximately age 75, with most observations occurring between 30 and 60 years old. Given that Mexican-origin individuals tend to transition into the work force and family life earlier in adulthood than do adults from other cultural and socioeconomic groups (e.g., Bleidorn et al., 2013; but see McCrae et al., 2021; Terracciano, 2014), it is possible that the participants in the present study experienced personality maturity prior to the age at which our assessments of the Big Five started (i.e., before age 30). Thus, these “universal” social roles could be operating on personality changes earlier in development, but future work will need to collect longitudinal personality data on younger Mexican-origin individuals to confirm this explanation. Further, these results highlight the growing need to consider the “universal” environmental experiences that might lead to population-level declines in personality maturity from middle adulthood to late life, as well as the need to better understand how intrinsic and environmental forces interact to shape personality development (e.g., Tropf et al., 2017).
Last, it would be beneficial for future researchers to consider patterns of stability and change in Big Five facets and nuances (i.e., individual questionnaire items). It is possible that there are divergent patterns of stability and change among smaller units of personality that are masked at the broad domain level. These follow-up analyses would likely have important implications for our general understanding of the explanatory mechanisms underlying stability and change in personality across the lifespan (e.g., Mõttus et al., 2019; Mõttus et al., 2020).
Associations among Cultural Factors and Big Five Development
In addition to comparing the generalizability of the present results to prior research, we were also able to examine cultural factors as predictors of within-group variability in Big Five development. Generally, there were no differences in the mean-level trajectories for individuals who were interviewed in English versus Spanish and 1st vs. 2nd+ generation immigrants, with the exception of the language differences in Openness change. Individuals who were predominantly Spanish-speakers showed linear declines in Openness across adulthood, whereas individuals who were predominantly English-speakers showed linear increases in Openness across adulthood. Of the remaining cultural factors (i.e., age at immigration, Mexican cultural values, American cultural values, personal experiences with discrimination), we found several statistically significant results, most of which were concurrent associations with initial trait levels. Not surprisingly, individuals who had more personal experiences of ethnic discrimination tended to be more anxious and depressed. Individuals who endorsed more American cultural values tended to be higher in Openness. Last, individuals who endorsed more Mexican cultural values showed higher initials levels of, and greater declines in, Extraversion, Agreeableness, and Openness.
There are two main takeaways from these findings. First, given the large number of tests, there were relatively few associations between cultural factors and personality development across adulthood in this sample, which may or may not be surprising. On the one hand, this is surprising because we might expect that, for example, being an immigrant and experiencing ethnic discrimination would shape personality development in important ways. On the other hand, the lack of cultural effects may not be surprising because, similar to the weathering hypothesis (Geronimus, 1992), the difficulties of being an immigrant and experiencing ethnic discrimination impact virtually all of the individuals in the present sample, leaving less room for these factors to account for within-group variability in personality maturation. More generally, it is worth noting that these are the kinds of compelling observations we can make by studying personality development in ethnic minority populations, which would not be possible if we did not study these populations or focused on between-group comparisons. Future work should explore the weathering hypothesis as it applies to personality development trends among ethnic minority samples in order to empirically explore these issues.
Second, of the statistically significant results, the associations between cultural values and Extraversion, Agreeableness, and Openness are consistent with recent work showing that motivational units, such as values and life goals, are systematically related to personality traits (e.g., Atherton et al., 2020). Many Mexican cultural values revolve around the importance of social connections, fostering harmonious relationships especially in the family, and respect toward others, all of which are related to consistent patterns of thinking, feeling, and behaving in an extraverted and agreeable way. Further, consistent with what has previously been shown, Openness often has the largest number of associations with life goals (e.g., Atherton et al., 2020) and values (e.g., Parks-Leduc et al., 2015), which was partially evident with the positive associations between Openness and the endorsement of both Mexican and American cultural values. Finally, similar to prior work on the association between motivational units and personality change (e.g., Atherton et al., 2020), higher levels of Mexican cultural values were related to greater declines in Extraversion, Agreeableness, and Openness, suggesting that: (a) endorsing Mexican cultural values may become more normative and stable with age, thus rendering traits like Extraversion, Agreeableness, and Openness as less important for maintaining those broader values or (b) these individuals simply had more room to decline because they had higher scores initially.
Associations among Socio-Demographic Factors and Big Five Development
In terms of socio-demographic factors, we found that mean-level changes in the Big Five generally did not vary as a function of sex, with the exception of Neuroticism and Openness. Women start out at a higher level of Neuroticism in young adulthood and show greater declines in Neuroticism across adulthood compared to men, which is consistent with some previous work (e.g., Graham et al., 2020). Men and women start out at comparable levels of Openness in young adulthood, but women show more rapid declines across adulthood compared to men. Further, Big Five development was largely unaffected by education level, verbal IQ, and fluid IQ. Out of 42 effects, only two were statistically significant and both were concurrent associations. Individuals who had higher education levels were less neurotic and more conscientious. Thus, mean-level changes in the Big Five across adulthood seem to generalize across several socio-demographic indicators, though more work is needed in this area.
Regarding acquiescence bias, we found that acquiescent responding was consistently and positively associated with occasion-specific Big Five personality scores, with the largest associations between acquiescence and Openness and the smallest associations between acquiescence and Conscientiousness. Additionally, we found that the mean-level change trajectories became non-significant when including acquiescence scores into the model. There are three main issues to consider when interpreting these findings. First, the prevalence of acquiescence is unlikely to be unique to our sample, although acquiescence bias tends to be more pronounced among individuals with less formal education and lower literacy (Costello & Roodenburg, 2015; Sutin et al., 2013). The vast majority of participants in the present sample are first-generation immigrants to the United States who have less formal education than the typical samples studied in personality development research. Thus, it will be pertinent for future research to examine whether the present findings generalize to samples with higher literacy levels. Second, the acquiescence measures include true score variance, methodological artifact variance, and common variance among the Big Five traits, which leaves very little variance leftover for growth in the Big Five trait after accounting for these components. Moreover, this is the first attempt to integrate acquiescence into longitudinal models of personality change and thus, it is important to remain cautious when interpreting these findings. Last, to the extent that we can interpret these findings, the most straightforward interpretation is that acquiescence is positively associated with the Big Five so when it declines over time, it “pulls down” all of the Big Five scores with it. It also seems to be the case that the effects of acquiescence on Big Five scores get weaker over the study period, and therefore, it is possible that as participants gain more familiarity with interview protocols, they acquiesce less on these items and get closer to their “true score” over time.
Limitations
The present research has several limitations. First, we used self-report measures of the Big Five, and thus, the present results may not hold for other methods of personality assessment. Second, the participants in the present study were married to each other. Although we corrected for this dependency in the data by using the CLUSTER function in Mplus, it is possible that there is more homogeneity in personality trajectories in the present study because partnered individuals are presumably experiencing many of the same environments and events within their households that could lead to personality change. Third, we did not observe an ideal amount of variability in some of our cultural and socio-demographic predictors; the vast majority of participants were Spanish-speaking (83%), first-generation immigrants (86%), and had less than a high school diploma or equivalent (66%). This lack of variability truncates the predictive validity that these factors might otherwise have on Big Five development in a more heterogeneous sample. Fourth, we conducted a large number of statistical tests, and specifically with respect to the associations among the sociodemographic and cultural predictors of the Big Five trajectories, approximately 10% (10 out of 98) were statistically significant at p ≤ .001. Although we adjusted the p-level to correct for multiple testing, it is still important to interpret the present results with caution until replications are conducted. Last, although we had 109 data points for individuals younger than 30, and 97 data points for individuals older than 60, these are relatively few compared to the data points available in middle adulthood (e.g., from age 30 to 60 we have 5,286 data points). Consequently, we have more statistical power and smaller confidence intervals for our latent growth curve models in mid-adulthood compared to young adulthood and old age. This goes hand-in-hand with our observation that, despite the quadratic personality change models fitting worse than the linear personality change models, the means of the linear slopes switch directions (from negative to positive) and the means of the quadratic slopes were statistically significant in the quadratic personality change models, suggesting we may lack the data points at younger and older ages to be able to detect non-linear changes in the Big Five in the present study. Future work should aim to improve upon the limitations of the present study when studying how personality develops in ethnic minority adults.
Conclusions
Taken together, the present study makes an important contribution to our understanding of Big Five personality development across adulthood by highlighting the extent to which, and in which ways, personality development findings generalize beyond the thin slice of the world’s population comprised of middle-class, highly educated White American or Western European individuals. We also see the present study as an opportune time to initiate a call for action. If psychologists truly want to understand how personality develops in humans, then it is critical to gather prospective, longitudinal data from participants who are diverse in terms of race/ethnicity and socioeconomic status, as well as gender identity, sexual orientation, nationality, religious affiliation, and so on. Identifying both generalizable and unique patterns of personality development across sociocultural groups will not only improve our understanding of the human experience, but also inform prevention and intervention efforts aimed at improving the health and well-being of individuals across the globe.
Supplementary Material
Figure 2. Mean-level change in Agreeableness across adulthood.
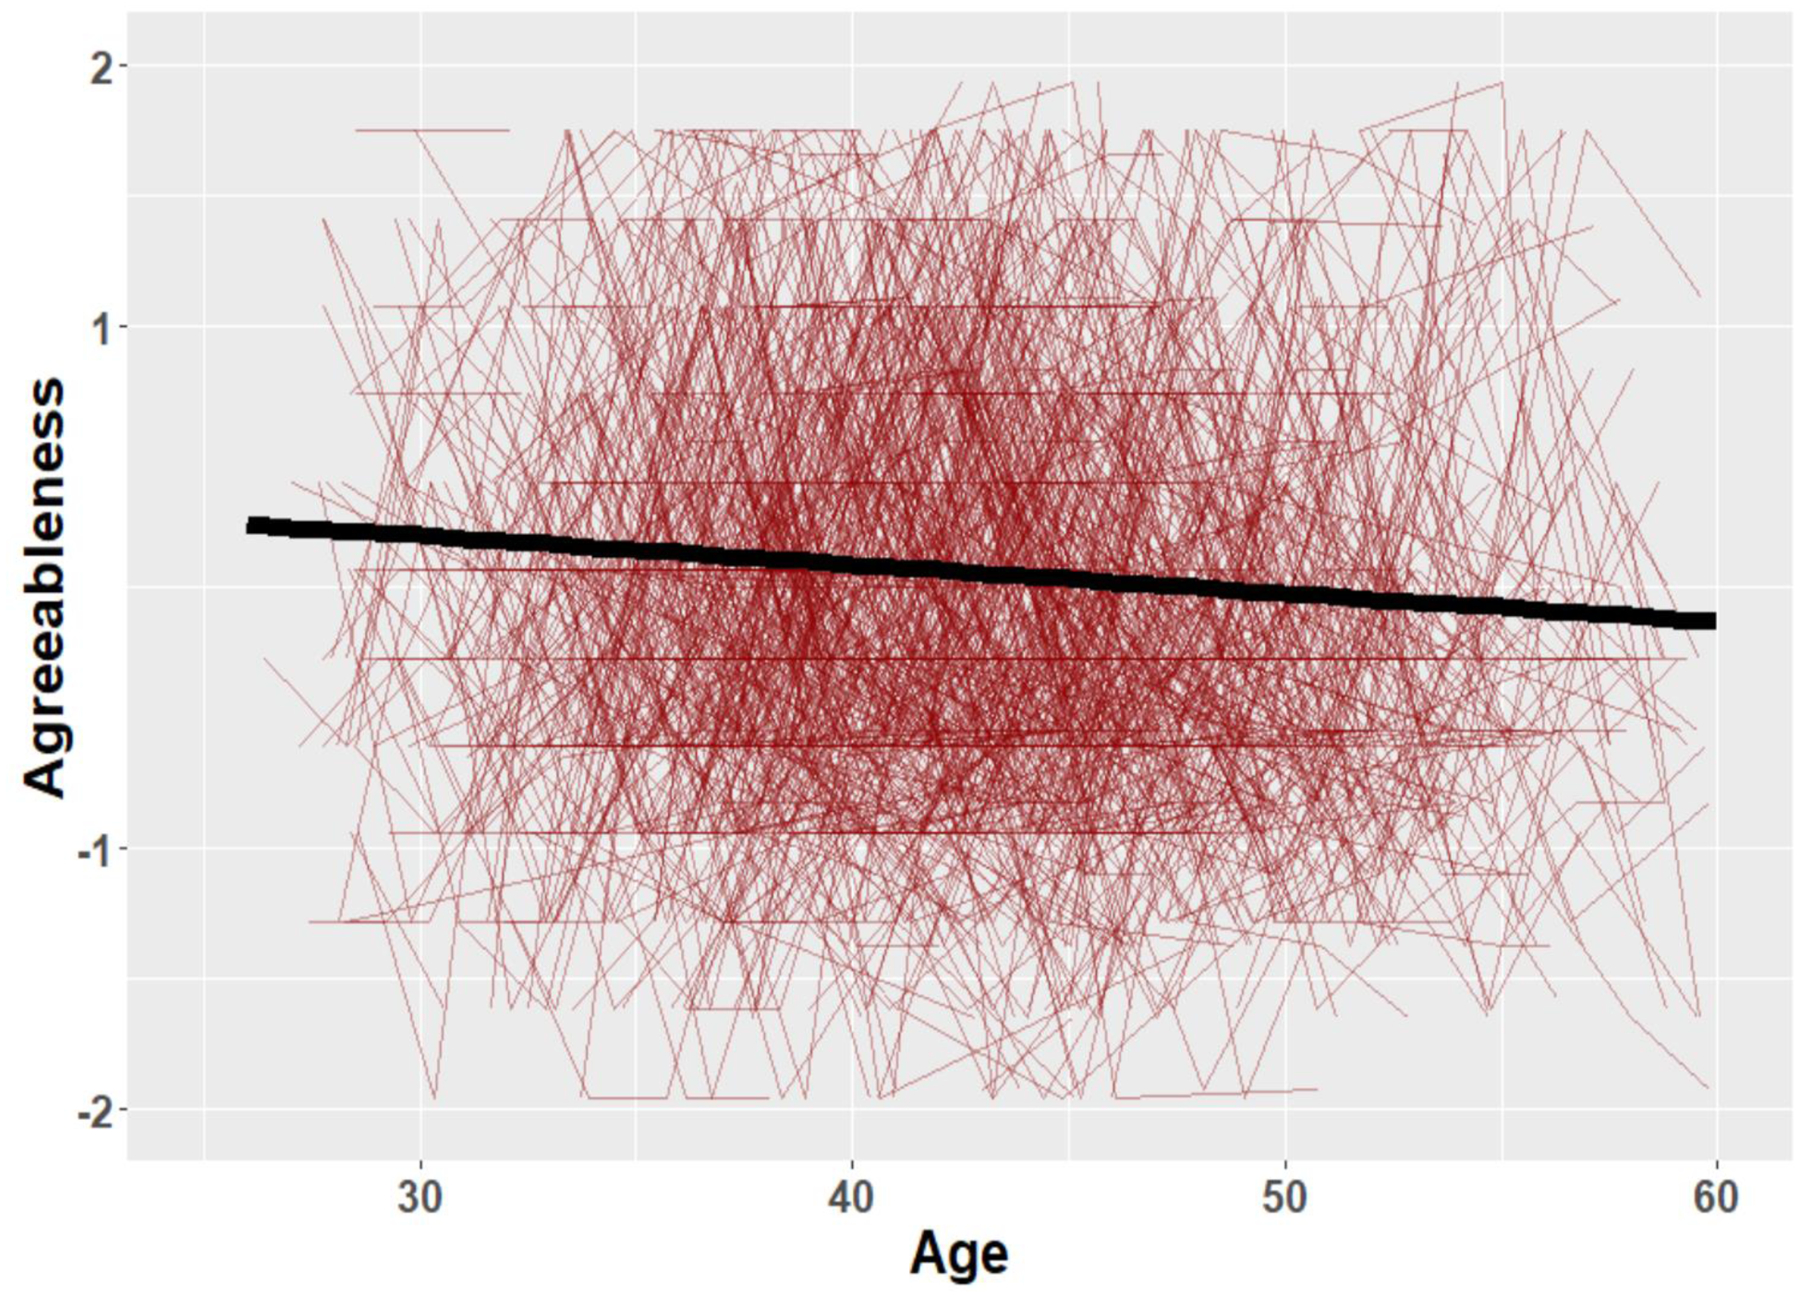
Note. Black solid line represents the mean-level trajectory of the sample. Colored lines (or gray lines in print version) represent each participant’s trajectory.
Figure 3. Mean-level change in Conscientiousness across adulthood.
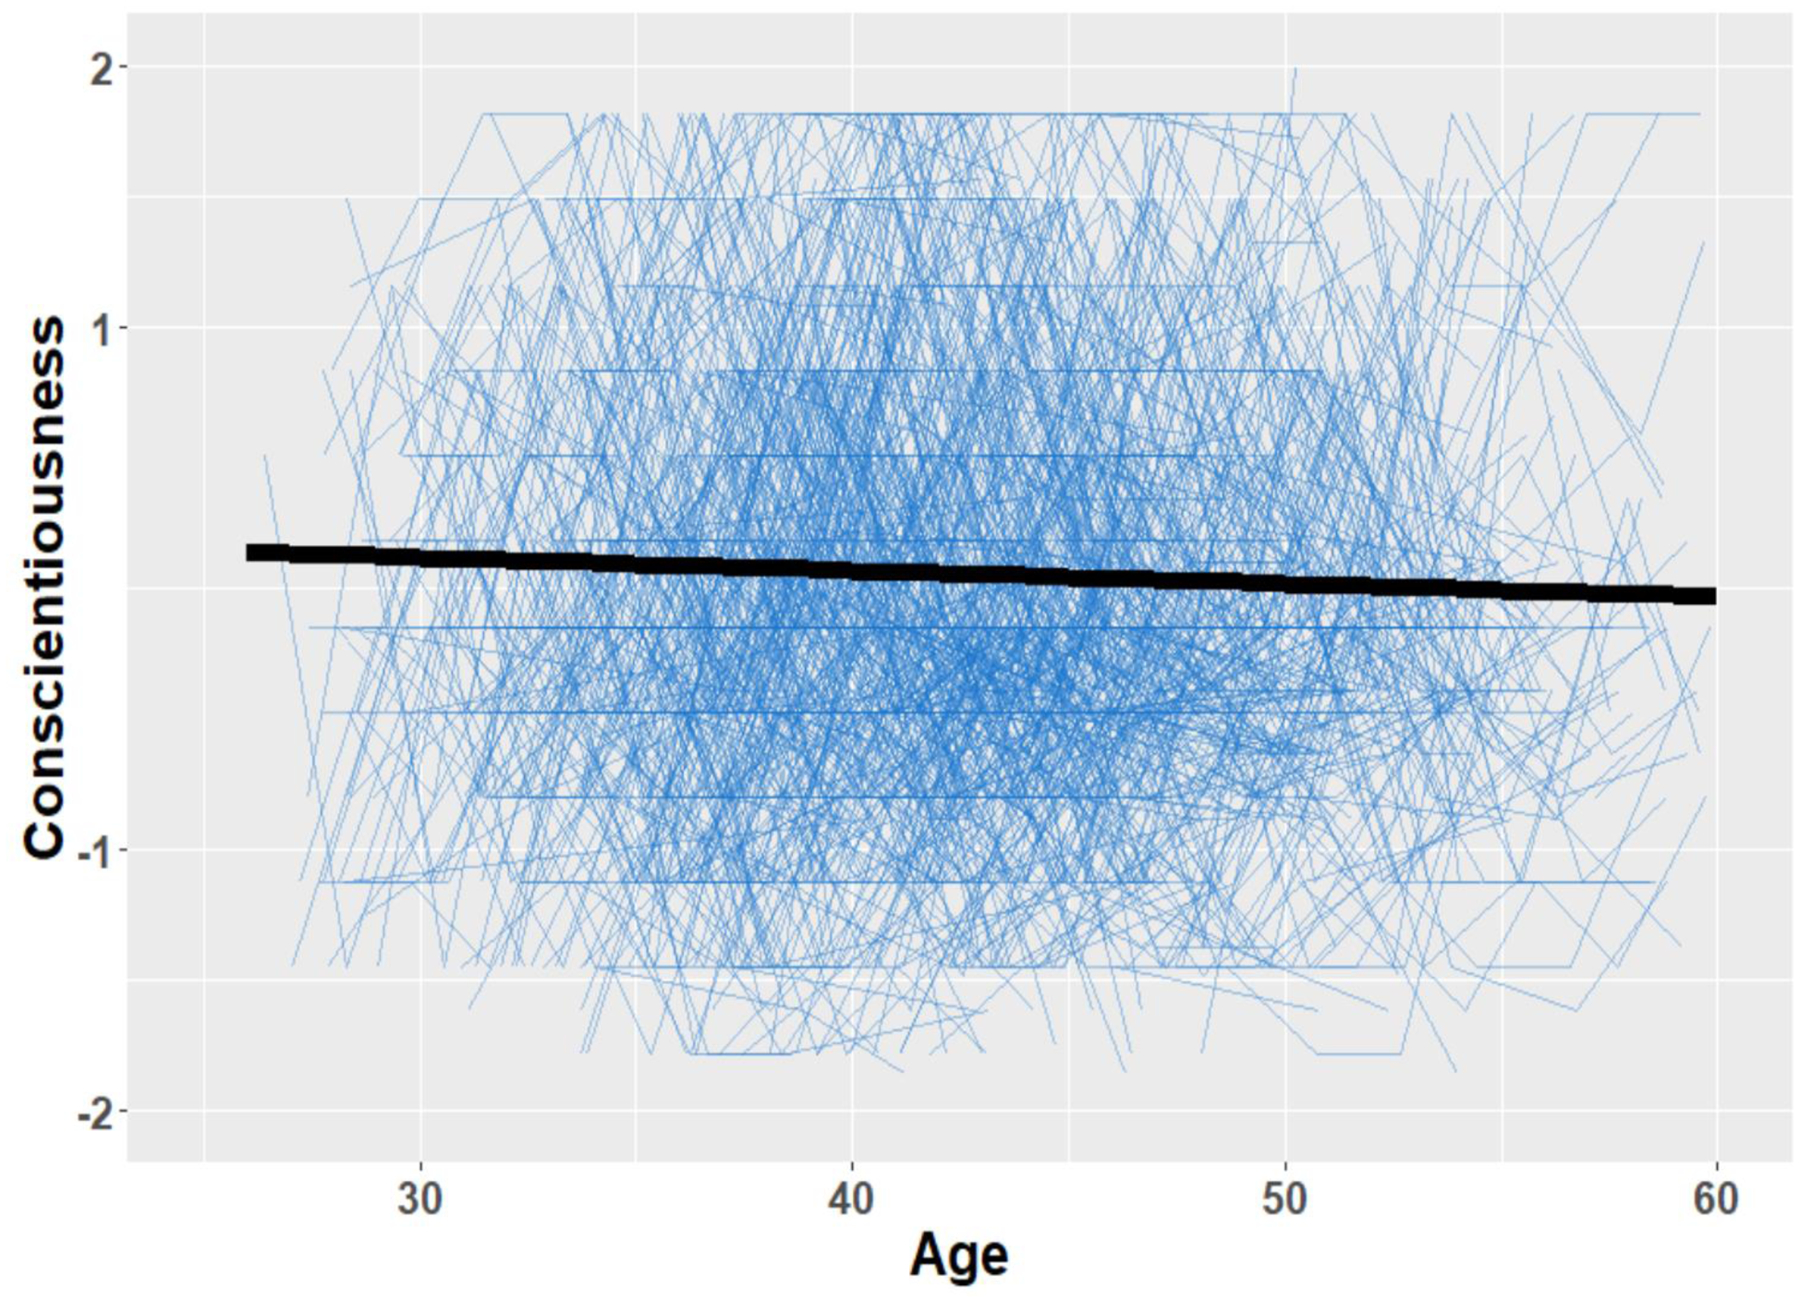
Note. Black solid line represents the mean-level trajectory of the sample. Colored lines (or gray lines in print version) represent each participant’s trajectory.
Figure 4. Mean-level change in Neuroticism across adulthood.
Note. Black solid line represents the mean-level trajectory of the sample. Colored lines (or gray lines in print version) represent each participant’s trajectory.
Acknowledgments
This research was supported by a grant from the National Institute on Aging to Angelina R. Sutin and Richard W. Robins (U01AG060164), and by grants from the National Institute on Drug Abuse and the National Institute on Alcohol Abuse and Alcoholism (DA017902) to Richard W. Robins. The first author (OEA) conducted the work on this study while at the University of California Davis, but her present affiliation is Northwestern University. The pre-registration, list of deviations from the pre-registration, study materials, analytic syntax, and output can be found here: https://osf.io/2gpm9/.
Footnotes
Two papers have used the parent BFI data from the California Families Project (Clark et al., 2018; Weidmann et al., 2018), but neither examined stability and change in, or predictors of, the Big Five across adulthood. For a full list of California Families Project publications, see: https://www.californiafamiliesproject.org/publications.html.
The sample size at Wave 1 is 1,110. However, in subsequent waves, new parental figures (e.g., step-parents) were sometimes included in the study when the biological parent was not available due to divorce, separation, death, and other factors; in addition, some biological fathers did not participate at Wave 1, but agreed to participate at later waves. Consequently, the Wave 1 sample size does not represent the total number of parents who participated across all waves
The California Families Project participants have not given informed consent to have their personal data publicly shared, and we do not have IRB approval to post data publicly. Therefore, we are legally and ethically not allowed to publicly post participants’ data. Data are only available from the authors by request. Interested readers can contact the corresponding author to request access to a limited dataset to reproduce analyses.
In a small number of cases (n = 34), the mother was unable to participate at Wave 10 so we allowed the father to participate instead.
Group sizes for people younger than 30 and older than 60 were too small to get reliable test-retest correlations.
If interested in computing how much change occurs as a function of different age units (e.g., scaling age by decade rather than year), it is possible to plug in the age unit of interest into the following equation: Y[t]n = y0n + Age[t]*ysn, where y0n is equal to the mean of intercept plus the error of the intercept and ysn is equal to the mean of the slope plus the error of the slope.
It is worth noting that in the quadratic models the linear and quadratic effects were significant for all of the Big Five domains except Neuroticism, suggesting that there was some evidence for non-linear patterns of change. However, given that the AIC and BIC values dramatically increased for the quadratic change models, we have less certainty that the quadratic function is the best representation of the data. See Figures S1–S4 to view how the quadratic functions fit to these data for all Big Five domains (except Neuroticism).
References
- Allison PD (2003). Missing data techniques for structural equation modeling. Journal of Abnormal Psychology, 112(4), 545–557. DOI: 10.1037/0021-843X.112.4.545. [DOI] [PubMed] [Google Scholar]
- Arnett JJ (2008). The neglected 95%: why American psychology needs to become less American. American Psychologist, 63(7), 602–614. [DOI] [PubMed] [Google Scholar]
- Atherton OE, Grijalva E, Roberts BW, & Robins RW (2020). Stability and change in personality traits and major life goals from college to midlife. Personality and Social Psychology Bulletin. [DOI] [PubMed] [Google Scholar]
- Bartels M, van Weegen FI, van Beijsterveldt CE, Carlier M, Polderman TJ, Hoekstra RA, & Boomsma DI (2012). The five factor model of personality and intelligence: A twin study on the relationship between the two constructs. Personality and Individual Differences, 53(4), 368–373. [Google Scholar]
- Benet-Martinez V, & John O (1998). Los Cinco Grandes across cultures and ethnic groups: Multitrait multimethod analyses of the Big Five in Spanish and English. Journal of Personality and Social Psychology, 75, 729–750. [DOI] [PubMed] [Google Scholar]
- Bleidorn W, Klimstra TA, Denissen JJ, Rentfrow PJ, Potter J, & Gosling SD (2013). Personality maturation around the world: A cross-cultural examination of social- investment theory. Psychological Science, 24(12), 2530–2540. [DOI] [PubMed] [Google Scholar]
- Briley DA, & Tucker-Drob EM (2014). Genetic and environmental continuity in personality development: A meta-analysis. Psychological Bulletin, 140(5), 1303. [DOI] [PMC free article] [PubMed] [Google Scholar]
- Causadias JM, & Umaña-Taylor AJ (2018). Reframing marginalization and youth development: Introduction to the special issue. American Psychologist, 73(6), 707. [DOI] [PubMed] [Google Scholar]
- Chan W, McCrae RR, De Fruyt F, Jussim L, Löckenhoff CE, De Bolle M, … & Terracciano A (2012). Stereotypes of age differences in personality traits: Universal and accurate? Journal of Personality and Social Psychology, 103(6), 1050–1066. [DOI] [PMC free article] [PubMed] [Google Scholar]
- Cheung GW & Rensvold RB (2002). Evaluating goodness-of-fit indexes for testing measurement invariance. Structural Equation Modeling, 9(2), 233–255. DOI: 10.1207/S15328007SEM0902_5. [DOI] [Google Scholar]
- Chopik WJ, & Kitayama S (2018). Personality change across the life span: Insights from a cross-cultural, longitudinal study. Journal of Personality, 86(3), 508–521. [DOI] [PMC free article] [PubMed] [Google Scholar]
- Clark DA, Donnellan MB, & Robins RW (2018). Personality traits and parent-adolescent interactions: An observational study of Mexican-origin families. Journal of Family Psychology, 32, 544–551. [DOI] [PMC free article] [PubMed] [Google Scholar]
- Coll CG, Crnic K, Lamberty G, Wasik BH, Jenkins R, Garcia HV, & McAdoo HP (1996). An integrative model for the study of developmental competencies in minority children. Child Development, 67(5), 1891–1914. [PubMed] [Google Scholar]
- Costa PT Jr, McCrae RR, & Löckenhoff CE (2019). Personality across the life span. Annual Review of Psychology, 70, 423–448. [DOI] [PubMed] [Google Scholar]
- Costa PT Jr, Terracciano A, & McCrae RR (2001). Gender differences in personality traits across cultures: Robust and surprising findings. Journal of Personality and Social Psychology, 81(2), 322. [DOI] [PubMed] [Google Scholar]
- Costello S, & Roodenburg J (2015). Acquiescence Response Bias—Yeasaying and Higher Education. Australian Educational & Developmental Psychologist, 32(2). [Google Scholar]
- Damian RI, Spengler M, Sutu A, & Roberts BW (2018). Sixteen going on sixty-six: A longitudinal study of personality stability and change across 50 years. Journal of Personality and Social Psychology. [DOI] [PubMed] [Google Scholar]
- De Bolle M, De Fruyt F, McCrae RR, Löckenhoff CE, Costa PT Jr, Aguilar-Vafaie ME, … & Terracciano A (2015). The emergence of sex differences in personality traits in early adolescence: A cross-sectional, cross-cultural study. Journal of Personality and Social Psychology, 108(1), 171–185. [DOI] [PMC free article] [PubMed] [Google Scholar]
- Geronimus AT (1992). The weathering hypothesis and the health of African-American women and infants: Evidence and speculations. Ethnicity and Disease, 2(3), 207–221. [PubMed] [Google Scholar]
- Graham EK, Weston SJ, Gerstorf D, Yoneda TB, Booth T, Beam CR, … & Estabrook R (2020). Trajectories of Big Five personality traits: A coordinated analysis of 16 longitudinal samples. European Journal of Personality. [DOI] [PMC free article] [PubMed] [Google Scholar]
- Gutiérrez RA (2019). Mexican immigration to the United States. In Oxford Research Encyclopedia of American History. [Google Scholar]
- Heise DR (1969). Separating reliability and stability in test-retest correlation. American Sociological Review, 93–101. [Google Scholar]
- Hu L & Bentler PM (1998). Fit indices in covariance structure modeling: Sensitivity to underparameterized model misspecification. Psychological Methods, 3(4), 424–453. 10.1037/1082-989X.3.4.424. [DOI] [Google Scholar]
- Hu L & Bentler PM (1999). Cutoff criteria for fit indexes in covariance structure analysis: Conventional criteria versus new alternatives. Structural Equation Modeling, 6(1), 1–55. DOI: 10.1080/10705519909540118. [DOI] [Google Scholar]
- Hughes D, & Dodge MA (1997). African American women in the workplace: Relationships between job conditions, racial bias at work, and perceived job quality. American Journal of Community Psychology, 25, 581–599. [DOI] [PubMed] [Google Scholar]
- Iida M (2015). Dyadic analysis. In Whitbourne SK (Ed.), The Encyclopedia of Adulthood and Aging, Volume 1. UK: John Wiley and Sons, Inc. [Google Scholar]
- James K, Lovato C, & Cropanzano R (1994). Correlational and known-group comparison validation of a workplace prejudice/discrimination inventory. Journal of Applied Social Psychology, 24, 1573–1592. [Google Scholar]
- John OP, & Soto CJ (in press). History, measurement, and conceptual elaboration of the Big-Five trait taxonomy: The paradigm matures. In John OP, & Robins RW (Eds.), Handbook of Personality: Theory and Research, 4th ed. New York: The Guilford Press. [Google Scholar]
- Kenny DA, Kashy DA, & Cook WL (2006). Dyadic analysis. New York: Guilford. [Google Scholar]
- Kishton JM, & Widaman KF (1994). Unidimensional versus domain representative parceling of questionnaire items: An empirical example. Educational and Psychological Measurement, 54(3), 757–765. [Google Scholar]
- Knight GP, Gonzales NA, Saenz DS, Bonds DD, German M, Deardorff J, … Updegraff KA (2010). The Mexican American Cultural Values Scale for adolescents and adults. The Journal of Early Adolescence, 30, 444–481. doi: 10.1177/0272431609338178 [DOI] [PMC free article] [PubMed] [Google Scholar]
- Laajaj R, Macours K, Hernandez DAP, Arias O, Gosling SD, Potter J, … & Vakis R (2019). Challenges to capture the Big Five personality traits in non-WEIRD populations. Science Advances, 5(7), eaaw5226. [DOI] [PMC free article] [PubMed] [Google Scholar]
- Little TD, Cunningham WA, & Shahar G (2002). To parcel or not to parcel: Exploring the question, weighing the merits. Structural Equation Modeling, 9(2), 151–173. DOI: 10.1207/S15328007SEM0902_1. [DOI] [Google Scholar]
- Little TD, Rhemtulla M, Gibson K, & Schoemann AM (2013). Why the items versus parcels controversy needn’t be one. Psychological Methods, 18(3), 285–300. [DOI] [PMC free article] [PubMed] [Google Scholar]
- Löckenhoff CE, Terracciano A, Bienvenu OJ, Patriciu NS, Nestadt G, McCrae RR, … & Costa PT Jr (2008). Ethnicity, education, and the temporal stability of personality traits in the East Baltimore Epidemiologic Catchment Area study. Journal of Research in Personality, 42(3), 577–598. [DOI] [PMC free article] [PubMed] [Google Scholar]
- McCrae RR (2008). A note on some measures of profile agreement. Journal of Personality Assessment, 90(2), 105–109. [DOI] [PMC free article] [PubMed] [Google Scholar]
- McCrae RR, Costa PT, de Lima MP, Simões A, Ostendorf F, Angleitner A, … & Piedmont RL (1999). Age differences in personality across the adult life span: parallels in five cultures. Developmental Psychology, 35(2), 466–477. [DOI] [PubMed] [Google Scholar]
- McCrae RR, De Bolle M, Löckenhoff CE, & Terracciano A (2021). Lifespan trait development: Toward an adequate theory of personality. In Rauthmann JF (Ed.), Handbook of Personality Dynamics and Processes, 1st ed., p. 621–641, London: Academic Press. [Google Scholar]
- McCrae RR, Terracciano A, & 78 members of the Personality Profiles of Cultures Project (2005). Universal features of personality traits from the observer’s perspective: data from 50 cultures. Journal of Personality and Social Psychology, 88(3), 547–561. [DOI] [PubMed] [Google Scholar]
- Meade AW, Johnson EC & Braddy PW (2008). Power and sensitivity of alternative fit indices in tests of measurement invariance. Journal of Applied Psychology, 93(3), 568–592. doi: 10.1037/0021-9010.93.3.568. [DOI] [PubMed] [Google Scholar]
- Mõttus R, Sinick J, Terracciano A, Hřebíčková M, Kandler C, Ando J, … & Jang KL (2019). Personality characteristics below facets: A replication and meta-analysis of cross- rater agreement, rank-order stability, heritability, and utility of personality nuances. Journal of Personality and Social Psychology, 117(4), e35–e50. [DOI] [PMC free article] [PubMed] [Google Scholar]
- Mõttus R, Wood D, Condon DM, Back MD, Baumert A, Costantini G, … & Zimmermann J (2020). Descriptive, predictive and explanatory personality research: Different goals, different approaches, but a shared need to move beyond the Big Few traits. European Journal of Personality, 34(6), 1175–1201. [Google Scholar]
- Muthén LK, & Muthén BO (1998–2011). Mplus User’s Guide. Sixth Edition. Los Angeles, CA: Muthén & Muthén. [Google Scholar]
- Osmon DC, Santos O, Kazakov D, Kassel MT, Mano QR, & Morth A (2018). Big Five personality relationships with general intelligence and specific Cattell-Horn-Carroll factors of intelligence. Personality and Individual Differences, 131, 51–56. [Google Scholar]
- Parks-Leduc L, Feldman G, & Bardi A (2015). Personality traits and personal values: A meta-analysis. Personality and Social Psychology Review, 19(1), 3–29. [DOI] [PubMed] [Google Scholar]
- Rad MS, Martingano AJ, & Ginges J (2018). Toward a psychology of Homo sapiens: Making psychological science more representative of the human population. Proceedings of the National Academy of Sciences, 115(45), 11401–11405. [DOI] [PMC free article] [PubMed] [Google Scholar]
- Rammstedt B, Danner D, & Martin S (2016). The association between personality and cognitive ability: Going beyond simple effects. Journal of Research in Personality, 62, 39–44. [Google Scholar]
- Rammstedt B, Lechner CM, & Danner D (2018). Relationships between personality and cognitive ability: A facet-level analysis. Journal of Intelligence, 6(2), 28. [DOI] [PMC free article] [PubMed] [Google Scholar]
- Roberts BW & DelVecchio WF (2000). The rank-order consistency of personality traits from childhood to old age: a quantitative review of longitudinal studies. Psychological Bulletin, 126(1), 3–25. [DOI] [PubMed] [Google Scholar]
- Roberts BW, Walton KE, & Viechtbauer W (2006). Patterns of mean-level change in personality traits across the life course: a meta-analysis of longitudinal studies. Psychological Bulletin, 132(1), 1–25. [DOI] [PubMed] [Google Scholar]
- Roberts BW, & Wood D (2006). Personality development in the context of the neo- socioanalytic model of personality. In Mroczek DK & Little TD (Eds.), Handbook of personality development (pp. 11–39). Mahwah, NJ, US: Lawrence Erlbaum Associates Publishers. [Google Scholar]
- Robins RW, Fraley RC, Roberts BW, & Trzesniewski KH (2001). A longitudinal study of personality change in young adulthood. Journal of Personality, 69(4), 617–640. [DOI] [PubMed] [Google Scholar]
- Schafer JL & Graham JW (2002). Missing data: Our view of the state of the art. Psychological Methods, 7(2), 147–77. DOI: 10.1037//1082-989X.7.2.147. [DOI] [PubMed] [Google Scholar]
- Soto CJ, John OP, Gosling SD, & Potter J (2008). The developmental psychometrics of big five self-reports: Acquiescence, factor structure, coherence, and differentiation from ages 10 to 20. Journal of Personality and Social Psychology, 94(4), 718–737. [DOI] [PubMed] [Google Scholar]
- Soto CJ, John OP, Gosling SD, & Potter J (2011). Age differences in personality traits from 10 to 65: Big-Five domains and facets in a large cross-sectional sample. Journal of Personality and Social Psychology, 330–348. [DOI] [PubMed] [Google Scholar]
- Soto CJ, & John OP (2016). The next Big Five Inventory (BFI-2): Developing and assessing a hierarchical model with 15 facets to enhance bandwidth, fidelity, and predictive power. Journal of Personality and Social Psychology. [DOI] [PubMed] [Google Scholar]
- Stephan Y, Sutin AR, & Terracciano A (2015). Subjective age and personality development: A 10-year study. Journal of Personality, 83(2), 142–154. [DOI] [PubMed] [Google Scholar]
- Sterba SK, & MacCallum RC (2010). Variability in parameter estimates and model fit across repeated allocations of items to parcels. Multivariate Behavioral Research, 45(2), 322–358. [DOI] [PubMed] [Google Scholar]
- Sutin AR, Costa PT Jr, Evans MK, & Zonderman AB (2013). Personality assessment in a diverse urban sample. Psychological Assessment, 25(3), 1007. [DOI] [PMC free article] [PubMed] [Google Scholar]
- Sutin AR, Luchetti M, Stephan Y, Robins RW, & Terracciano A (2017). Parental educational attainment and adult offspring personality: An intergenerational life span approach to the origin of adult personality traits. Journal of Personality and Social Psychology, 113(1), 144. [DOI] [PMC free article] [PubMed] [Google Scholar]
- Sutin AR, Terracciano A, Kitner-Triolo MH, Uda M, Schlessinger D, & Zonderman AB (2011). Personality traits prospectively predict verbal fluency in a lifespan sample. Psychology and Aging, 26(4), 994–999. [DOI] [PMC free article] [PubMed] [Google Scholar]
- Terracciano A (2014). Pregnancy, marriage, and quitting school nurture personality development? Commentary on Bleidorn, Klimstra, Denissen, Rentfrow, Potter, and Gosling (2013). Psychological Science, 25(4), 1049–1050. [DOI] [PubMed] [Google Scholar]
- Terracciano A (2015). Cross-cultural studies of personality development. The Encyclopedia of Adulthood and Aging, 1–5. [Google Scholar]
- Terracciano A, McCrae RR, & Costa PT Jr (2010). Intra-individual change in personality stability and age. Journal of Research in Personality, 44(1), 31–37. [DOI] [PMC free article] [PubMed] [Google Scholar]
- Tropf FC, Lee SH, Verweij RM, Stulp G, Van Der Most PJ, De Vlaming R, … & Mills MC (2017). Hidden heritability due to heterogeneity across seven populations. Nature Human Behavior, 1(10), 757–765. [DOI] [PMC free article] [PubMed] [Google Scholar]
- Von Stumm S, Chamorro-Premuzic T, Quiroga MA, & Colom R (2009). Separating narrow and general variances in intelligence-personality associations. Personality and Individual Differences, 47(4), 336–341. [Google Scholar]
- Walton KE, Huyen BTT, Thorpe K, Doherty ER, Juarez B, D’Accordo C, & Reina MT (2013). Cross-sectional personality differences from age 16–90 in a Vietnamese sample. Journal of Research in Personality, 47(1), 36–40. [Google Scholar]
- Whitfield KE, & Baker-Thomas T (1999). Individual differences in aging minorities. The International Journal of Aging and Human Development, 48(1), 73–79. [DOI] [PubMed] [Google Scholar]
- Weidmann R, Ledermann T, Robins RW, Gomez V, & Grob A (2018). The reciprocal link between the Big Five traits and self-esteem: Longitudinal associations within and between parents and their offspring. Journal of Research in Personality, 74, 166–181. [Google Scholar]
- Wetzel E, Lüdtke O, Zettler I, & Böhnke JR (2016). The stability of extreme response style and acquiescence over 8 years. Assessment, 23(3), 279–291. [DOI] [PubMed] [Google Scholar]
- Woodcock RW, McGrew KS, & Mather N (2001). Woodcock-Johnson III Test. Riverside Publishing Company. Itasca, IL. [Google Scholar]
- Wortman J, Lucas RE, & Donnellan MB (2012). Stability and change in the Big Five personality domains: Evidence from a longitudinal study of Australians. Psychology and Aging, 27, 867–87. [DOI] [PubMed] [Google Scholar]
Associated Data
This section collects any data citations, data availability statements, or supplementary materials included in this article.