

Abstract
BACKGROUND:
Social isolation is a risk factor for morbidity and mortality comparable to well-established risk factors including smoking, hypertension, and a sedentary lifestyle. The specific biological mechanisms that connect social isolation to morbidity and mortality remain unclear. Interleukin-6 (IL-6) and C-reactive protein (CRP) are biological markers that are upregulated during inflammation and can have long-term negative consequences for the health of individuals as they age.
METHODS:
Utilizing Round 7 (2017) data from the National Health and Aging Trends Study (NHATS), we examine the relationship between social isolation and two biological markers: IL-6 and high-sensitivity CRP. This study included a nationally representative sample of 4648 Medicare beneficiaries 65 years and older who provided samples using dried blood spot (DBS) techniques. We defined social isolation utilizing a multi-domained typology that considers living arrangement, core discussion network, religious attendance, and social participation. IL-6 and CRP were obtained via DBS that were collected in Round 7 of the NHATS. We performed linear regression to examine the association between social isolation and biological markers IL-6 and CRP.
RESULTS:
After adjusting for age, gender, race/ethnicity, income, tobacco use, body mass index, and chronic conditions, we found that severe social isolation and social isolation were significantly associated with higher levels of IL-6 and CRP values among older adults.
CONCLUSIONS:
Social isolation is associated with higher levels of biological markers (IL-6 and CRP). Our findings inform the pathway between social isolation and morbidity and mortality among older adults. IL-6 or CRP could be a proximal outcome measures for future clinical and social interventions that seek to alter the trajectory of social isolation and its associated health outcomes.
Keywords: Biological markers, Interleukin-6 (IL-6), C-reactive protein (CRP)
INTRODUCTION
Social isolation is the objective lack of (or limited) social contact with others1 and is a “chronically stressful condition” that speeds up the aging process.2 Nearly 1 in 4 adults over the age of 65 are considered to be socially isolated.1,3 Social isolation is a risk factor for morbidity and mortality comparable to well-established risk factors including smoking 15 cigarettes a day, hypertension, and a sedentary lifestyle.1 While the impacts of social isolation on health are well-documented, the mechanisms responsible for this association are complex and have yet to be fully delineated. Researchers have proposed a variety of direct and indirect pathways that include behavioral, psychological, and biological pathways that link social isolation to negative health outcomes (Figure 1).1,4,5 One potential biological pathway is that socially isolated individuals develop unhealthy behaviors, such as poor diets, excessive drinking habits, and decreased physical activity, all of which can contribute to adverse health outcomes via inflammatory processes.6 Psychological pathways suggest that social isolation itself acts as an emotional or social stressor that may trigger an inflammatory cascade of events.7 Another theory links social isolation and inflammation response via an evolutionary mechanism, suggesting that due to an increased likelihood for socially isolated organisms to get attacked or injured, pre-formed inflammatory molecules could generate a faster and more efficient biological response to such threats.8 Inflammatory processes, when chronic, have the potential to threaten the long-term health of individuals as they age.9,10 Elevated IL-6 and CRP has been associated with many adverse health outcomes, such as elevated risk of cardiovascular events, poor prognosis of chronic renal disease, lower physical performance, decreased cognitive performance, and higher risk of all-cause mortality.11,12 Further clarifying the relationship between social isolation and biological markers that are apart of the inflammatory process is an important step in understanding the pathways between social isolation the morbidity and mortality observed in numerous epidemiological studies.13,14
Figure 1:
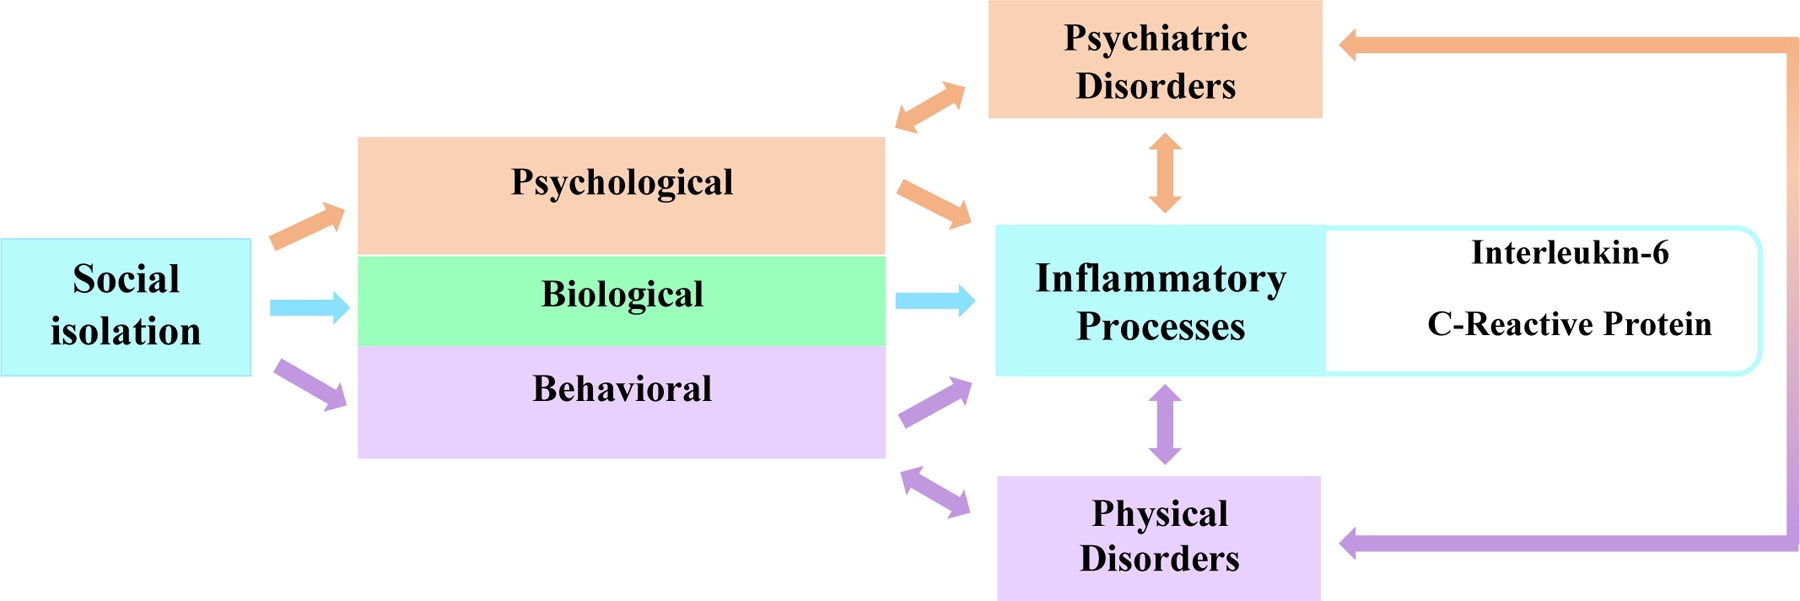
POSSIBLE DIRECT AND INDIRECT PATHWAYS BY WHICH SOCIAL ISOLATION INFLUENCES INFLAMMATORY PROCESSES
Prior studies that have examined the association between social isolation and biological markers have yielded inconclusive results. These studies have investigated the relationship between social isolation and interleukin-6 (IL-6), C-reactive protein (CRP), fibrinogen, and albumin.15,16 The authors of a recent systematic review and meta-analysis conclude that further research is needed to explicate and confirm the relationship between social isolation and inflammation.4 In light of this, we sought to clarify prior findings by examining the relationship between social isolation, cytokine IL-6, and acute phase reactant high-sensitivity CRP in a nationally representative sample of Medicare beneficiaries aged 65 years or older living in the contiguous United States.
METHODS
Subjects and Study Design
The National Health and Aging Trends Study (NHATS) is a representative cohort of Medicare beneficiaries aged 65 years and older. NHATS oversampled individuals who self‐report as black non‐Hispanic and in the oldest age groups (≥90 years). Data are collected during a 2‐hour in‐person interview by a trained interviewer. More detailed information about study design and data collection tools can be found at https://www.nhats.org.17
Study Sample
We used data from Round 7, conducted in 2017, which included 6312 participants (response rate 93.0%). Sample persons who did not complete study interviews (n=287) and who had proxy respondents for the last month of life interview (n=459) were ineligible for participation because the dried blood spot (DBS) collection required a self-report consent. Among the 5566 eligible participants, 663 were not consented and 255 consented but were excluded due to lack of biological marker assay results, leaving 4648 participants in the analytic sample.
Data Measures
Our independent variable is an objective indicator of social connection.3 This multi-domain typology was informed by the Berkman-Syme Social Network Index and was utilized in NHATS to assess social isolation among study participants.18,19 In Round 7, participants received l point for each of the following: living with at least one other person, talking to two or more people about “important matters” in the past year, attending religious services in the past month, and participating in other activities (clubs, meetings, group activities, or doing volunteer work) in the past month. Participants with a sum score of 0 were classified as severely social isolated, those with a sum score of 1 were classified as socially isolated, and those with sum scores of 2 or more as not socially isolated.
Dependent variables are IL-6 and high-sensitivity CRP. These biological markers were obtained via DBS that were collected in Round 7 of the NHATS. IL-6 and CRP measurements were obtained via sandwich enzyme-linked immunosorbent assay. To allow comparison of the assay results with other published values, the actual plasma concentration measurements of IL-6 and CRP were converted to plasma-equivalent concentrations determined by comparing the analyte concentrations in the plasma samples with the measures in the DBS samples.20
Baseline sociodemographic factors included in the analysis were age, race and ethnicity (white, black, Hispanic, other), gender (female/male), and total household income. In addition, Round 7 body mass index (BMI), current smoking status, the number of chronic conditions (diabetes, myocardial infarction, heart disease, hypertension, arthritis, osteoporosis, lung disease, stroke, and cancer), depressive symptoms (PHQ-2), frailty21 and probable dementia22 were examined.17
Statistical Analysis
Descriptive statistics were used to characterize the study sample by social isolation subgroup. Weighted percentages for categorical variables and means with standard error for continuous variables were reported. Multinomial logistic regressions were used to assess the association between demographics characteristics and social isolation groups. For regression analyses, plasma equivalent values of the DBS assay measures were subjected to a natural log transformation. Extreme outliers were identified using Tukey’s outer fences method.23 There were no extreme outliers detected for CRP. For IL-6, less than 1.9% (78 out of 4178 plasma equivalent values) were detected as extreme outliers and these extreme outliers were excluded from the analysis.
The associations between social isolation and IL-6/CRP measurements were individually examined with multivariable linear regression models. A sequential predictor procedure was applied and three models were investigated: Model 1, unadjusted; Model 2, adjusted for sociodemographic factors including age, gender, race/ethnicity, and income; and Model 3, adjusted for sociodemographic factors in Model 2 as well smoking status, BMI, co-morbidities, depressive symptoms, frailty and dementia classification. All analyses accounted for the complex survey design of NHATS. P values less than 0.05 were considered statistically significant. All analyses were performed with SAS v.9.4 (SAS Institute Inc., Cary, NC, USA).
RESULTS
The demographic and health characteristics of the 4648 older adults for the total sample and by social isolation category are shown in Table 1. The average participant was 76.0 years, and 55.4% of the participants were female. About 4% of participants were severely socially isolated and another 17% were in the socially isolated group. We found a statistically significant difference between social connection groups due to age, gender (p<0.001), income (p<0.001), smoking history (p<0.001), chronic conditions, frailty (p<0.001), and dementia (p<0.001). However, no statistically significant difference was found between social connection groups due to race/ethnicity or BMI.
Table 1.
DEMOGRAPHICS AND HEALTH CHARACTERISTICS BY SOCIAL ISOLATION OF NATIONAL HEALTH AND AGING TRENDS STUDY PARTICIPANTS WHO HAD BIOLOGICAL MARKERS IL-6 AND CRP MEASURED IN 2017
| Participant Characteristics | Total (n=4648) | No Social Isolation (79.3%) | Social Isolation (17.1%) | Severe Social Isolation (3.6%) | p-value |
|---|---|---|---|---|---|
| Age, mean (SE) | 76.0 (0.10) | 75.8 (0.12) | 76.6 (0.25) | 76.9 (0.57) | 0.003 |
| Age category, % | 0.004 | ||||
| 65–69 | 16.1 | 80.2 | 17.0 | 2.8 | |
| 70–74 | 35.6 | 81.8 | 15.1 | 3.1 | |
| 75–79 | 21.0 | 78.1 | 17.3 | 4.6 | |
| 80–84 | 14.4 | 77.6 | 19.1 | 3.3 | |
| 85–89 | 8.2 | 77.2 | 18.8 | 4.0 | |
| 90+ | 4.8 | 72.0 | 22.9 | 5.1 | |
| Gender, % | <0.001 | ||||
| Female | 55.4 | 82.5 | 14.2 | 3.4 | |
| Male | 44.6 | 75.4 | 20.8 | 3.8 | |
| Race/Ethnicity, % | 0.082 | ||||
| Non-Hispanic white | 81.4 | 79.9 | 16.8 | 3.2 | |
| Non-Hispanic black | 7.8 | 80.9 | 14.5 | 4.6 | |
| Hispanic | 7.2 | 75.4 | 19.0 | 5.6 | |
| Other | 3.6 | 73.5 | 20.2 | 6.3 | |
| Income, % | <0.001 | ||||
| <$15000 | 14.0 | 64.2 | 26.5 | 9.3 | |
| $15000-$29999 | 20.3 | 72.0 | 21.4 | 6.7 | |
| $30000-$60000 | 28.0 | 80.1 | 17.8 | 2.1 | |
| >=$60000 | 37.8 | 88.3 | 10.9 | 0.9 | |
| Ever smoked, % | 6.4 | 59.0 | 29.7 | 11.4 | <0.001 |
| BMI, mean (SE) | 28.3 (0.11) | 28.3 (0.13) | 28.2 (0.23) | 27.6 (0.61) | 0.544 |
| No. of Chronic Conditions, % a | 0.020 | ||||
| 0–1 | 27.4 | 83.1 | 14.4 | 2.5 | |
| 2–3 | 51.0 | 78.6 | 17.6 | 3.8 | |
| >3 | 21.6 | 76.2 | 19.5 | 4.3 | |
| Dementia, % | 5.9 | 63.7 | 29.6 | 6.7 | <0.001 |
| Frailty phenotype, % | |||||
| Robust | 43.2 | 84.0 | 13.9 | 2.0 | <0.001 |
| Pre-frail | 44.5 | 78.0 | 18.0 | 4.0 | |
| Frail | 12.3 | 68.3 | 24.9 | 6.8 |
Comorbidities include heart attack, heart disease, hypertension, arthritis, osteoporosis, diabetes, lung disease, stroke, and cancer
The results of linear regression analyses examining the relationship between social isolation and CRP are shown in Table 2. In unadjusted analysis (Model 1), older adults who experienced social isolation (population regression coefficient β=0.17, 95% CI 0.07–0.28) and severe social isolation (β=0.26, 95% CI 0.09–0.44) had higher levels of CRP compared with older adults who did not experience social isolation. More specifically, for Model 1 this indicates that there is a 0.17- and 0.26-unit log scale increase in CRP for socially isolated and severely socially isolated groups, respectively compared to the group who did not experience social isolation. In adjusted analysis with sociodemographic variables included (Model 2), older adults who experienced social isolation (β=0.14, 95% CI 0.03,0.25) and severe social isolation (β=0.23, 95% CI 0.04–0.41) had higher levels of CRP compared with older adults who did not experience social isolation. In the fully adjusted analysis controlling for sociodemographic and health variables (Model 3), the associations remained statistically significant.
Table 2:
ASSOCIATION BETWEEN SOCIAL ISOLATION AND NATURAL LOG TRANSFORMED CRP, NATIONAL HEALTH AND AGING TRENDS STUDY, 2017
| Model 1 | Model 2 | Model 3 | |
|---|---|---|---|
| Social Connection | β (95%CI) | β (95%CI) | β (95%CI) |
| No Social isolation | --- | --- | --- |
| Social isolation | 0.17‡ (0.07,0.28)** | 0.14 (0.03,0.25)* | 0.13 (0.02,0.24)* |
| Severe Social isolation | 0.26 (0.09,0.44)** | 0.23 (0.04,0.41)* | 0.18 (0.01,0.36)* |
p < 0.05,
p < 0.01,
Interpretation of β population coefficient- There is a 0.17 unit log scale increase in CRP for the socially isolated compared to the group who did not experience social isolation.
Model 1 unadjusted
Model 2 adjusted for age, gender, race/ethnicity, income
Model 3 adjusted for age, gender, race/ethnicity, income, smoking, BMI, comorbidity (# chronic disease), dementia, depressive symptoms and frailty
The association between social isolation and IL-6 is shown in Table 3. Unadjusted analysis (Model 1) indicates that older adults who experienced social isolation (β=0.16, 95% CI 0.10–0.21) and severe social isolation (β=0.19, 95% CI 0.04–0.33) had higher levels of IL-6 compared to their counterparts that did not experience social isolation. Additionally, IL-6 levels were higher in older adults who experienced social isolation (β=0.13, 95% CI 0.07–0.20) and severe social isolation (β=0.16, 95% CI 0.01–0.31) after adjusting for sociodemographic factors in Model 2. In the fully adjusted analysis with sociodemographic and health factors in Model 3, older adults who experienced social isolation had higher levels of IL-6 (β=0.11, 95% CI 0.04–0.18) compared to older adults who did not experience social isolation. However, older adults who experienced severe social isolation did not have statistically significant higher levels of IL-6.
Table 3:
ASSOCIATION BETWEEN SOCIAL ISOLATION AND NATURAL LOG TRANSFORMED IL-6, NATIONAL HEALTH AND AGING TRENDS STUDY, 2017
| Model 1 | Model 2 | Model 3 | |
|---|---|---|---|
| Social connection | β (95%CI) | β (95%CI) | β (95%CI) |
| No Social isolation | --- | --- | --- |
| Social isolation | 0.16 (0.10,0.21)*** | 0.13 (0.07,0.20)*** | 0.11 (0.04,0.18)** |
| Severe Social isolation | 0.19 (0.04,0.33)* | 0.16 (0.01,0.31)* | 0.10 (−0.05,0.26) |
p < 0.05,
p < 0.01,
p<0.001
Model 1 unadjusted
Model 2 adjusted for age, gender, race/ethnicity, income
Model 3 adjusted for age, gender, race/ethnicity, income, smoking, BMI, comorbidity (# chronic disease), dementia, depressive symptoms and frailty
DISCUSSION
This study expands our understanding of the relationship between social isolation and two commonly studied biological markers in a nationally representative sample of community dwelling older adults in the United States. We found that socially isolated older adults have higher levels of IL-6 and CRP than older adults who were not socially isolated after adjusting for covariates. The association between social isolation and elevated levels of CRP were statistically significant across all models; however, the relationship between severe social isolation and IL-6 was not statistically significant in the fully adjusted Model 3, though the directionality of the association persisted. We advance existing knowledge by identifying, in unadjusted and adjusted analyses, a dose-response relationship between social isolation and biological markers. Few other studies have included objective classifications of social isolation that are multi-domained or include varying levels of social isolation. Identifying older adults who are severely socially isolated (i.e., have no one to talk to, live alone, and do not engage anyone in society on a regular basis) may facilitate efforts to target a population at greater risk compared to older adults with some or more moderate social connections. Furthermore, stratifying severity of social isolation extends our understanding of the mechanisms by which high levels of this burdensome problem impact biological processes in a unique manner and possibly lead to increased risk for morbidity and mortality.
Prior epidemiological studies have identified associations between social isolation and biological markers of inflammation.4,6,15,24 Our results confirm these findings, specifically demonstrating an association between social isolation and CRP and IL-6 in both unadjusted and adjusted analyses. Prior studies examining the association between social isolation and CRP were often conducted in younger, smaller, or more racially/ethnically homogenous samples, outside of the United States, or did not adjust for relevant covariates.4,6,24,25 Our study confirms existing knowledge about the relationship between social isolation and biological markers in that we observe the aforementioned associations in a representative population of community dwelling older adults (mean age 76) utilizing a multi-domained typology of social isolation and samples collected via DBS sampling techniques.
Inflammation is a complex process that involves various molecules including IL-6 and CRP; elevations of these biological markers are unambiguous markers of this process.9 Despite this a study strength is that NHATS employs DBS sampling in a large population of older adults, demonstrating its feasibility and acceptability (93.1% response rate for those eligible) in this population.20 A recent meta-analysis reported that overall, no association between social isolation and elevated levels of IL-6 was observed.4 Our findings relating to IL-6 differ from this meta-analysis and are concordant with a recent adjusted analysis using Framingham Heart Study data that did find an association between social isolation and IL-6.15 Notably, this finding was only among men. We also found that older adults classified as severely socially isolated had higher levels of IL-6 and CRP than the socially isolated group across each model. These findings, in conjunction with a growing body of evidence, offer further clarity regarding the relationship between social isolation and poor health, which may operate via an inflammatory cascade of events that link social domains to immunological processes.
This study has limitations. The current study is cross-sectional, hindering our ability to draw causal conclusions from these findings. Future studies in older adults should consider repeated longitudinal measures of social isolation and biological markers to examine potential temporal lags in predictive associations. Additionally, participants living in long-term care settings or those whose interviews were completed by proxy respondents who were not eligible for this study. This notable exclusion of these individuals from the study may have influenced our results, as people with proxy reports may experience social or health factors that impact important biological processes. In the absence of a validated measure of social isolation in NHATS, we utilized a previously characterized typology that includes important objective measures; however, the items are collected using self-reported measures, which are subject to recall bias. Future studies to advance our understanding of the role of social domains on biological pathways might include measuring more specific markers such as TNF-α and IL-1β to further inform the extent to which social isolation leads to inflammation. Despite noted limitations, NHATS’ population-based design and inclusion of oldest age groups are methodological strengths that are informative and foundational for future exploration.
In conclusion, we found statistically significant relationships between social isolation and IL-6 and CRP in unadjusted and adjusted analyses of data from community dwelling older adults. Our results expand our understanding of the role of increased IL-6 and CRP as part of a pathway by which social isolation contributes to elevated morbidity and mortality. These findings are important because clinical and social interventions to address social isolation among older adults may influence these biological processes and their potentially negative effects. Furthermore, biomarkers may serve as an important outcome measure for social isolation interventions.
Acknowledgements
The authors thank Jin Huang for her assistance with statistical analyses.
Funding
Dr. Cudjoe was supported by the National Institute on Aging Grant R03AG064253 and the Secunda Family Foundation. Sruthi Selvakumar was supported by the MSTAR Program- Summer Research Training in Aging for Medical Students (2T35AG026758). Dr. Thorpe was supported by the National Institute on Aging (K02AG059140; R01AG054363), the National Institute on Minority Health and Health Disparities (U54MD000214). Dr. Boyd was supported by the National Institute on Aging/National Institutes of Health Grant K24 AG056578.
Footnotes
Conflict of Interest
Authors of this manuscript have no relevant conflict of interest.
REFERENCES
- 1.National Academies of Sciences Engineering and Medicine. Social Isolation and Loneliness in Older Adults: Opportunities for the Health Care System. Washington, D.C.: The National Academies Press; 2020. doi: 10.17226/25663 [DOI] [PubMed] [Google Scholar]
- 2.Berkman LF. The Changing and Heterogenous Nature of Aging and Longevity: A Social and Biomedical Perspective. In: Maddox GL, Lawton MP, eds. Annual Review of Gerontology and Geriatrics. Vol 8. Varieties of Aging. New York: Springer Science+Business Media; 1988:37–70. https://www.google.com/books/edition/Varieties_of_Aging/9wdJCAAAQBAJ?hl=en&gbpv=1&dq=Social+isolation+is+a+“chronically+stressful+condition+to+which+the+organism+responds+by+aging+faster”&pg=PA51&printsec=frontcover. Accessed October 7, 2020. [PubMed] [Google Scholar]
- 3.Cudjoe TKM, Roth DL, Szanton SL, Wolff JL, Boyd CM, Thorpe RJ. The Epidemiology of Social Isolation: National Health and Aging Trends Study. J Gerontol B Psychol Sci Soc Sci. 2020;75(1):107–113. doi: 10.1093/geronb/gby037 [DOI] [PMC free article] [PubMed] [Google Scholar]
- 4.Smith KJ, Gavey S, RIddell NE, Kontari P, Victor C. The association between loneliness, social isolation and inflammation: A systematic review and meta-analysis. Neurosci Biobehav Rev. 2020;112:519–541. doi: 10.1016/j.neubiorev.2020.02.002 [DOI] [PubMed] [Google Scholar]
- 5.Holt-Lunstad J, Smith TB. Loneliness and social isolation as risk factors for CVD: implications for evidence-based patient care and scientific inquiry. Heart. 2016;102(13):987–989. doi: 10.1136/heartjnl-2015-309242 [DOI] [PMC free article] [PubMed] [Google Scholar]
- 6.Shankar A, McMunn A, Banks J, Steptoe A. Loneliness, Social Isolation, and Behavioral and Biological Health Indicators in Older Adults. Heal Psychol. 2011;30(4):377–385. doi: 10.1037/a0022826 [DOI] [PubMed] [Google Scholar]
- 7.Eisenberger NI, Moieni M, Inagaki TK, Muscatell KA, Irwin MR. In Sickness and in Health: The Co-Regulation of Inflammation and Social Behavior. Neuropsychopharmacology. 2017;42(1):242–253. doi: 10.1038/npp.2016.141 [DOI] [PMC free article] [PubMed] [Google Scholar]
- 8.Leschak CJ, Eisenberger NI. Two Distinct Immune Pathways Linking Social Relationships With Health. Psychosom Med. 2019;81(8):711–719. doi: 10.1097/PSY.0000000000000685 [DOI] [PMC free article] [PubMed] [Google Scholar]
- 9.Del Giudice M, Gangestad SW. Rethinking IL-6 and CRP: Why they are more than inflammatory biomarkers, and why it matters. Brain Behav Immun. 2018;70:61–75. doi: 10.1016/j.bbi.2018.02.013 [DOI] [PubMed] [Google Scholar]
- 10.Giovannini S, Onder G, Liperoti R, et al. Interleukin-6, C-reactive protein, and tumor necrosis factor-alpha as predictors of mortality in frail, community-living elderly individuals. J Am Geriatr Soc. 2011;59(9):1679–1685. doi: 10.1111/j.1532-5415.2011.03570.x [DOI] [PMC free article] [PubMed] [Google Scholar]
- 11.Puzianowska-Kuźnicka M, Owczarz M, Wieczorowska-Tobis K, et al. Interleukin-6 and C-reactive protein, successful aging, and mortality: The PolSenior study. Immun Ageing. 2016;13(1). doi: 10.1186/s12979-016-0076-x [DOI] [PMC free article] [PubMed] [Google Scholar]
- 12.Pecoits-Filho R, Bárány P, Lindholm B, Heimbürger O, Stenvinkel P. Interleukin-6 is an independent predictor of mortality in patients starting dialysis treatment. Nephrol Dial Transplant. 2002;17(9):1684–1688. doi: 10.1093/ndt/17.9.1684 [DOI] [PubMed] [Google Scholar]
- 13.Mehra VC, Ramgolam VS, Bender JR. Cytokines and cardiovascular disease. J Leukoc Biol. 2005;78(4):805–818. doi: 10.1189/jlb.0405182 [DOI] [PubMed] [Google Scholar]
- 14.Li Y, Zhong X, Cheng G, et al. Hs-CRP and all-cause, cardiovascular, and cancer mortality risk: A meta-analysis. Atherosclerosis. 2017;259:75–82. doi: 10.1016/j.atherosclerosis.2017.02.003 [DOI] [PubMed] [Google Scholar]
- 15.Loucks EB, Sullivan LM, D’Agostino RB, Larson MG, Berkman LF, Benjamin EJ. Social networks and inflammatory markers in the Framingham heart study. J Biosoc Sci. 2006;38(6):835–842. doi: 10.1017/S0021932005001203 [DOI] [PubMed] [Google Scholar]
- 16.Yang YC, McClintock MK, Kozloski M, Li T. Social Isolation and Adult Mortality: The Role of Chronic Inflammation and Sex Differences. J Health Soc Behav. 2013;54(2):182–202. doi: 10.1177/0022146513485244 [DOI] [PMC free article] [PubMed] [Google Scholar]
- 17.Kasper JD, Freedman VA. National Health and Aging Trends Study User Guide: Rounds 1–9 Final Release. Baltimore; 2020. http://www.nhats.org/. [Google Scholar]
- 18.Cornwell EY, Waite LJ. Measuring social isolation among older adults using multiple indicators from the nshap study. Journals Gerontol - Ser B Psychol Sci Soc Sci. 2009;64(SUPPL.1). doi: 10.1093/geronb/gbp037 [DOI] [PMC free article] [PubMed] [Google Scholar]
- 19.Berkman LF, Syme SL. Social networks, host resistance, and mortality: A nine-year follow-up study of alameda county residents. Am J Epidemiol. 1979;109(2):186–204. doi: 10.1093/oxfordjournals.aje.a112674 [DOI] [PubMed] [Google Scholar]
- 20.Kasper JD, Skehan ME, Seeman T, Freedman VA. Dried Blood Spot (DBS) Based Biomarkers in the National Health and Aging Trends Study User Guide: Final Release. Baltimore; 2019. www.nhats.org. [Google Scholar]
- 21.Bandeen-Roche K, Seplaki CL, Huang J, et al. Frailty in Older Adults: A Nationally Representative Profile in the United States. Journals Gerontol Ser A. 2015;70(11):1427–1434. doi: 10.1093/GERONA/GLV133 [DOI] [PMC free article] [PubMed] [Google Scholar]
- 22.Kasper J, Freedman V. Addendum to Classification of Persons by Dementia Status in the National Health and Aging Trends Study for Follow-up Rounds. Baltimore; 2020. www.NHATS.org. Accessed October 28, 2020. [Google Scholar]
- 23.Tukey Beyer H., John W.: Exploratory Data Analysis. Addison-Wesley Publishing Company Reading, Mass. — Menlo Park, Cal., London, Amsterdam, Don Mills, Ontario, Sydney 1977, XVI, 688 S. Biometrical J. 1981;23(4):413–414. doi: 10.1002/bimj.4710230408 [DOI] [Google Scholar]
- 24.Loucks EB, Berkman LF, Gruenewald TL, Seeman TE. Relation of social integration to inflammatory marker concentrations in men and women 70 to 79 years. Am J Cardiol. 2006;97(7):1010–1016. doi: 10.1016/j.amjcard.2005.10.043 [DOI] [PubMed] [Google Scholar]
- 25.Ford ES, Loucks EB, Berkman LF. Social Integration and Concentrations of C-Reactive Protein Among US Adults. Ann Epidemiol. 2006;16(2):78–84. doi: 10.1016/j.annepidem.2005.08.005 [DOI] [PubMed] [Google Scholar]