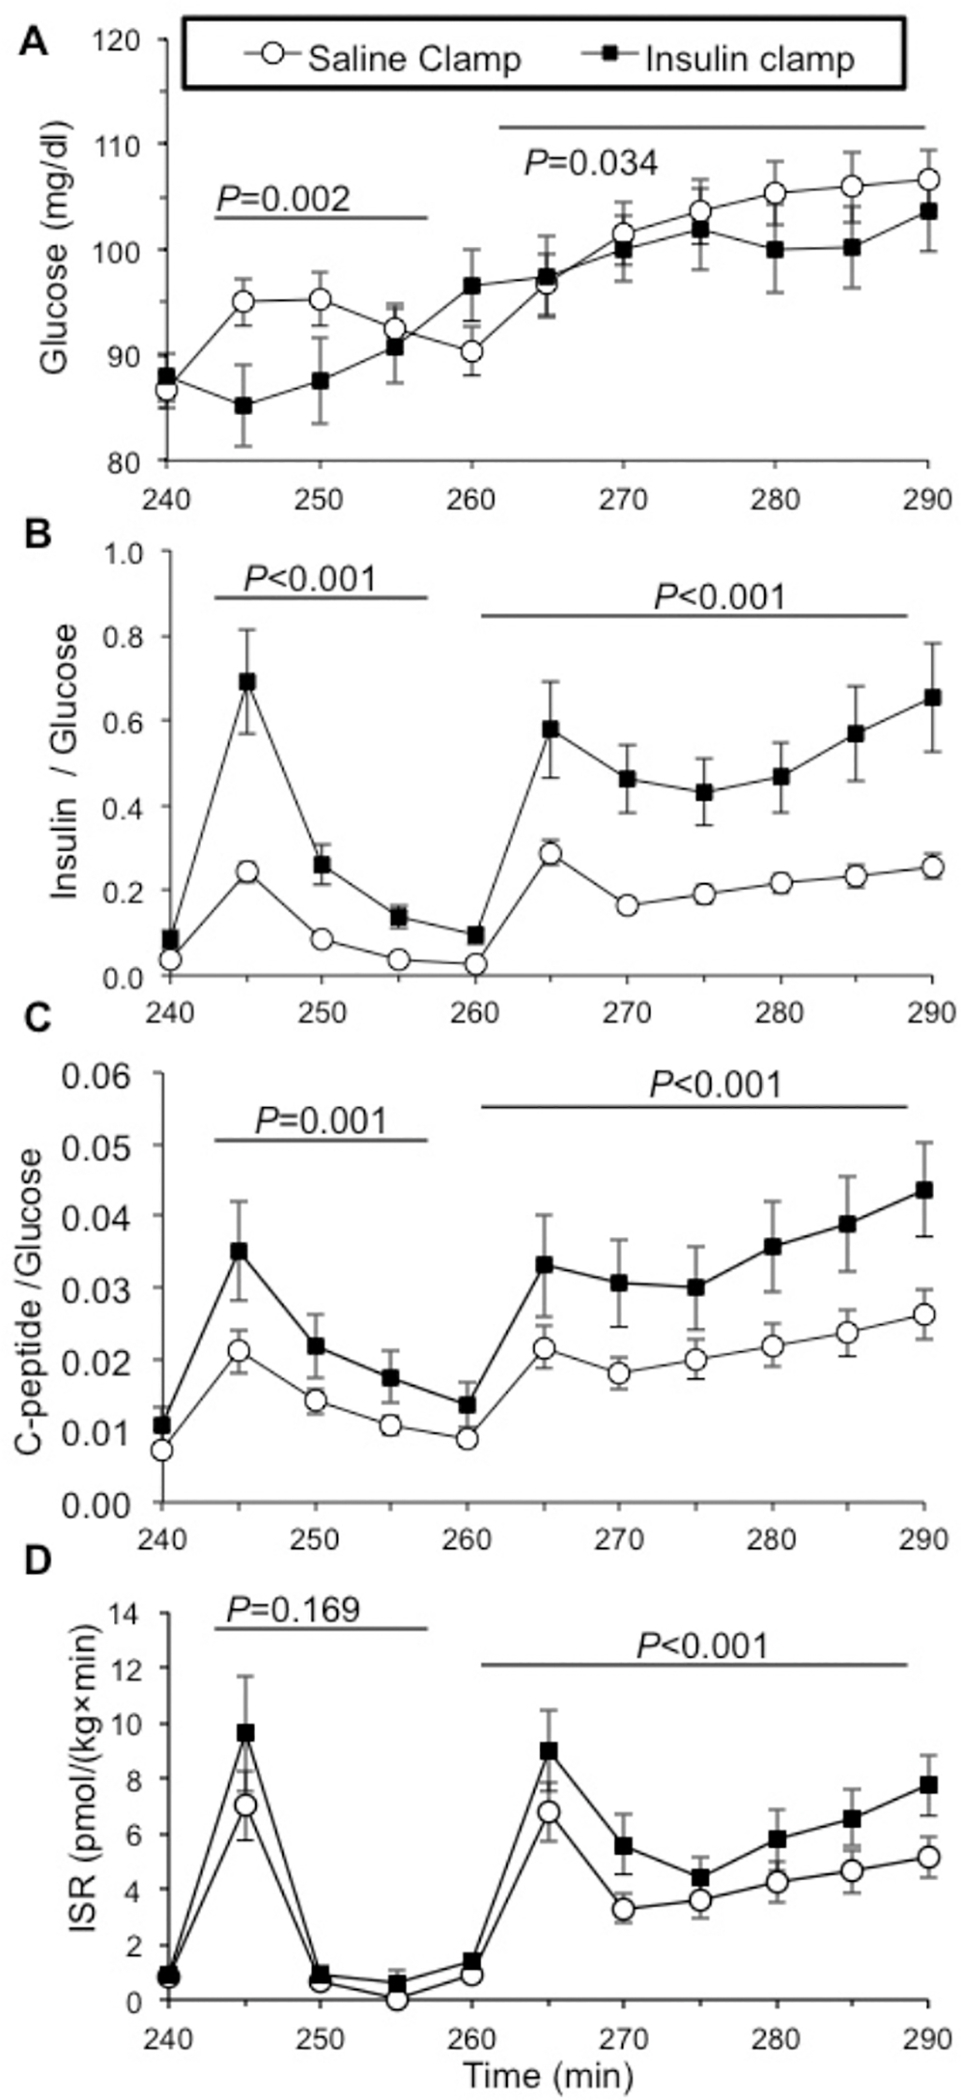
Figure 3: Increased arginine-stimulated insulin secretion corrected for glycemia after insulin pre-exposure in healthy humans.

During arginine stimulation (by intravenous bolus at time 240 minutes and continuous infusion time 260–290 minutes) the mean plasma glucose concentrations were lower following hyperinsulinemic compared with saline pre-exposure [A]. To account for potential confounding of different glucose concentrations achieved during the two study conditions, the insulin to glucose [B] and C-peptide-to-glucose [C] ratios were calculated, and found higher in response to arginine stimulation with hyperinsulinemia. The insulin secretion rate (ISR) estimated using the C-peptide deconvolution method was also higher in response to arginine bolus and infusion after insulin compared to saline pre-exposure [D]. After insulin pre-exposure there was a trend toward higher ISR in response to acute bolus arginine administration (P=0.169), and a significantly higher ISR response to arginine infusion (P<0.001). Saline clamp (○), insulin clamp (●).
