Correction to: Scientific Reports https://doi.org/10.1038/s41598-021-04510-2, published online 12 January 2022
The original version of this Article contained errors.
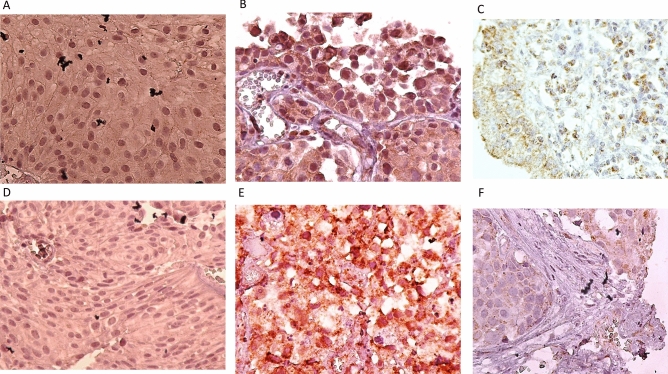
In Figure 2, panels (G), (H) and (I) were omitted. The original Figure 2 and accompanying legend appear below.
Figure 2.
Staining pattern of MAGE-A6 expression (A–C) and MAGE-A11 expression (D–F) in bladder tissues. (A) Intermediate staining for both nuclear and cytoplasmic expressions in low-grade BC (pTa stage), (B) Strong staining for nuclear expression and intermediate staining for cytoplasmic expression in high-grade BC (pT1 stage), (C) MAGE-A6 expression in adjacent normal tissue, (D) Weak staining for both nuclear and cytoplasmic expressions in low-grade BC (pTa stage), (E) Strong staining for both nuclear and cytoplasmic expressions in high-grade BC (pT2 stage), (F) MAGE-A11 expression in adjacent non-tumoral tissue, (G) MAGE-A6 expression in liver tissue as a positive control, (H) MAGE-A11 expression in prostate tissue as a positive control, and (I) Staining of bladder tissue with a nonreactive antibody (anti-CD11b antibody, negative control). All images were taken at 400× magnification.
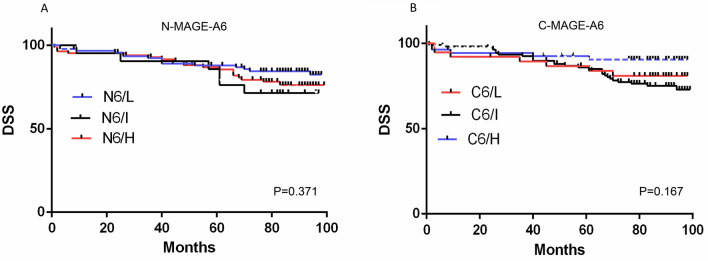
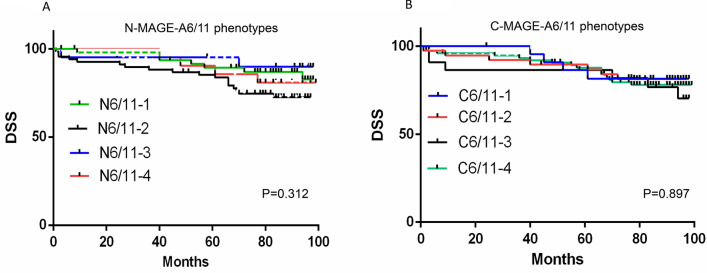
Similarly, in Figure 4, panels (C)–(H) and in Figure 5, panels (C) and (D) were omitted. The original Figures 4 and 5 and their accompanying legends appear below.
Figure 4.
Survival analysis for MAGE-A6 expression (A–D) and MAGE-A11 (E–H) in BC patients (Kaplan–Meier analysis). The number of patients in the analyzed groups is as follows: For DSS in N6/L group: 93 (censored (C) = 78 and death (D) = 15) , N6/I: 21 (C = 15 and D = 6), N6/H: 85 (C = 66 and D = 19), C6/L: 38 (C = 31 and D = 7), C6/I: 107 (C = 80 and D = 27), and C6/H: 54 (C = 48 and D = 6). For PFS in N6/L group: 93 (C = 72 and D = 21), N6/I: 21 (C = 14 and D = 7), N6/H: 85 (C = 62 and D = 23), C6/L: 38 (C = 28 and D = 10), C6/I: 107 (C = 75 and D = 32), and C6/H: 54 (C = 45 and D = 9). For DSS in N11/L group: 172 (C = 135 and D = 37), N11/I: 25 (C = 22 and D = 3), N11/H:16 (C = 14 and D = 2), C11/L: 57 (C = 48 and D = 9), C11/I: 67 (C = 54 and D = 13), and C11/H: 89 (C = 69 and D = 20). For PFS in N11/L group: 172 (C = 125 and D = 47), N11/I: 25 (C = 21 and D = 4), N11/H: 16 (C = 14 and D = 2), C11/L:57 (C = 45 and D = 12), C11/I: 67 (C = 52 and D = 15), and C11/H: 89 (C = 63 and D = 26). C: cytoplasm, C6: cytoplasmic expression of MAGE-A6, C11: cytoplasmic expression of MAGE-A11, DSS: disease-specific survival, H: high expression, I: intermediate expression L: low expression, N: nuclear, N6: nuclear expression of MAGE-A6, N11: nuclear expression of MAGE-A11, P: p value, PFS: progression free-survival. Charts were drawn by Prism version 8.3.0 software (Graph Pad Inc., San Diego, CA, USA). https://www.graphpad.com/support/faq/prism-830-release-notes/.
Figure 5.
Survival analysis for nuclear and cytoplasmic MAGE-A6/MAGE-A11 phenotypes. (A–D; Kaplan–Meier analysis). The number of patients in the analyzed groups is as follows: For DSS in N6/11–1 phenotype 49 (censored (C) = 40 and death (D ) = 9), N6/11–2: 67 (C = 49 and D = 18), N6/11–3: 21 (C = 19 and D = 2), N6/11–4: 21 (C = 17 and D = 4), C6/11–1: 23 (C = 19 and D = 4), and C6/11–2: 38 (C = 31 and D = 17), C6/11–3: 22 (C = 16 and D = 6) , and C6/11–4: 75 (C = 59 and D = 16) . For PFS in N6/11–1 phenotype 49 (C = 37 and D = 12), N6/11–2: 67 (C = 46 and D = 21), N6/11–3: 21 (C = 17 and D = 14), N6/11–4: 21 (C = 16 and D = 5), C6/11–1: 23 (C = 17 and D = 6), and C6/11–2: 38 (C = 30 and D = 8), C6/11–3: 22 (C = 16 and D = 6) , and C6/11–4: 75 (C = 53 and D = 22). C: cytoplasmic, C6/11: cytoplasmic expression of MAGE-A6 and MAGE-A11, DSS: disease-specific survival, N: nuclear, N6/11: nuclear expression of MAGE-A6 and MAGE-A11, P: p value, PFS: progression-free survival, 1: MAGE-A6low/MAGE-A11low phenotype, 2: MAGE-A6high/MAGE-A11low phenotype, 3: MAGE-A6low/MAGE-A11high phenotype, 4: MAGE-A6high/MAGE-A11high phenotype. Charts were drawn by Prism version 8.3.0 software (Graph Pad Inc., San Diego, CA, USA) https://www.graphpad.com/support/faq/prism-830-release-notes/.
Additionally, in Table 1, values in columns “Total samples N (%)”, “Nuclear expression of MAGE-A11” and “Cytoplasmic expression of MAGE-A11” were omitted. The original Table 1 and accompanying legend appear below.
Table 1.
Association between MAGE-A6 expressions (staining intensity and H-score) and clinic-pathological parameters of BC cases (p value, Pearson’s chi-square test).
| Patients and tumor characteristics | Total samples N (%) | Nuclear expression of MAGE-A11 | Cytoplasmic expression of MAGE-A11 | ||
|---|---|---|---|---|---|
| Staining Intensity | H-score | Staining Intensity | H-score | ||
| Median age | |||||
| Years | |||||
| ≤ 67 | 108 (51) | 0.079 | 0.638 | ||
| > 67 | 105 (49) | 0.075 | 0.932 | ||
| Gender | |||||
| Male | 170 (80) | 0.708 | 0.603 | ||
| Female | 43 (20) | 0.839 | 0.372 | ||
| Mean tumor size (cm) | |||||
| ≤ 2.5 | 134 (63) | 0.741 | 0.139 | ||
| > 2.5 | 79 (37) | 0.789 | 0.125 | ||
| Histological grade | |||||
| Low | 94 (44) | 0.349 | < 0.0001 | ||
| High | 119 (56) | 0.554 | < 0.0001 | ||
| pT stage | |||||
| pTa | 87 (40.8) | ||||
| pT1 | 95 (44.6) | 0.219 | < 0.0001 | ||
| pT2 | 31 (14.6) | 0.579 | < 0.0001 | ||
| pT3 | 0 (0) | ||||
| pT4 | 0 (0) | ||||
| Lamina propria involvement | |||||
| Involved | 126 (59) | 0.292 | < 0.0001 | ||
| None | 87 (41) | 0.954 | < 0.0001 | ||
| Muscularis invasion | |||||
| Involved | 31 (14.6) | 0.14 | 0.334 | ||
| None | 182 (85.4) | 0.339 | 0.684 | ||
| Lamina propria/muscularis involvement (L/M) | |||||
| L − /M- | 87 (40.8) | 0.219 | |||
| L + /M- | 95 (44.6) | 0.579 | 0.0001 | ||
| L + /M + | 31 (41.6) | < 0.0001 | |||
| Recurrence | |||||
| Present | 57 (27) | 0.577 | 0.203 | ||
| Absent | 156 (73) | 0.692 | 0.695 | ||
| Distant metastasis | |||||
| Present | 33 (15.5) | 0.262 | 0.097 | ||
| Absent | 180 (84.5) | 0.49 | 0.932 | ||
Bold numbers represent significant p values.
Finally, the data in Table 2 did not display correctly. The original Table 2 and accompanying legend appear below.
Table 2.
Association between MAGE-A11 expressions (staining intensity and H-score) and clinic-pathological parameters of BC cases (p value, Pearson’s chi-square test).
| Patients and tumor characteristics | Total samples N (%) | Nuclear expression of MAGE-A11 | Cytoplasmic expression of MAGE-A11 | ||
|---|---|---|---|---|---|
| Staining Intensity | H-score | Staining Intensity | H-score | ||
| Median age | |||||
| Years | |||||
| ≤ 67 | 108 (51) | 0.079 | 0.075 | 0.638 | 0.932 |
| > 67 | 105 (49) | ||||
| Gender | |||||
| Male | 170 (80) | 0.708 | 0.839 | 0.603 | 0.372 |
| Female | 43 (20) | ||||
| Mean tumor size (cm) | |||||
| ≤ 2.5 | 134 (63) | 0.741 | 0.789 | 0.139 | 0.125 |
| > 2.5 | 79 (37) | ||||
| Histological grade | |||||
| Low | 94 (44) | 0.349 | 0.554 | < 0.0001 | < 0.0001 |
| High | 119 (56) | ||||
| pT stage | |||||
| pTa | 87 (40.8) | ||||
| pT1 | 95 (44.6) | 0.219 | 0.579 | < 0.0001 | < 0.0001 |
| pT2 | 31 (14.6) | ||||
| pT3 | 0 (0) | ||||
| pT4 | 0 (0) | ||||
| Lamina propria involvement | |||||
| Involved | 126 (59) | 0.292 | 0.954 | < 0.0001 | < 0.0001 |
| None | 87 (41) | ||||
| Muscularis invasion | |||||
| Involved | 31 (14.6) | 0.14 | 0.339 | 0.334 | 0.684 |
| None | 182 (85.4) | ||||
| Lamina propria/muscularis involvement (L/M) | |||||
| L − /M- | 87 (40.8) | ||||
| L + /M- | 95 (44.6) | 0.219 | 0.579 | 0.0001 | < 0.0001 |
| L + /M + | 31 (41.6) | ||||
| Recurrence | |||||
| Present | 57 (27) | 0.577 | 0.692 | 0.203 | 0.695 |
| Absent | 156 (73) | ||||
| Distant metastasis | |||||
| Present | 33 (15.5) | 0.262 | 0.49 | 0.097 | 0.932 |
| Absent | 180 (84.5) | ||||
Bold numbers represent significant p values.
The original Article has been corrected.
Contributor Information
Monireh Mohsenzadegan, Email: mohsenzadegan.m@iums.ac.ir.
Leili Saeednejad Zanjani, Email: saeednejad.l@iums.ac.ir.


