Central Message:
Classification requires a threshold; however, methods like C-statistic and AUC obfuscate this. Luckily, there is a sensible strategy for imbalanced data thresholding.
Central Picture Legend:
The prevalence threshold yields accurate classification without dangerous data snooping.
Movahedi and colleagues [1] point out that Precision Recall AUC (PR-AUC) can be a better performance evaluation tool than Receiver Operating Characteristic AUC (ROC-AUC) for imbalanced data. This same point has also been made in recent editorials [2,3]. By comparing ROC and PR applied in a 90-day LVAD mortality study, the authors [1] conclude that ROC fails to reflect a classifier’s performance in detecting the rare cases by generating overly optimistic AUC. While we generally agree with this message, we wish to clarify certain points concerning classification and to note some recent developments.
Soft classification [4] is the problem of classifying an object using probability. The ubiquitous Bayes classifier assigns an object to one of two groups if probability exceeds 0.5. For machine learning (ML) methods, this often results in nearly all cases being classified to the majority group when data is highly imbalanced [5] (in the authors study, 92% of patients survive, the majority group, 8% die, the minority group; a relatively high Imbalanced Ratio (IR) of 92/8 = 11.5). The value 0.5 used by the Bayes classifier is called the threshold, and without such a threshold, soft classification cannot be performed.
ROC-AUC is insensitive to IR. Such a property is unwanted for imbalanced data since rare cases are usually associated with higher costs; proper performance metrics should show a monotonic decrease with increasing IR. While PR-AUC has this property, making it more suitable for imbalanced data, both methods fail to address soft classification. AUC methods like these provide an overall measure of performance by varying a hypothetical threshold but are silent on actual threshold value needed for soft classification.
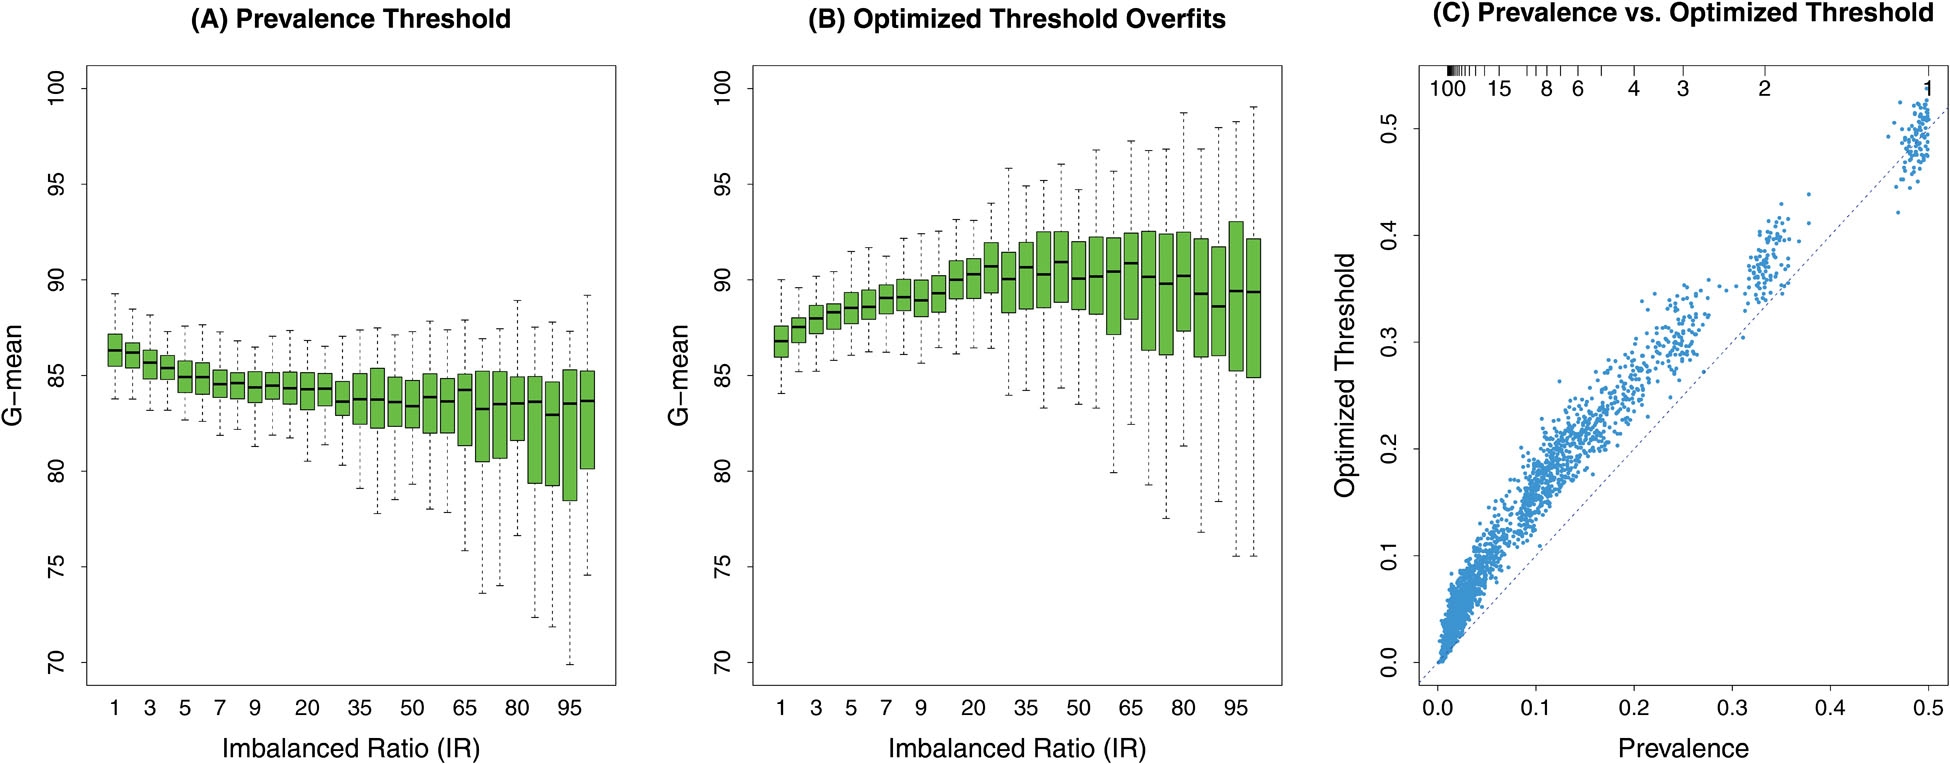
There is a simple solution called q*-classification designed specifically for imbalanced data [5,6]. This replaces the 0.5 threshold used by the Bayes classifier with the prevalence (fraction of minority group to overall sample size). Figure 1 shows G-mean (Geometric mean; an appropriate metric for imbalanced data) soft classification performance for the ML method random forest (RF). (A) RF uses q*-classification thresholding: performance is excellent even with extreme imbalanced data, IR=100. (B) RF uses threshold maximizing cross-validated G-mean: while performance appears excellent, results are optimistically biased due to over-training data (notice G-mean improves with worsening IR). (C) shows optimized threshold is inflated compared to prevalence values. Taken together, this shows superiority of the prevalence threshold without dangers of over-training.
Figure 1:

G-mean (Geometric mean) soft classification performance of the ML method random forest (RF). Data is classified as a rare case if RF out-of-bag (cross-validated) probability is larger than a specific threshold value. Classification data were simulated 100 times independently under Imbalanced Ratio (IR) varying from balanced (IR=1) to extreme imbalanced (IR=100) scenarios. (A) Threshold for RF classification equals prevalence (fraction of rare cases), a method called RFQ [6]. Performance of RFQ is excellent across all IR values. (B) Threshold for RF classification is selected by maximizing out-of-bag (cross-validated) G-mean. Even though optimization uses cross-validated values, results are optimistically biased as evident by G-mean values increasing with IR. (C) Optimized threshold values are inflated when compared to prevalence threshold values (the only exception being IR=1 when data is balanced; top right). Combined, this demonstrates optimality of RFQ (q*-classification) while avoiding double dipping the data.
In conclusion, the authors work adds to the growing concern of the misuse of ROC and C-statistics with imbalanced data. To their credit, the authors identify soft classification and the issue of threshold selection as a limitation of their study and call for future studies to address this. However, we caution that informal strategies to select threshold values may be doomed by the dangers of data snooping, which is exacerbated by the challenges of imbalanced data. We recommend q*-classification, which is an easily calculated threshold value, with guaranteed theoretical properties [6]. When combined with a flexible ML method like RF, this yields excellent performance.
Footnotes
Disclosures: None
References
- [1].Movahedi F, Padman R and Antaki JF, 2021. Limitations of ROC on imbalanced data: Evaluation of LVAD mortality risk scores. The Journal of Thoracic and Cardiovascular Surgery. [DOI] [PMC free article] [PubMed] [Google Scholar]
- [2].Ishwaran H and O’Brien R, 2020. Reply: The standardization and automation of machine learning for biomedical data. The Journal of Thoracic and Cardiovascular Surgery. [DOI] [PMC free article] [PubMed] [Google Scholar]
- [3].Ishwaran H and Blackstone EH, 2020. Commentary: Dabblers: Beware of hidden dangers in machine-learning comparisons. The Journal of Thoracic and Cardiovascular Surgery. [DOI] [PMC free article] [PubMed] [Google Scholar]
- [4].Wahba G, 2002. Soft and hard classification by reproducing kernel Hilbert space methods. Proceedings of the National Academy of Sciences, 99(26), pp.16524–16530. [DOI] [PMC free article] [PubMed] [Google Scholar]
- [5].Ishwaran H and O’Brien R, 2021. Commentary: The problem of class imbalance in biomedical data. The Journal of Thoracic and Cardiovascular Surgery, 161(6), p.1940. [DOI] [PMC free article] [PubMed] [Google Scholar]
- [6].O’Brien R and Ishwaran H, 2019. A random forests quantile classifier for class imbalanced data. Pattern Recognition, 90, pp.232–249. [DOI] [PMC free article] [PubMed] [Google Scholar]


