

Abstract
Glutathione is a ubiquitous cellular antioxidant, which is critically required to protect cells from oxidative damage and free radical injury. It is practically impossible to analyze glutathione in its native form after isolation from biological mixtures since the active form (GSH) spontaneously gets converted to the oxidized form (GSSG). To address this challenge, numerous highly sensitive detection methods, including mass spectrometry, have been used in conjunction with derivatization to block the oxidation of GSH. Efforts so far to quantitate GSH and GSSG using NMR spectroscopy method have remained unsuccessful. With a focus on addressing this challenge, in this study, we describe an extension to our recent whole blood analysis method [Anal Chem. 2017, 89:4620–4627] that includes the important antioxidants, GSH and GSSG. Fresh and frozen human whole blood specimens as well as standard GSH and GSSG were comprehensively investigated using NMR without and with derivatizing using N-ethylmaleimide (NEM). NMR experiments detect two diastereomers, distinctly, for the derivatized GSH and enable the analysis of both GSH and GSSG in human whole blood with an accuracy of > 99%. Interestingly, the excess (unreacted) NEM used for blocking the GSH can be removed from the samples during a drying step after extraction, with no need for additional processing. This is an important characteristic that offers an added advantage for simultaneous analysis of the antioxidants (GSH and GSSG), redox coenzymes (NAD+, NADH, NADP+, NADPH), energy coenzymes (ATP, ADP, AMP), and a large number of other blood metabolites using the same 1D NMR spectrum. The presented method broadens the scope of the global metabolite profiling and adds a new dimension to NMR-based blood metabolomics. Further, the method demonstrated here for human blood can be extended to virtually any biological specimen.
Keywords: Reduced glutathione (GSH), oxidized glutathione (GSSG), 1H 1D NMR, quantitation, redox coenzymes, energy coenzymes, antioxidants, whole blood metabolomics
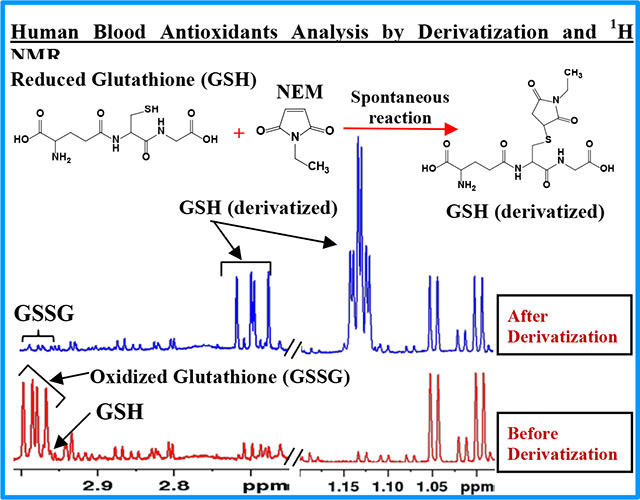
Graphical Abstract
INTRODUCTION
Glutathione, a ubiquitous and powerful cellular antioxidant, is critically required to protect cells from the deleterious effects of oxidative damage and free radical injury. It is a highly abundant metabolite in cells, with a concentration believed to be in the range of ~1 to 10 mM.1 It generally exists in two forms, reduced glutathione (GSH) and oxidized glutathione (GSSG). In biological specimens, most of the glutathione exists in the reduced form (GSH). The magnitude and the ratio of GSH and GSSG are useful indicators of the status of health as well as numerous human diseases associated with oxidative stress and free radical injury. Low blood GSH levels and GSH/GSSG ratios are detected under numerous pathological conditions.2–8 In view of their importance for human health and considering that blood glutathione levels potentially reflect its status in various human cells and tissue, analysis of blood GSH and GSSG represents an important measure of the human body status of glutathione levels.
Over the past half century, numerous analytical methods have been developed for the analysis of GSH and GSSG in biological specimens. Broadly, the methods have been based on spectrophotometry,9,10 fluorometry,11–13 and mass spectrometry.14–19 A major challenge for the analysis, unconnected with any analytical method, is the spontaneous oxidation of GSH to GSSG, which has resulted in the reporting of grossly incorrect and widely varying blood levels for both GSH and GSSG.20 To prevent oxidation, numerous studies have proposed masking the GSH thiol group (-SH) by pretreatment using derivatizing agents such as N-ethylmaleimide (NEM) and 2-Vinylpyridine.9,21 Subsequently, an increasing number of investigations have demonstrated that NEM is the most powerful agent that instantaneously blocks the thiol (-SH) group and prevents it from oxidizing.20,22–24 Based on comprehensive investigations of whole blood, detailed NEM treatment protocols have been developed, and highlight the need for immediate pretreatment of blood with excess NEM to block GSH oxidation, followed quickly (within 30 s) by protein precipitation to prevent a shift in the GSH/GSSG equilibrium caused by the irreversible blocking of GSH.20 However, despite numerous advances thus far, the methods lack the simplicity needed to measure blood GSH and GSSG on a routine basis. This is because, the methods involve cumbersome processing/derivatization steps, back extraction of the excess NEM, separate protocols for measuring GSH and GSSH, and/or the need for multiple isotopologues.1,23
In contrast, an approach that enables quantitative analysis of metabolites non-invasively, reproducibly, and with no need for separation, is provided by nuclear magnetic resonance (NMR) spectroscopy.25–31 NMR enables the measurement of absolute concentrations of a large number of metabolites in a single step.26,27,32,33 Since the pioneering work of Rabenstein and co-workers in 1977,34 several studies have measured GSH and GSSG in blood cells under in vitro conditions using spin-echo NMR experiments.35,36 In vitro analysis, however, lacks the ability to access a wider range of metabolite profiles, in one step. Analysis under ex vivo conditions, on the other hand, offers immense opportunity to profile a wide range of metabolites, simultaneously, and is particularly useful for wider blood metabolomics applications. Using ex vivo NMR, in the last few years, we have developed methods for the identification and quantitation of labile blood metabolites including redox coenzymes (NAD+, NADH, NADP+, NADPH) and energy coenzymes (ATP, ADP, AMP), and a large number of stable metabolites from a single 1H NMR spectrum.32,33,37 However, owing to their extreme instability, our efforts to extend the method to analyze both GSH and GSSG, individually, had until recently been unsuccessful.33 With the goal of addressing this major issue, the present study builds on our previous efforts and builds on the established NEM derivatization approach (Figure 1) to provide a new method for the analysis of GSH and GSSG in blood. The new method demonstrates the ability to analyze the antioxidants (GSH, GSSG), redox coenzymes, energy coenzymes, and a large pool of stable metabolites from a single 1H NMR spectrum. Importantly, the method offers a number of advantages over the conventional methods and provides a new dimension to NMR-based blood metabolomics and its applications.
Figure 1.
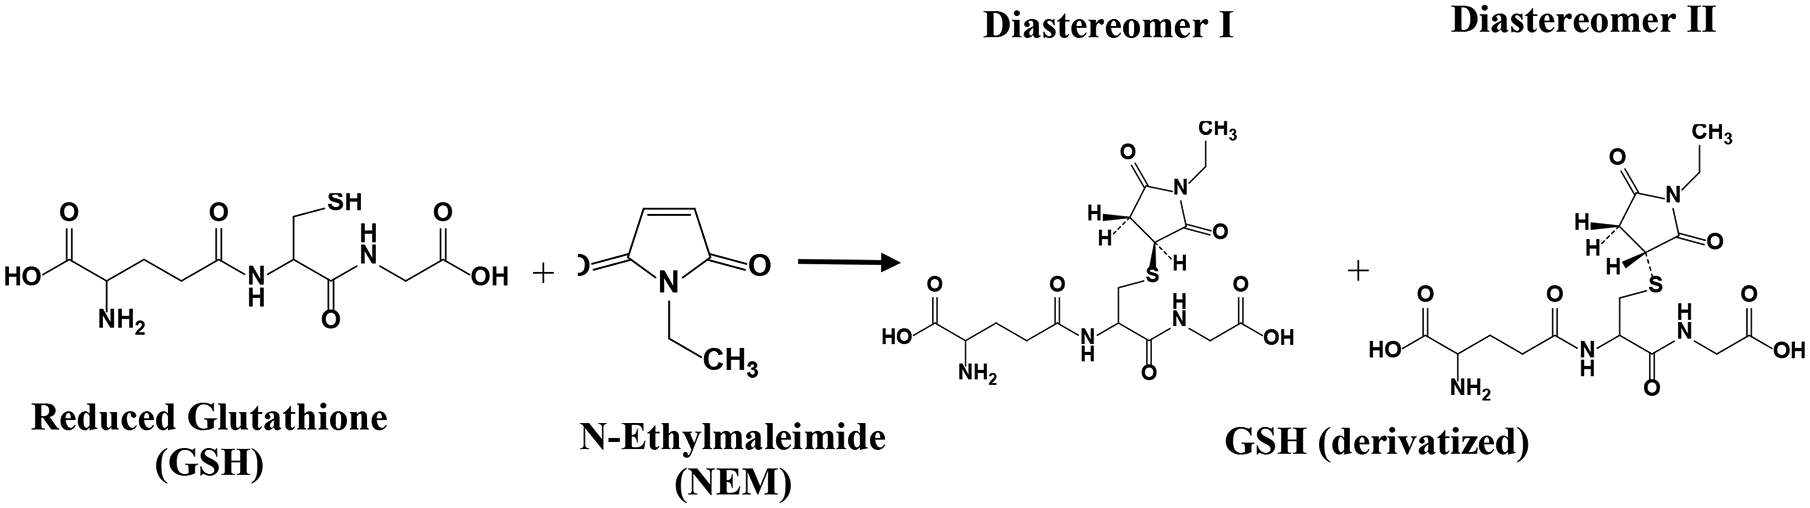
Reduced glutathione (GSH) spontaneously reacts with N-ethylmaleimide (NEM) and forms two stable diastereomers I and II.
MATERIALS AND METHODS
Chemicals and solvents:
Monosodium phosphate (NaH2PO4), disodium phosphate (Na2HPO4), fumaric acid, sodium salt of trimethylsilylpropionic acid-d4 (TSP), acetanilide, N-ethylmaleimide (NEM), reduced glutathione (GSH), oxidized glutathione (GSSG), ethanol, methanol, and chloroform were obtained from Sigma-Aldrich (St. Louis, MO) or Fisher (Waltham, MA). Deuterium oxide (D2O) was procured from Cambridge Isotope Laboratory (CIL) (Tewksbury, MA). Deionized (DI) water was purified using an in-house Synergy Ultrapure Water System from Millipore (Billerica, MA). All chemicals and solvents were used without further purification.
Biological samples:
Whole blood samples from healthy subjects (age range 35–70 years) were procured from Innovative Research, Inc. (Novi, MI), Solomon Park Research Laboratories (Seattle, WA), or Bioenergy Life Sciences Inc. (Minneapolis, MN).
Stock solutions of GSH, GSSG, and NEM:
GSH (10 mM and 50 mM), GSSG (10 mM), and NEM (2.5, 30, and 120 mM) solutions were prepared using DI water by weighing appropriate amounts.
Buffer solutions with internal standards:
A buffer solution (100 mM; pH = 7.4) was prepared by dissolving 1124.0 mg anhydrous Na2HPO4 and 249.9 mg anhydrous NaH2PO4 in 100 g D2O. Stock solutions of fumaric acid and TSP were added to the buffer solution to obtain 100 μM and 25 μM concentrations, respectively. The concentrations of fumaric acid and TSP were calibrated using a primary standard, acetanilide, using NMR.38
Extraction of metabolites from whole blood:
Aliquots of frozen or fresh whole blood (200 μL) were mixed with 400 μL of ethanol or methanol or 800 μL mixture of methanol and chloroform (1:1 ratio v/v). The solutions were vortexed for 2 min to ensure complete homogenization, sonicated for 10 min at 4 °C, vortexed for 30 s, and centrifuged at 13,400 x g for 30 min to pellet proteins and cell debris. The upper aqueous layer was transferred to a fresh vial and dried using nitrogen gas. The dried samples were mixed with 200 μL phosphate buffer in D2O containing a mixture of internal standards, fumaric acid and TSP, centrifuged for 60 s, and transferred to 3 mm NMR tubes for analysis.
GSH with and without Oxygenation.
Solutions (600 μL each) of the reduced form of the glutathione (GSH, 333 μM) were prepared using phosphate buffer in D2O (100 mM, pH 7.4). One part of each solution was used as a control and the other part was bubbled with oxygen gas for 60 s to 5 min. The solutions were transferred to 5 mm NMR tubes for analysis as a function of time.
NEM derivatization using standard solutions of reduced and oxidized glutathione (GSH and GSSG):
The standard solutions of both GSH and GSSG were treated with NEM solutions, separately, at a molar ratio of 1:2.5. Additionally, the GSH solution alone was treated with NEM at different molar ratios (1:5; 1:6, 1:60, and 1:120). The solutions of GSH and NEM were mixed using a vortex mixer for 30 s and were used for NMR measurement directly, without drying the solutions, or after drying using nitrogen gas. The dried samples were dissolved in 600 μL phosphate buffer in D2O (100 mM; pH 7.4) and transferred to 5 mm NMR tubes for NMR analysis as a function of time.
NEM derivatization of the GSH in whole blood:
NEM solution was added to both frozen and fresh blood samples (200 to 400 μL); such that the final concentration of NEM in blood was 2.5, 5, 10, or 30 mM. The samples were vortexed to ensure homogenization, and immediately (within 30 s) a mixture of methanol and chloroform (1:1 ratio v/v) was added in a volume that was four times larger than the blood/NEM sample. We have previously shown this 4:1 ratio to be optimal for the analysis of labile metabolites in blood.33 The solutions were vortexed for 60 s, sonicated for 10 min at 4 °C, vortexed again for 30 s and centrifuged at 13,400 x g for 30 min to pellet proteins and cell debris. The upper aqueous layer was transferred to a fresh vial and dried using nitrogen gas. Separately, recovery experiments were performed with or without spiking with known concentrations of GSH and GSSG prior to derivatizing with NEM; metabolites were extracted and samples dried as described above. The dried samples were mixed with 200 μL phosphate buffer in D2O containing a mixture of internal standards, fumaric acid and TSP, centrifuged for 60 s and transferred to 3 mm NMR tubes for analysis. While TSP was used for the chemical shift referencing, fumaric acid was used as a reference for metabolite quantitation. We have shown recently that fumaric acid is an optimal internal standard for the quantitation of whole blood metabolites.39
For blood samples, the D2O buffer and NMR tubes were flushed with helium gas to prevent oxidation of redox and energy coenzymes,33,40 and sealed using parafilm.
NMR Spectroscopy:
NMR experiments for standards and whole blood extracts, with and without derivatization using NEM, were performed at 298 K on a Bruker Avance III 800 MHz spectrometer equipped with a cryogenically cooled probe and z-gradients suitable for inverse detection. The NOESY and/or CPMG (Carr-Purcell-Meiboom-Gill) pulse sequences with residual water suppression using presaturation (with or without combining with pulsed-field gradients) were used for 1H 1D NMR experiments. The spectral width of 9615 or 10204 Hz, 3 or 55 s recycle delay, 32, 64 or 128 transients, and 32 or 64 K time-domain points were used for 1H 1D NMR experiments. Duration of the CPMG 180° pulse train was 32, 64, 128, or 256 ms. NMR experiments for NEM derivatized samples were performed immediately after preparing the solutions and then repeated several times over a period of up to 1 month to assess the stability of GSH after derivatizing with NEM. 1H 1D FIDs were Fourier transformed after zero filling by a factor of two and multiplied using an exponential window function with a line broadening (LB) of 0.3 Hz. Bruker software TopSpin version 3.6.1 or 4.1.0 was used for NMR data acquisition, processing, and analyses.
Additionally, to aid peak identification, for standard solutions of GSH after derivatizing with NEM, 1D 13C and 2D spectra were obtained. 1D 13C spectra were obtained using ‘zgpg’ pulse sequence and a spectral width of 40760 Hz, 2 s recycle delay, 1000 transients, and 128 K time domain points. FIDs were Fourier transformed after zero filling by factor of two and multiplied using an exponential window function with a line broadening (LB) of 3.0 Hz. The 2D NMR experiments performed include 1H-1H COSY (correlated spectroscopy), 1H-13C HSQC (heteronuclear single quantum coherence), and 1H-13C HMBC (heteronuclear multiple bond correlation). Spectra were obtained in magnitude mode for COSY and HMBC and phase-sensitive mode using echo-anti-echo for HSQC. 1H-1H COSY experiments were performed using ‘cosygpprqf’ pulse sequence and a spectral width of 10204 Hz in both dimensions; 512 FIDs were obtained with t1 increments, each with 2048 complex data points. The number of transients was 4 and the relaxation delay was 2.0 s. The resulting 2D data were zero-filled to 4096 and 1024 points in the t2 and t1 dimensions, respectively; Gaussian and unshifted sine-bell window functions were applied to t2 and t1 dimensions, respectively, before Fourier transformation. 1H-13C HSQC and HMBC experiments were performed using ‘hsqcetgpsisp2.2’ and ‘hmbcgplpndprdf’ pulse sequences, respectively. Spectral widths of 8802 Hz (1H) and 30186 Hz (13C) for HSQC and 8620 Hz (1H) and 40760 Hz (13C) for HMBC were used. 256 or 512 FIDs were obtained with t1 increments, each with 2048 and 4096 complex data points for HSQC and HMBC, respectively. The number of transients used was 8 or 16 and the relaxation delay was 1.05 s. The resulting 2D data were zero-filled to 4096 and 1024 points in t2 and t1 dimensions, respectively; a 45° shifted squared sine-bell window function was applied to both dimensions before Fourier transformation. The chemical shift scales were calibrated based on the TSP signal for 1H and 13C.
Identification and Quantitation of GSH and GSSG in blood:
The identification of the GSH and GSSG peaks in the NMR spectra of blood was based on the prior studies of blood32,33 in combination with spectra obtained before and after spiking with standard compounds. The identification of peaks from the GSH after derivatizing with NEM was based on the comprehensive analysis of 1D and 2D spectra. Based on the analysis, characteristic peaks for GSH and GSSG in the spectra, obtained with or without NEM derivatization and that do not overlap with other peaks from blood, were identified and used for quantitation. The peaks were integrated and concentrations were determined based on the internal standard, fumaric acid.39
RESULTS AND DISCUSSION
This work provides a simple method to quantitate GSH and GSSG and their ratio in whole blood using 1H NMR spectroscopy. In particular, the method relies on blocking the GSH oxidation by treating with NEM prior to metabolite extraction (Figure 1). The feasibility of analysis of NEM derivatized GSH by NMR was first comprehensively investigated using standard compounds. As an example, Figure 2 shows a typical 1H NMR spectrum of GSH-NEM, which is the product of GSH derivatization with NEM, along with the spectra of GSH and GSSG. Subsequently, the protocols were translated to measure GSH and GSSG in human blood specimens. Figure 3 and Figure S1 show typical NMR spectra of human blood with or without treating with NEM; the characteristic unique peaks of GSSG as well as NEM derivatized GSH are highlighted as insets in the figures. In blood samples that are not treated with NEM, virtually all the glutathione exists in the oxidized form (GSSG), whereas, in the samples treated with NEM, virtually all the glutathione exists in the reduced form (GSH-NEM). From the comprehensive analysis of the spectra, peaks for the ethyl –CH3 protons of the GSH-NEM (1.1321 ppm; 3H) and one of the Cys-βCH2 protons of the GSSG (2.9798 ppm; 2H) that do not overlap with other peaks (Figures 2, 3 and S1) were identified for facile quantitation of GSH and GSSG in blood. Concentrations derived using these peaks for a typical blood sample were 888 ± 1.7 μM for GSH and 30 ± 2.8 μM for GSSG. Recovery experiments performed by spiking with standard compounds showed an accuracy of > 99% for both GSH and GSSG.
Figure 2.
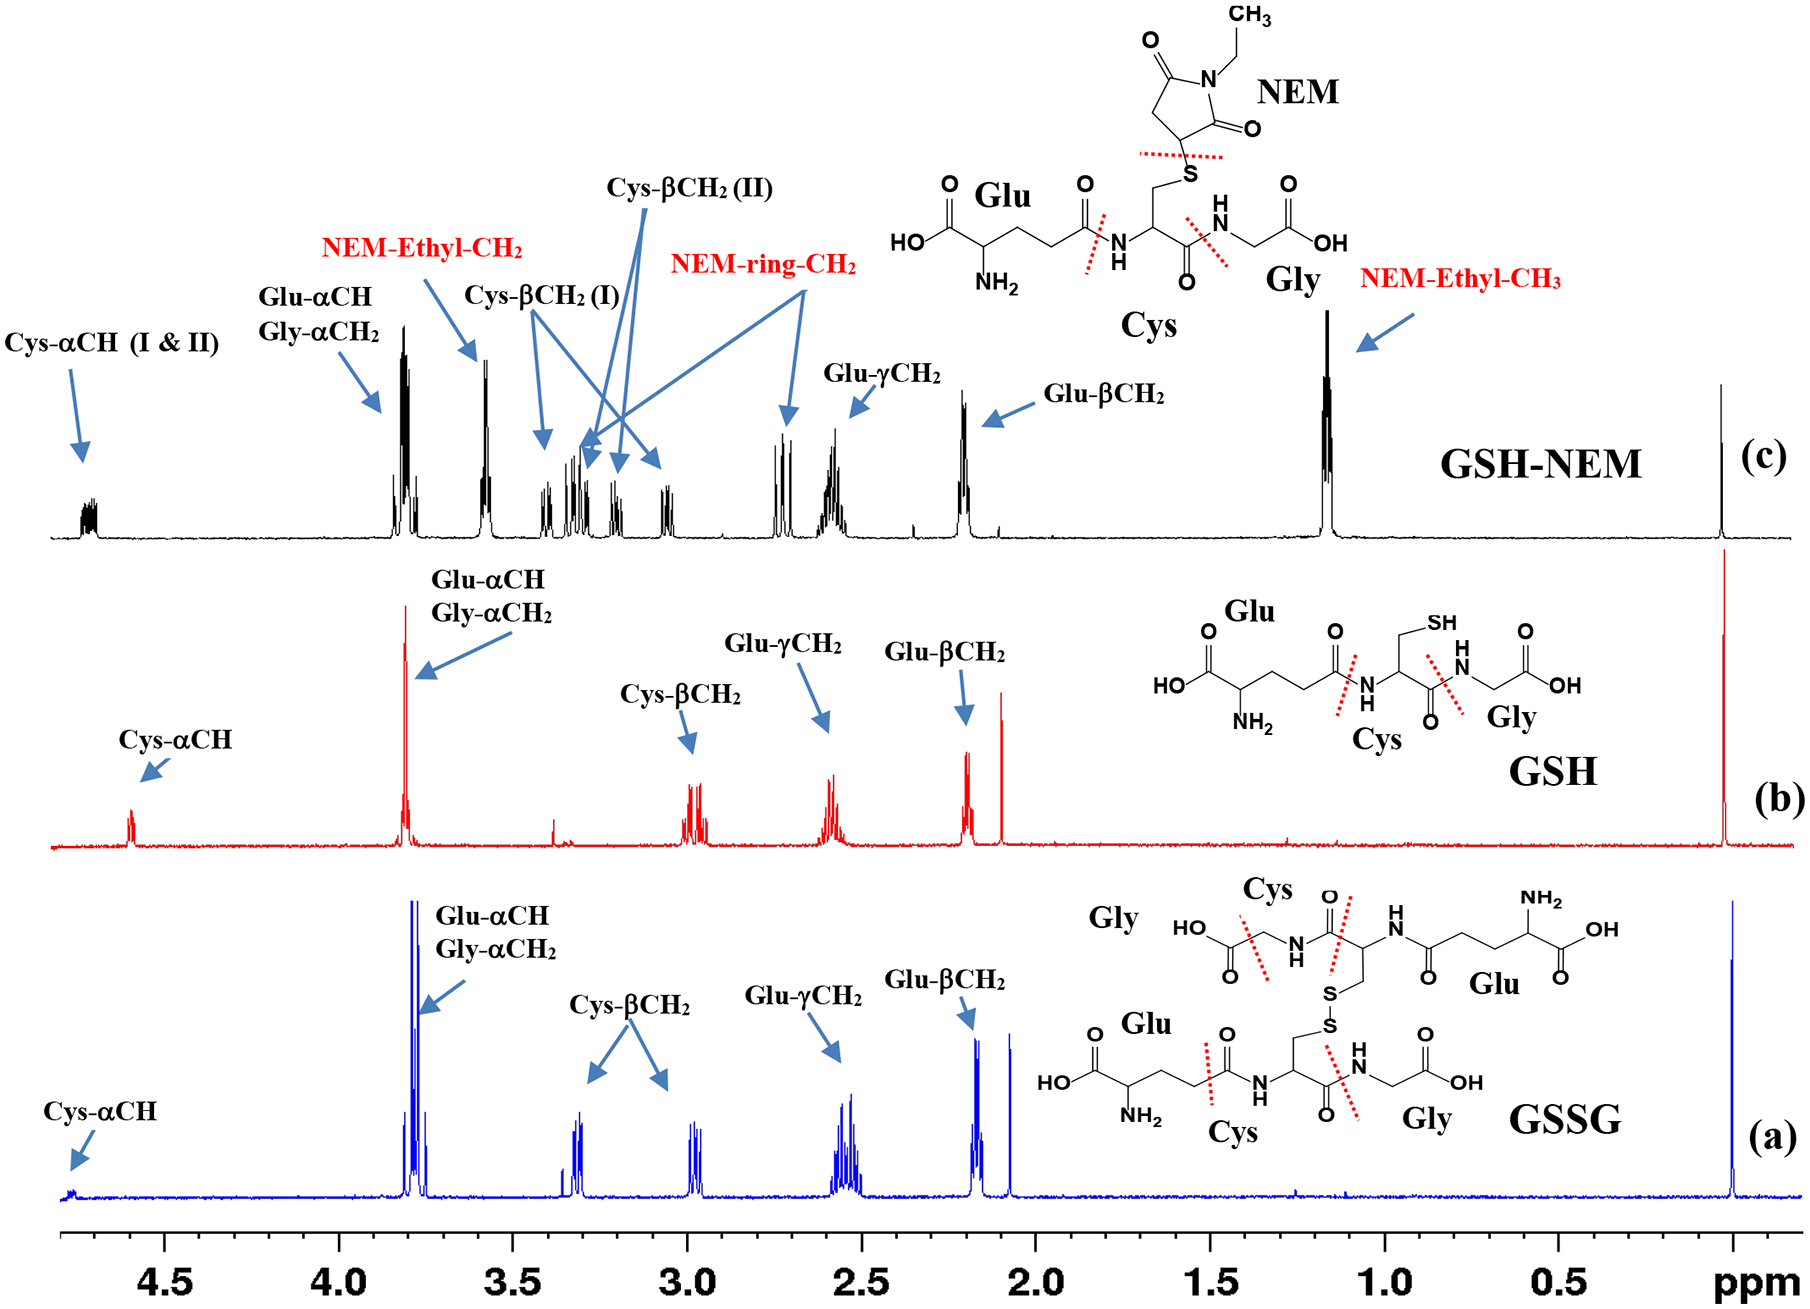
1H NMR spectra of (a) oxidized glutathione (GSSG); (b) reduced glutathione (GSH); and (c) GSH derivatized with N-ethylmaleimide (GSH-NEM). The spectra were obtained using the ‘noesypr1d’ pulse sequence on a Bruker 800 MHz AVANCE III spectrometer equipped with a cryoprobe. Peak assignments along with the chemical structure of the compounds are provided for each spectrum. Glu, Cys and Gly indicate glutamic acid, cysteine and glycine amino acid residues of the glutathione molecule, respectively. I and II in parentheses for Cys-αCH and Cys-βCH2 protons indicate signals corresponding to two diastereomers (I & II) of NEM in GSH-NEM.
Figure 3.
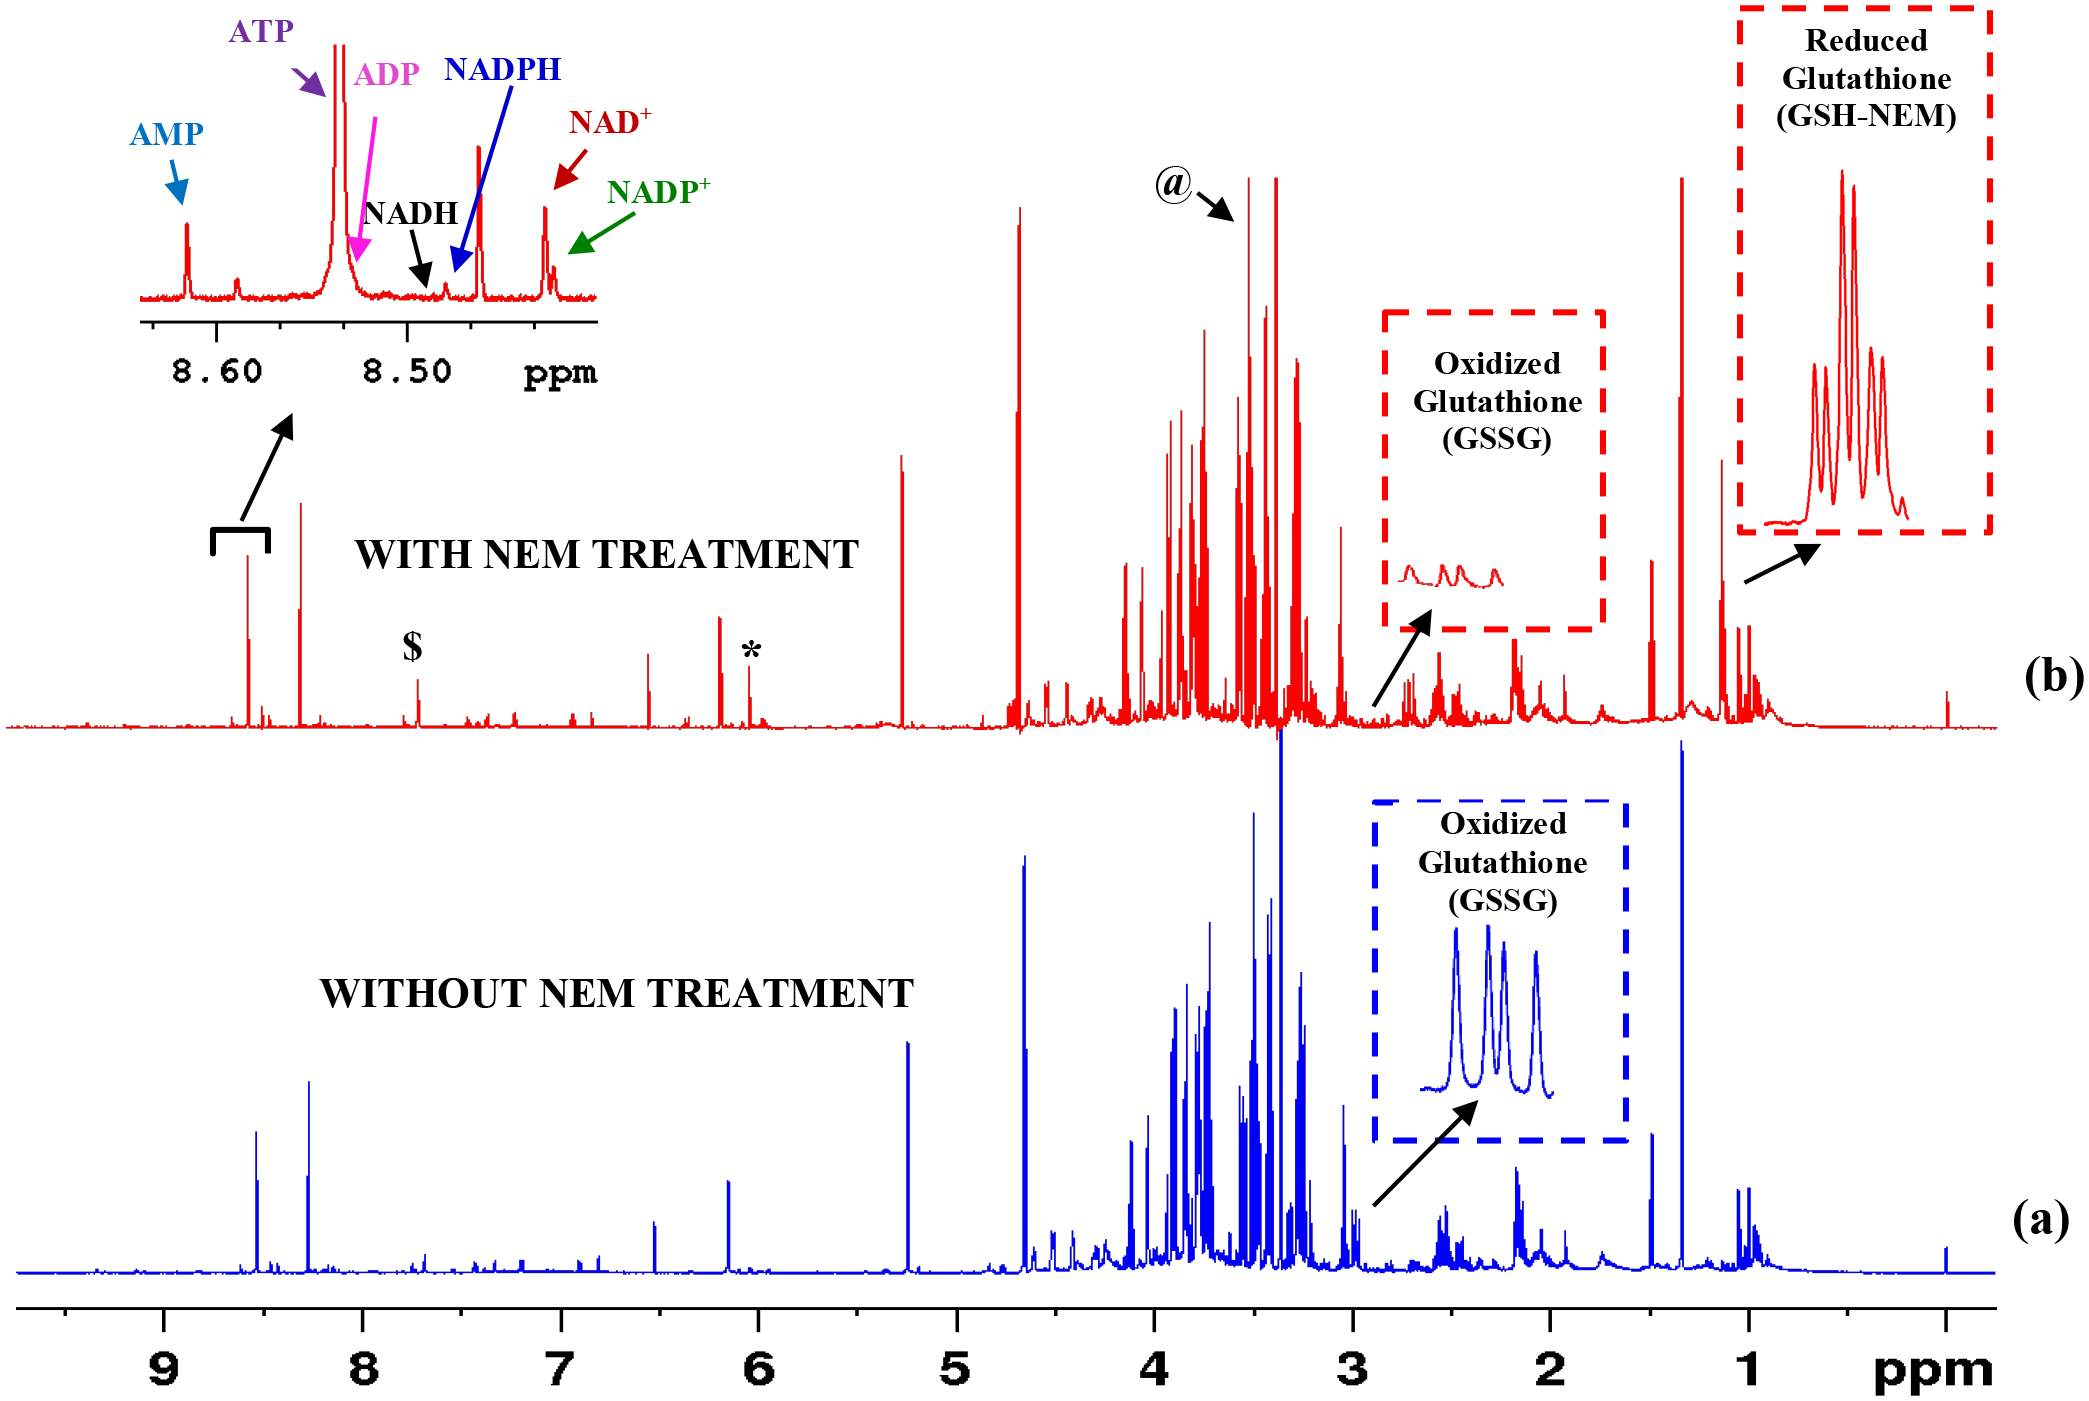
1H NMR spectra of typical human whole blood extracts: (a) Blood sample (400 μL) without treatment with NEM; and (b) Blood (400 μL) sample treated with 100 μL 120 mM NEM. The insets show characteristic peaks of GSSG and GSH after derivatizing with NEM (GSH-NEM) as well as redox and energy coenzymes. In (a), virtually all the glutathione exists in the oxidized form arising from the oxidation of GSH. In (b), GSH oxidation is blocked using NEM. Note, the two characteristic triplets ~ 1.132 ppm arise from the –CH3 protons of the GSH-NEM. Triplets are separated by ~3 Hz (0.0037 ppm) and they arise from the two diastereomers of the GSH-NEM (see structures in Figure 1). Spectra were obtained using the ‘noesypr1d’ pulse sequence on a Bruker 800 MHz AVANCE III spectrometer equipped with a cryoprobe. NAD+: nicotinamide adenine dinucleotide, oxidized; NADH: nicotinamide adenine dinucleotide, reduced; NADP+: nicotinamide adenine dinucleotide phosphate, oxidized; NADPH: nicotinamide adenine dinucleotide phosphate, reduced: ATP: adenosine triphosphate; ADP: adenosine diphosphate; AMP: adenosine monophosphate. *Maleic acid impurity from the NEM solution; $ residual chloroform and @ residual methanol from extraction solvents.
Unlike serum or plasma, whole blood analysis offers an opportunity to analyze important metabolites such as redox coenzymes, energy coenzymes, and antioxidants that are fundamental to functions of virtually all living cells. However, the coenzymes and antioxidants are labile and their levels are extremely sensitive to sample harvesting, extraction, and measurement conditions; hence their analysis is generally met with challenges. Recently, by addressing several factors that affect the stability of labile metabolites, we provided a simple 1D 1H NMR method for the analysis of nearly 80 blood metabolites that include the major redox coenzymes and energy coenzymes.33 Owing to the notoriously labile nature, however, the important antioxidants, GSH and GSSH, remained outside the purview of the method.33 Therefore, we focused our efforts to further optimize the harvesting, extraction, and measurement conditions.
As shown in Figure 4, GSH oxidation was reduced significantly when blood extraction was made using ethanol compared to the extraction using methanol or a mixture of methanol and chloroform; however, the attenuation of GSH levels in the ethanol extracted samples was still significant. Note, the characteristic peak from the Glu-γCH2 of the GSH at 2.597 ppm represents a measure of the GSH level in blood as indicated in Figure S2. Separately, investigations revealed that extraction of metabolites using frozen blood showed significantly higher GSH levels (by a factor of ~3) when compared to extraction using fresh blood; however, a major portion of the glutathione was still in the oxidized form (Figure S3). While the true origin of this effect is unknown to our knowledge, higher GSH levels in frozen blood compared to fresh blood may potentially be due to the reduction in the oxygen concentration that might arise upon freezing the blood. Given that each circulating red blood cell (RBC) transports up to 1 billion oxygen molecules and that venous blood RBCs are still nearly 75% oxygenated,41 the influence of blood oxygen on GSH oxidation may be significant. As a test of this hypothesis, as shown in Figure S4, a standard solution of GSH bubbled with oxygen gas exhibited > 85% oxidation, while the solution that was not bubbled with oxygen gas exhibited only 55% oxidation. These results further indicate that it is extremely difficult to analyze blood glutathione in its native form.
Figure 4.
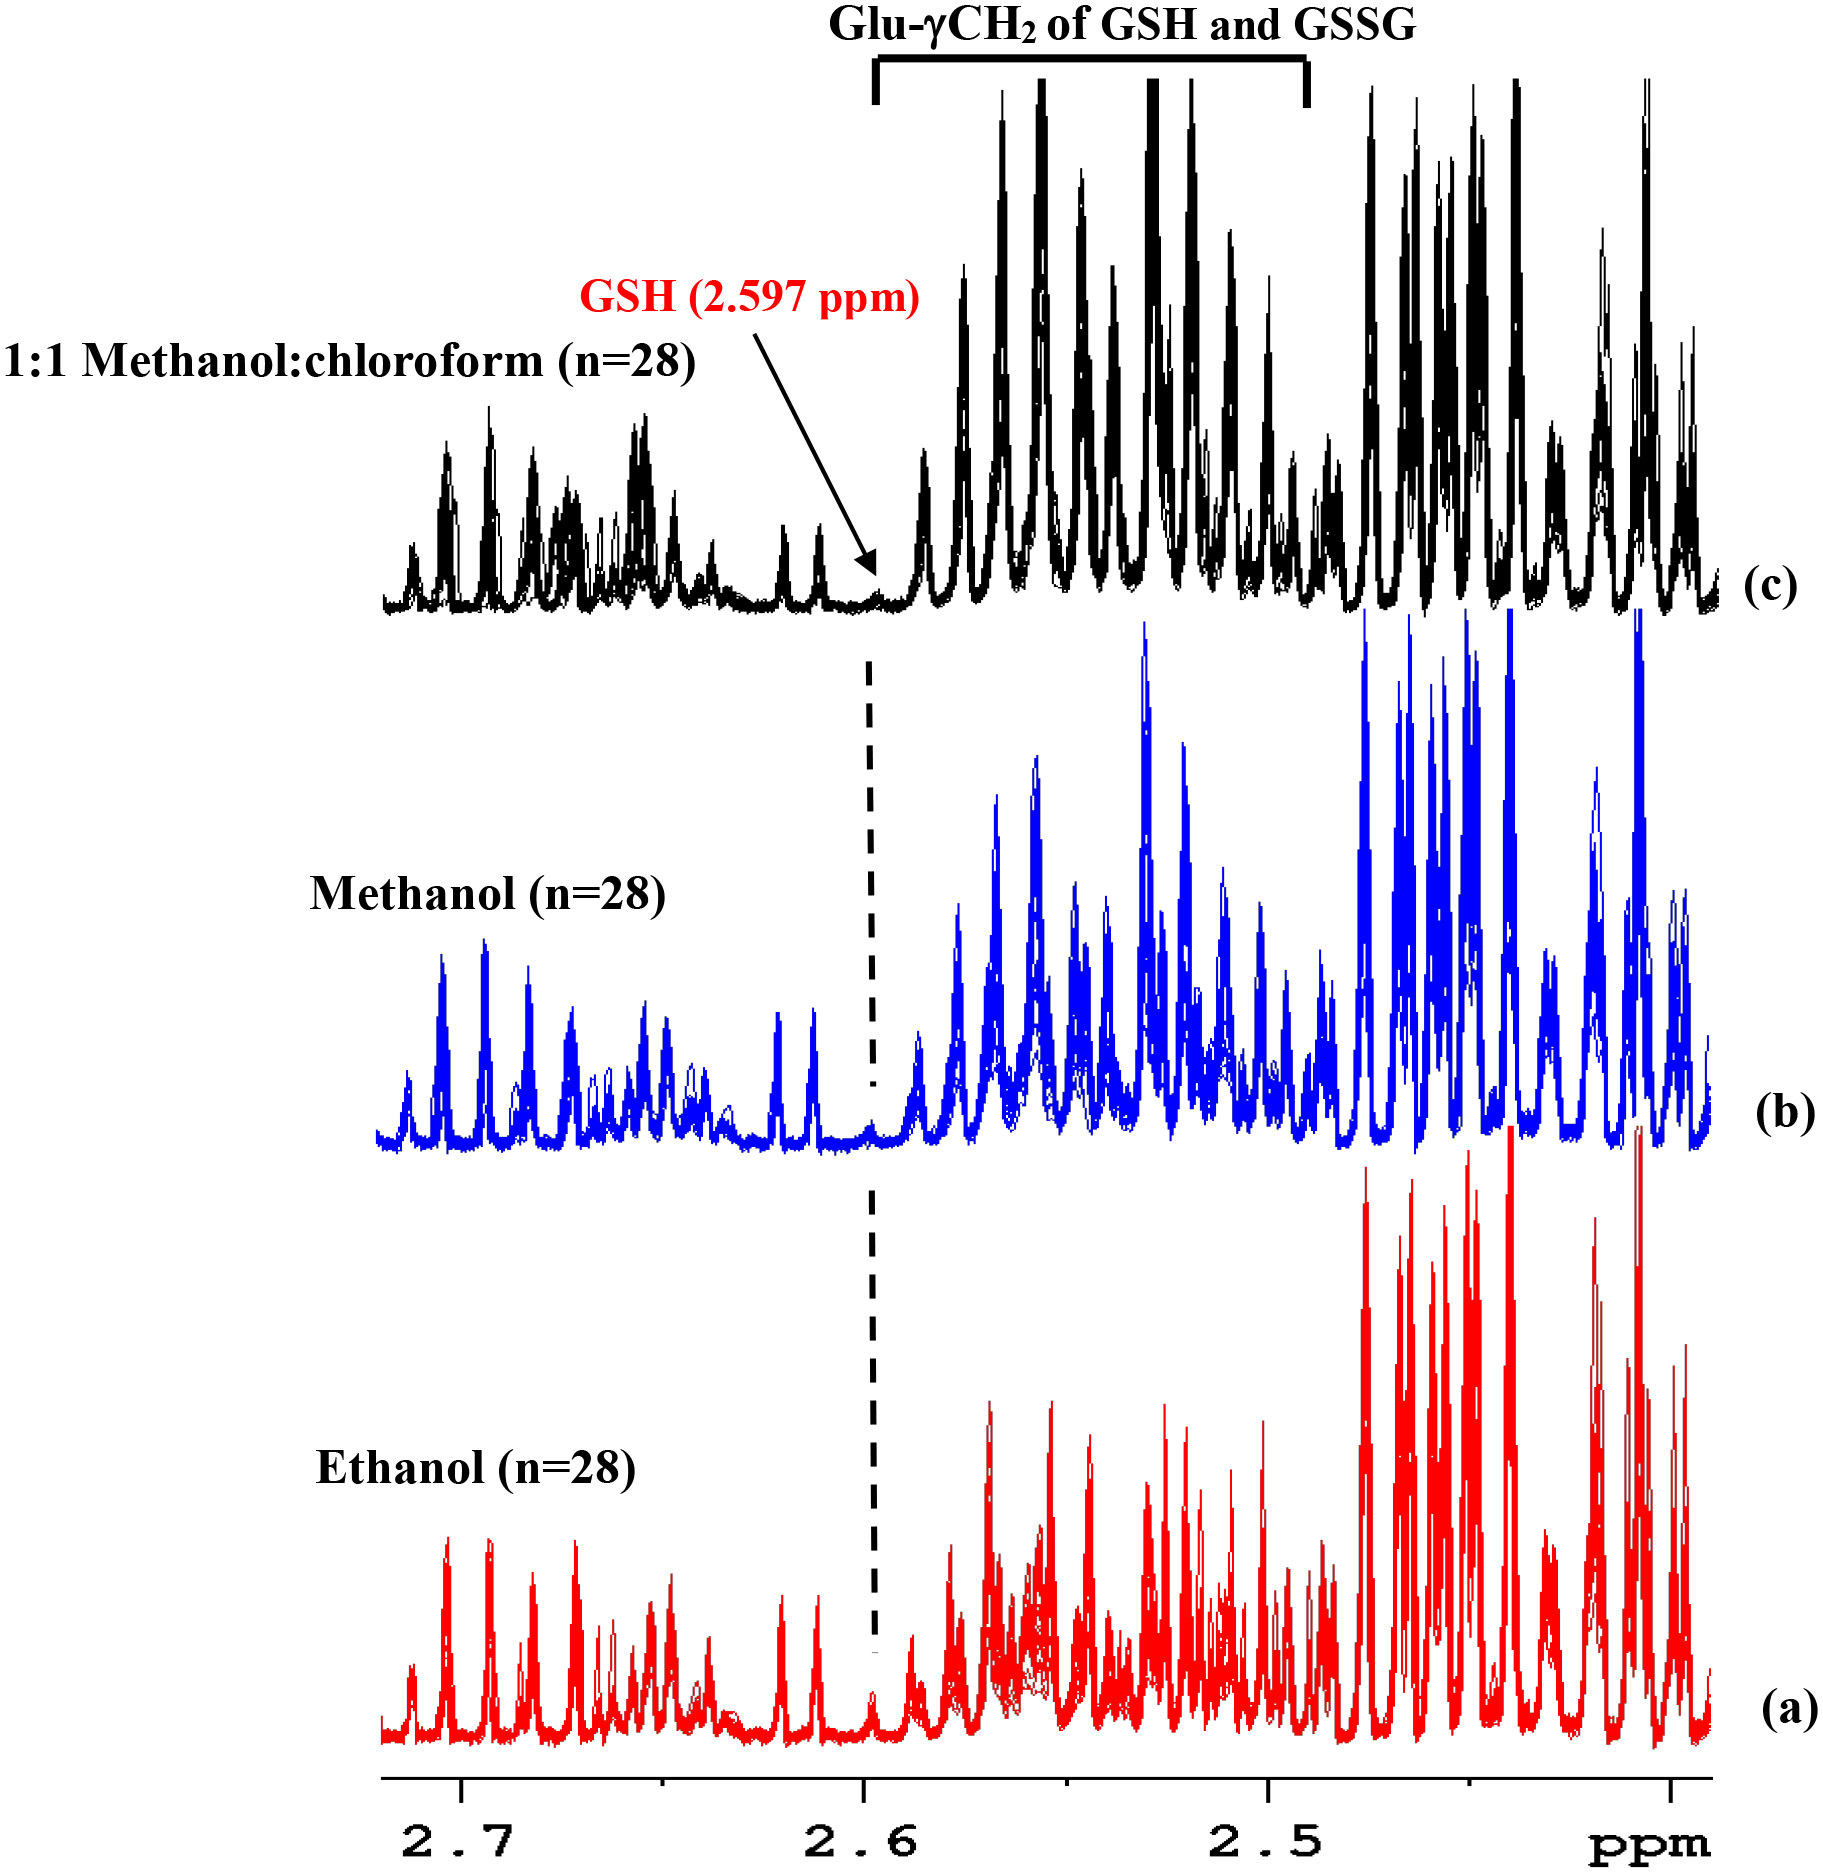
Overlaid portions of 1H NMR spectra of whole blood extracted using different solvents highlighting the GSH and oxidized GSSG peaks (see Figure 2 for the structure of GSH and GSSG). (a) Blood extracted using ethanol (n=28); (b) blood extracted using methanol (n=28); and (c) blood extracted using a 1:1 (v/v) mixture of methanol:chloroform (n=28). The spectra were obtained using the ‘cpmgpr’ pulse sequence using a Bruker 800 MHz AVANCE III spectrometer equipped with a cryoprobe. The lone characteristic peak at 2.597 ppm that does not overlap with other peaks (indicated with a vertical dashed line; see also Figure S2) enables visualization of the relative GSH levels in (a), (b) and (c). Figure 4(a) shows higher GSH levels than 4(b) and 4(c). However, the attenuation of the GSH in 4(a) is still very significant.
Continuing our efforts, we sought to combine with the method of blocking the oxidation of GSH using NEM with NMR analysis. We first made a comprehensive investigation using 1D and 2D NMR experiments using standard compounds (Figures S5 and S6). Upon mixing the standard solutions, GSH is instantaneously derivatized by NEM to form GSH-NEM and forms two diastereomers (Figure 1) with a 50:50 ratio. The derivatization generally involves the utilization of a large excess of the NEM to ensure a quick and complete blocking of the GSH from oxidizing. When 30 mM NEM was used in the experiments with blood samples, the solution had a 29 fold excess of unreacted NEM after derivatization, assuming a blood GSH concentration of ~ 1 mM.24 Conventionally, such an excess NEM needs to be removed typically by back extraction using dichloromethane, prior to analysis.1,23 Even for NMR analysis, the excess NEM needs to be removed prior to analysis; this is critical since the excess NEM not only restricts the dynamic range of the signal receiver, but more importantly, the massive CH3 peaks from NEM (~1.132 ppm) overlap with peaks from the derivatized GSH that are used for quantitation. However, we found that the excess NEM could easily be removed during sample drying after metabolite extraction (Figures 2 &3). Such an ability to remove the excess (unreacted) NEM with no need for additional processing steps, not only offers simplicity to the analysis of GSH and GSSG, but also it enables the analysis of redox coenzymes (NADH, NAD+, NADPH, and NADP+), energy coenzymes (ATP, ADP, and AMP), and a large number of stable blood metabolites simultaneously using the same 1D NMR spectrum32,33 (Figure 3). As with other metabolites, GSSG is stable in the presence of NEM; as an illustration, Figure S7 compares spectra of GSSG, NEM, and a mixture of GSSG and NEM as a function of time. While GSSG remains unaltered in the mixture, NEM is hydrolyzed to N-Ethylmaleamic acid (NEMA). Further, GSSG is stable during protein precipitation using organic solvents. This is illustrated using blood spiked with standard GSSG that involves organic solvents for protein precipitation (Figure S8); the results show > 99% recovery, which highlights the stability of GSSG.
It should be noted that the excess NEM used for derivatizing GSH undergoes hydrolysis in an aqueous solution to form N-ethylmaleamic acid (NEMA) so much so that when left in the solution for a long time, all the NEM will be hydrolyzed (Figure S9). Unlike NEM, the NEMA is not removed from samples upon drying (Figure S9 and S10). However, the hydrolysis is minimal (~1–2%) when samples are dried immediately after metabolite extraction. Although the low-intensity peaks from the NEMA generally do not interfere with metabolite quantitation, care should be exercised to minimize NEM hydrolysis by drying blood samples immediately after extraction. Further, a low-intensity doublet at 1.128 ppm that arises from 2-oxoisovalerate32,33 overlaps with the methyl (CH3) peaks from the derivatized GSH that are used for quantitation (Figures 2 and 3). The interference from the 2-oxoisovalerate, however, is negligible since its peak area is generally ~1000 times lower than the area of the derivatized GSH peak (Figure 3).
The CPMG pulse sequence is widely used to obtain 1D NMR spectra in the metabolomics field. It is particularly important for the analysis of bio-specimens such as intact plasma and serum. It suppresses the broad signals from proteins based on the differences in the transverse relaxation times (T2) between protein and metabolite signals. Even for protein precipitated blood samples, the CPMG pulse sequence helps to suppress residual protein signals.32,33,37 A drawback of the sequence, however, is that some metabolite peaks get attenuated non-linearly, which results in their underestimation. In the present study, we show that the CPMG sequence attenuates the characteristic unique peaks of the GSSG at ~2.98 ppm, which are used for quantitation. As an example, Figure S11 compares typical GSSG peak intensity as a function of 180° pulse train length of the CPMG sequence compared to the peak intensity from the NOESYPR pulse sequence. As seen in the figure, the GSSG peak attenuation is > 35% even for 32 ms 180 ° pulse train length. Such massive attenuation may in part be due to the relatively large size of the GSSG molecule (6 amino acid residues). These results indicate that the CPMG sequence is unsuitable for analysis of blood metabolites such as GSSG. Hence, in this study, we have used the 1D NOESYPR pulse sequence for quantitation of blood GSH and GSSG after NEM derivatization (Figure 3).
In conclusion, we provide a simple 1H 1D NMR method for analysis of GSH and GSSG, individually, in whole blood. The new method is superior to other methods including mass spectrometry, which involve cumbersome sample processing steps and the use of multiple isotopologues prior to analysis,1,23 which can also be unstable and therefore cause a loss of quantitation accuracy. Our new method does not use isotope-labeled GSH. It involves the addition of excess NEM to prevent the instantaneous oxidation of GSH and then removal of the excess unreacted NEM prior to analysis, accomplished by simply drying the sample. This method is thus suitable for the analysis of the antioxidants (GSH and GSSG), redox coenzymes (NAD+, NADH, NADP+, NADPH), energy coenzymes (ATP, ADP, AMP), and a large number of stable metabolites, simultaneously, as described previously.32,33 Overall, the method that now includes the major antioxidants expands the limit of metabolite profiling of blood and opens a new avenue for 1H NMR based metabolomics of blood.
Supplementary Material
Figure S1 shows expanded regions of blood spectra without and with derivatizing using NEM.
Figure S2 shows 1H NMR spectra of GSSG and GSH highlighting the unique peak from GSH.
Figure S3 shows overlaid portions of 1H NMR spectra from fresh and frozen blood.
Figure S4 shows 1H NMR spectra of GSH with and without bubbling with O2 gas.
Figure S5 shows portions of 1H-1H COSY spectrum of GSH after derivatizing with NEM.
Figure S6 shows 2D HSQC and HMBC spectra of GSH after derivatizing with NEM.
Figure S7 shows portions of 1H NMR spectra of GSSG, NEM, and their mixture.
Figure S8 shows 1H NMR spectra of a blood with or without NEM/ GSH and GSSG spiking.
Figure S9 shows portions of 1H NMR spectra with highlighting the hydrolysis of NEM.
Figure S10 shows portions of 1H NMR spectra of blood with highlighting the hydrolysis of NEM.
Figure S11 shows data with highlighting attenuation of GSSG peaks by ‘cpmgpr’ pulse sequence.
ACKNOWLEDGMENTS
The authors gratefully acknowledge financial support from the NIH (R01GM138465, P30DK035816) and Pilot Grant from the University of Washington Center for Translational Muscle Research (P30AR074990).
REFERENCES
- 1.Tomin T; Schittmayer M; Birner-Gruenberger R Addressing Glutathione Redox Status in Clinical Samples by Two-Step Alkylation with N-ethylmaleimide Isotopologues. Metabolites. 2020, 10(2), 71. [DOI] [PMC free article] [PubMed] [Google Scholar]
- 2.Enns GM; Cowan TM Glutathione as a Redox Biomarker in Mitochondrial Disease-Implications for Therapy. J. Clin. Med 2017, 6(5), 50. [DOI] [PMC free article] [PubMed] [Google Scholar]
- 3.Ballatori N; Krance SM; Notenboom S; Shi S; Tieu K; Hammond CL Glutathione dysregulation and the etiology and progression of human diseases. Biol. Chem 2009, 390 (3), 191–214. [DOI] [PMC free article] [PubMed] [Google Scholar]
- 4.Giustarini D; Dalle-Donne I; Tsikas D; Rossi R Oxidative stress and human diseases: Origin, link, measurement, mechanisms, and biomarkers. Crit. Rev. Clin. Lab. Sci 2009, 46 (5–6), 241–281. [DOI] [PubMed] [Google Scholar]
- 5.Morrison JA; Jacobsen DW; Sprecher DL; Robinson K; Khoury P; Daniels SR Serum glutathione in adolescent males predicts parental coronary heart disease. Circulation. 1999, 100 (22) 2244–2247. [DOI] [PubMed] [Google Scholar]
- 6.Hercbergs A; Brok-Simoni F; Holtzman F; Bar-Am J; Leith JT; Brenner HJ Erythrocyte glutathione and tumour response to chemotherapy. Lancet. 1992, 339, 1074–6. [DOI] [PubMed] [Google Scholar]
- 7.Herzenberg LA; De Rosa SC; Dubs JG; Roederer M; Anderson MT; Ela SW; Deresinski SC; Herzenberg LA Glutathione deficiency is associated with impaired survival in HIV disease. Proc. Natl. Acad. Sci. U. S. A 1997, 94, 1967–72. [DOI] [PMC free article] [PubMed] [Google Scholar]
- 8.Navarro J; Obrador E; Carretero J; Petschen I; Avino J; Perez P; Estrela JM Changes in glutathione status and the antioxidant system in blood and in cancer cells associate with tumour growth in vivo. Free Radic. Biol. Med 1999, 26, 410–8. [DOI] [PubMed] [Google Scholar]
- 9.Tietze F Enzymic method for quantitative determination of nanogram amounts of total and oxidized glutathione: applications to mammalian blood and other tissues. Anal. Biochem 1969, 27, 502–22. [DOI] [PubMed] [Google Scholar]
- 10.Brigelius R; Muckel C; Akerboom TP; Sies H Identification and quantitation of glutathione in hepatic protein mixed disulfides and its relationship to glutathione disulfide. Biochem. Pharmacol 1983, 32, 2529–34. [DOI] [PubMed] [Google Scholar]
- 11.Hakuna L; Doughan B; Escobedo JO; Strongin RM A simple assay for glutathione in whole blood. Analyst 2015, 140, 3339–3342. [DOI] [PMC free article] [PubMed] [Google Scholar]
- 12.Wang X; Chi D; Song D; Su G; Li L; Shao L Quantification of glutathione in plasma samples by HPLC using 4-fluoro-7-nitrobenzofurazan as a fluorescent labeling reagent. J. Chromatogr. Sci 2012, 50, 119–122. [DOI] [PubMed] [Google Scholar]
- 13.Nolin TD; McMenamin ME; Himmelfarb J Simultaneous determination of total homocysteine, cysteine, cysteinylglycine, and glutathione in human plasma by high-performance liquid chromatography: application to studies of oxidative stress. J. Chromatogr. B Anal. Technol. Biomed. Life Sci 2007, 852, 554–561. [DOI] [PMC free article] [PubMed] [Google Scholar]
- 14.Iwasaki Y; Saito Y; Nakano Y; Mochizuki K; Sakata O; Ito R; Saito K; Nakazawa H Chromatographic and mass spectrometric analysis of glutathione in biological samples J. Chromatogr. B 2009, 877, 3309–3317. [DOI] [PubMed] [Google Scholar]
- 15.Santa T Recent advances in analysis of glutathione in biological samples by high-performance liquid chromatography: a brief overview. Drug Discov. Ther 2013, 7(5), 172–7. [PubMed] [Google Scholar]
- 16.Bravo-Veyrat S; Hopfgartner G High-throughput liquid chromatography differential mobility spectrometry mass spectrometry for bioanalysis: determination of reduced and oxidized form of glutathione in human blood. Anal. Bioanal. Chem 2018, 410, 7153–7161. [DOI] [PubMed] [Google Scholar]
- 17.Fahrenholz T; Wolle MM; Kingston HM; Faber S; Kern JC 2nd; Pamuku M; Miller L; Chatragadda H; Kogelnik A Molecular speciated isotope dilution mass spectrometric methods for accurate, reproducible and direct quantification of reduced, oxidized and total glutathione in biological samples. Anal. Chem 2015, 87, 1232–1240. [DOI] [PubMed] [Google Scholar]
- 18.Blahova L; Kohoutek J; Lebedova J; Blaha L; Vecera Z; Buchtova M; Misek I; Hilscherova K Simultaneous determination of reduced and oxidized glutathione in tissues by a novel liquid chromatography-mass spectrometry method: application in an inhalation study of Cd nanoparticles. Anal. Bioanal. Chem 2014, 406, 5867–5876. [DOI] [PubMed] [Google Scholar]
- 19.Moore T; Le A; Niemi A-K; Kwan T; Cusmano-Ozog K; Enns GM; Cowan TM A new LC-MS/MS method for the clinical determination of reduced and oxidized glutathione from whole blood. J. Chromatogr. B Anal. Technol. Biomed. Life Sci 2013, 929, 51–55. [DOI] [PubMed] [Google Scholar]
- 20.Rossi R; Milzani A; Dalle-Donne I; Giustarini D; Lusini L; Colombo R; Di Simplicio P Blood glutathione disulfide: in vivo factor or in vitro artifact? Clin. Chem 2002, 48(5), 742–53. [PubMed] [Google Scholar]
- 21.Griffith OW Determination of glutathione and glutathione disulfide using glutathione reductase and 2-vinylpyridine. Anal. Biochem 1980, 106(1), 207–12. [DOI] [PubMed] [Google Scholar]
- 22.Mcgill MR; Jaeschke H A direct comparison of methods used to measure oxidized glutathione in biological samples: 2-vinylpyridine and N-ethylmaleimide. Toxicol. Mech. Methods 2015, 25(8), 589–95. [DOI] [PMC free article] [PubMed] [Google Scholar]
- 23.Giustarini D; Dalle-Donne I; Milzani A; Fanti P; Rossi R Analysis of GSH and GSSG after derivatization with N-ethylmaleimide. Nat. Protoc 2013, 8(9), 1660–9. [DOI] [PubMed] [Google Scholar]
- 24.Giustarini D; Dalle-Donne I; Milzani A; Rossi R. Detection of glutathione in whole blood after stabilization with N-ethylmaleimide. Anal. Biochem 2011, 415(1), 81–3. [DOI] [PubMed] [Google Scholar]
- 25.Gowda G. A. Nagana; Zhang S; Gu H; Asiago V; Shanaiah N; Raftery D Metabolomics-based methods for early disease diagnostics. Expert. Rev. Mol. Diagn 2008, 8(5), 617–633. [DOI] [PMC free article] [PubMed] [Google Scholar]
- 26.Gowda G. A. Nagana; Raftery D Can NMR solve some significant challenges in metabolomics? J. Magn. Reson 2015, 260, 144–60. [DOI] [PMC free article] [PubMed] [Google Scholar]
- 27.Gowda G.A. Nagana; Raftery D Recent Advances in NMR-Based Metabolomics. Anal Chem. 2017, 89(1), 490–510. [DOI] [PMC free article] [PubMed] [Google Scholar]
- 28.Larive CK; Barding GA Jr; Dinges MM NMR spectroscopy for metabolomics and metabolic profiling. Anal. Chem 2015, 87(1), 133–46. [DOI] [PubMed] [Google Scholar]
- 29.Clendinen CS; Lee-McMullen B; Williams CM; Stupp GS; Vandenborne K; Hahn DA; Walter GA; Edison AS 13C NMR metabolomics: applications at natural abundance. Anal. Chem 2014, 86(18), 9242–9250. [DOI] [PMC free article] [PubMed] [Google Scholar]
- 30.Ellinger JJ; Chylla RA; Ulrich EL; Markley JL Databases and Software for NMR-Based Metabolomics. Curr. Metabolomics 2013, 1(1): 10.2174/2213235X11301010028. [DOI] [PMC free article] [PubMed] [Google Scholar]
- 31.Halouska S; Fenton RJ; Barletta RG; Powers R Predicting the in vivo mechanism of action for drug leads using NMR metabolomics. ACS Chem. Biol 2012, 7(1):166–171. [DOI] [PMC free article] [PubMed] [Google Scholar]
- 32.Gowda G.A. Nagana; Gowda YN; Raftery D Expanding the limits of human blood metabolite quantitation using NMR spectroscopy. Anal. Chem 2015, 87(1), 706–715. [DOI] [PMC free article] [PubMed] [Google Scholar]
- 33.Gowda G.A. Nagana; Raftery D Whole Blood Metabolomics by 1 H NMR Spectroscopy Provides a New Opportunity To Evaluate Coenzymes and Antioxidants. Anal. Chem 2017, 89(8), 4620–4627. [DOI] [PMC free article] [PubMed] [Google Scholar]
- 34.Brown FF; Campbell ID; Kuchel PW; Rabenstein DC Human erythrocyte metabolism studies by 1H spin echo NMR. FEBS Letters. 1977, 82, 12–16. [DOI] [PubMed] [Google Scholar]
- 35.Rabenstein DL 1H NMR methods for the noninvasive study of metabolism and other processes involving small molecules in intact erythrocytes. J. Biochem. Biophys. Methods 1984, 9(4), 277–306. [DOI] [PubMed] [Google Scholar]
- 36.Reglinski J; Smith WE; Wilson R; Buchanan LM; McKillop JH; Thomson JA; Brzeski M; Marabani M; Sturrock RD Clinical analysis in intact erythrocytes using 1H spin echo NMR. Clinica. Chimica. Acta 1991, 201(1–2), 45–57. [DOI] [PubMed] [Google Scholar]
- 37.Gowda G. A. Nagana; Raftery D Quantitating metabolites in protein precipitated serum using NMR spectroscopy. Anal. Chem 2014, 86(11), 5433–40. [DOI] [PMC free article] [PubMed] [Google Scholar]
- 38.Rundlöf T; McEwen I; Johansson M; Arvidsson T Use and qualification of primary and secondary standards employed in quantitative 1H NMR spectroscopy of pharmaceuticals. J. Pharm. Biomed. Anal 2014, 93,111–7. [DOI] [PubMed] [Google Scholar]
- 39.Gowda G. A. Nagana; Hong NN; Raftery D Evaluation of Fumaric Acid and Maleic Acid as Internal Standards for NMR Analysis of Protein Precipitated Plasma, Serum, and Whole Blood. Anal Chem. 2021, 93(6), 3233–3240. [DOI] [PMC free article] [PubMed] [Google Scholar]
- 40.Gowda G.A. Nagana; Abell L; Lee CF; Tian R; Raftery D Simultaneous Analysis of Major Coenzymes of Cellular Redox Reactions and Energy Using ex Vivo (1)H NMR Spectroscopy. Anal Chem. 2016, 88(9), 4817–24. [DOI] [PMC free article] [PubMed] [Google Scholar]
- 41.Shepherd SJ; Pearse RM Role of central and mixed venous oxygen saturation measurement in perioperative care. Anesthesiology. 2009; 111, 649–656. [DOI] [PubMed] [Google Scholar]
Associated Data
This section collects any data citations, data availability statements, or supplementary materials included in this article.
Supplementary Materials
Figure S1 shows expanded regions of blood spectra without and with derivatizing using NEM.
Figure S2 shows 1H NMR spectra of GSSG and GSH highlighting the unique peak from GSH.
Figure S3 shows overlaid portions of 1H NMR spectra from fresh and frozen blood.
Figure S4 shows 1H NMR spectra of GSH with and without bubbling with O2 gas.
Figure S5 shows portions of 1H-1H COSY spectrum of GSH after derivatizing with NEM.
Figure S6 shows 2D HSQC and HMBC spectra of GSH after derivatizing with NEM.
Figure S7 shows portions of 1H NMR spectra of GSSG, NEM, and their mixture.
Figure S8 shows 1H NMR spectra of a blood with or without NEM/ GSH and GSSG spiking.
Figure S9 shows portions of 1H NMR spectra with highlighting the hydrolysis of NEM.
Figure S10 shows portions of 1H NMR spectra of blood with highlighting the hydrolysis of NEM.
Figure S11 shows data with highlighting attenuation of GSSG peaks by ‘cpmgpr’ pulse sequence.