Abstract
Background
Recent indirect evidence of Severe Acute Respiratory Syndrome Coronavirus 2 (SARS-CoV-2) transmission during endoscopic endonasal procedures has highlighted the dearth of knowledge surrounding aerosol generation with these procedures. As we adapt to function in the era of Coronavirus Disease 2019 (COVID-19) a better understanding of how surgical techniques generate potentially infectious aerosolized particles will enhance the safety of operating room (OR) staff and learners.
Objective
To provide greater understanding of possible SARS-CoV-2 exposure risk during endonasal surgeries by quantifying increases in airborne particle concentrations during endoscopic sinonasal surgery.
Methods
Aerosol concentrations were measured during live-patient endoscopic endonasal surgeries in ORs with an optical particle sizer. Measurements were taken throughout the procedure at six time points: 1) before patient entered the OR, 2) before pre-incision timeout during OR setup, 3) during cold instrumentation with suction, 4) during microdebrider use, 5) during drill use and, 6) at the end of the case prior to extubation. Measurements were taken at three different OR position: surgeon, circulating nurse, and anesthesia provider.
Results
Significant increases in airborne particle concentration were measured at the surgeon position with both the microdebrider (p = 0.001) and drill (p = 0.001), but not for cold instrumentation with suction (p = 0.340). Particle concentration did not significantly increase at the anesthesia position or the circulator position with any form of instrumentation. Overall, the surgeon position had a mean increase in particle concentration of 2445 particles/ft3 (95% CI 881 to 3955; p = 0.001) during drill use and 1825 particles/ft3 (95% CI 641 to 3009; p = 0.001) during microdebrider use.
Conclusion
Drilling and microdebrider use during endonasal surgery in a standard operating room is associated with a significant increase in airborne particle concentrations. Fortunately, this increase in aerosol concentration is localized to the area of the operating surgeon, with no detectable increase in aerosol particles at other OR positions.
Keywords: COVID-19, airborne particles, aerosolization, SARS-CoV-2, endoscopic sinus surgery
Introduction
The global Severe Acute Respiratory Syndrome Coronavirus 2 (SARS-CoV-2) pandemic has strained resources and personnel in hospitals worldwide. This global pandemic has challenged hospitals to significantly alter everyday hospital operations in efforts to mitigate the spread of the virus.1–3 As hospitals re-open and allow elective cases, not only will testing be crucial, but the high false negative rate of nasopharyngeal swabs 4 , 5 necessitates identification of high-risk events. Understanding which procedures are high-risk will be crucial in limiting the spread of the virus and maintaining the safety of healthcare providers. Information regarding transmission of this novel coronavirus between hospital staff and patients continues to evolve. An initial anecdotal report by Patel et al. 2020 expressed concern for direct transmission between healthcare workers following endonasal procedures. 6 The details of the documented concerns in this report have since been clarified, however the potential threat of infection of healthcare workers from aerosolized viral particles during endoscopic sinonasal procedures remains.6–8
Aerosol generating procedures (AGPs), which commonly include positive pressure ventilation, endotracheal suction, nebulizer treatment, and bronchoscopy, can expose health care workers to viral and bacterial pathogens. While AGP designation for specific procedures varies by organization, generally manipulation of the upper or lower airway qualifies the procedure as an AGP. 9 , 10 Recent cadaveric simulations published by Workman et al. 2020 documented aerosol generation during use of powered instrumentation in a laboratory study using cadavers. 11 , 12 Specifically they saw an increase in particles in the 1 to 10 micron range. 11 Their simulations suggest a potential exposure to aerosolized particles and droplets during endonasal instrumentation but do not account for bleeding, endotracheal intubation, and the specialized airflow of the OR. 11 , 12
In order to ensure the safety of hosptial staff, surgeons, and patients, a more concrete understanding of aerosol particle generation during modern endoscopic endonasal surgery in the operating room is needed. This understanding will help further the discussion about what are the appropriate protocols regarding environmental controls and personal protective equipment (PPE). Our study builds on the findings of the Workman et al. 2020 studies by measuring airborne particle (1–10µm in diameter) concentrations during live patient procedures in standard operating rooms. This study furthers our understanding of the potential exposure risks to operating room staff, surgeons, learners, and anesthesia staff as hospitals increase their operational capacity.
Methods
Study Design
IRB exemption was obtained for this study; no patient information was collected. Aerosolized particle concentrations were measured during endoscopic nasal and skull base surgeries performed on COVID-19 negative patients in standard operating rooms at the University of North Carolina Hospital. Airborne particle concentrations were measured in particle number per cubic foot with a National Institute of Standards-calibrated optical particle sizer (OPS), the Extech VPC300 Particle Counter (FLIR Commercial Systems Inc.). The device was set to measure airborne particles of the following sizes, 0.3, 0.5, 1.0, 2.5, 5.0, and 10.0 microns over a 20 second sampling interval. A total of one hundred and thirty-three measurements of all particle sizes were taken at the various timepoints during five independent surgeries: three skull base tumors, one orbital abscess, and one functional endoscopic sinus surgery.
Data Collection
Air particle measurements were collected sequentially at 3 different operating room positions in the following order: 1) the operating surgeon position, 2) the circulating nurse position, and 3) the anesthesia provider position. Aerosol concentration measurements were taken at 6 different time points throughout the case: 1) before patient entered the OR, 2) before pre-incision timeout, 3) during cold instrumentation with suction, 4) during microdebrider use, 5) during drill use, 6) at the end of the case prior to extubation. For each surgery either, the S2 Stryker drill set to 50,000 rpm or Medtronic Straightshot M5 with 70-degree pineapple burr set to 30,000 rpm was used. The Straightshot M5 microdebrider set to 5,000 rpm was used for debridement with the Medtronic Fusion Compact image guidance system.
Aerosolized water from the internal irrigation system within the microdebrider was tested to uncover any potential confounding effect on measured aerosol concentrations. Ex vivo microdebrider testing included turning on the microdebrider with irrigation and suction (normal operating conditions), and aerosol concentrations were subsequently measured at the operator position at 5, 15, 30, 45, and 60 second intervals. Ex vivo microdebrider measurements were compared to pre-procedure aerosol measurements at the operator position.
Statistical Analysis
Descriptive statistics were calculated for total particle concentration (cumulative between 0.3 and 10.0 µm) at different timepoints during the surgery. Changes in mean particle concentration were summarized for both instrument type and operating room (OR) personnel (surgeon, circulator, anesthesia). Sidak correction for multiple comparisons was used to estimate the mean and 95% CI for particle concentration before and during surgical instrumentation for different OR personnel. A significance level of p < 0.05 was used for all testing. Analysis was conducted using Prism 8 (GraphPad; La Jolla, CA).
Results
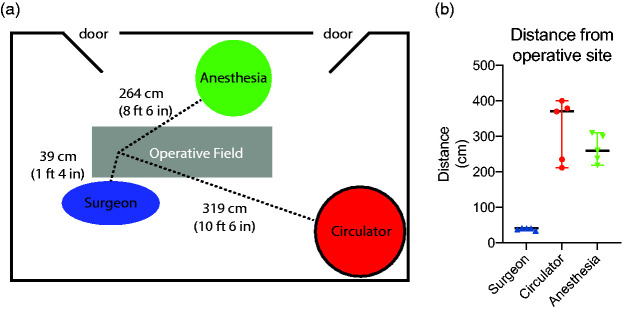
Average distances for each OR position from the surgical field (nasal tip) were 0.39 m for the surgeon position, 3.40 m for the circulating nurse position, and 2.72 m for the anesthesia provider (Figure 1(A) and (B)).
Figure 1.
Distance from operative field (nasal tip) to the surgeon, anesthesia, or circulator position. (a) Schematic of standard operating room layout. Surgeon position was an average of 39 cm from the nasal tip. Anesthesia position was an average of 264 cm from the nasal tip and the circulator workstation position was an average of 319 cm from the field. (b) The range for the surgeon position was 34 cm to 42 cm. The range for the circulator position was 212 cm to 400 cm and the range for the anesthesia position was 219 to 310 cm depending on the specific operating room that the case occurred.
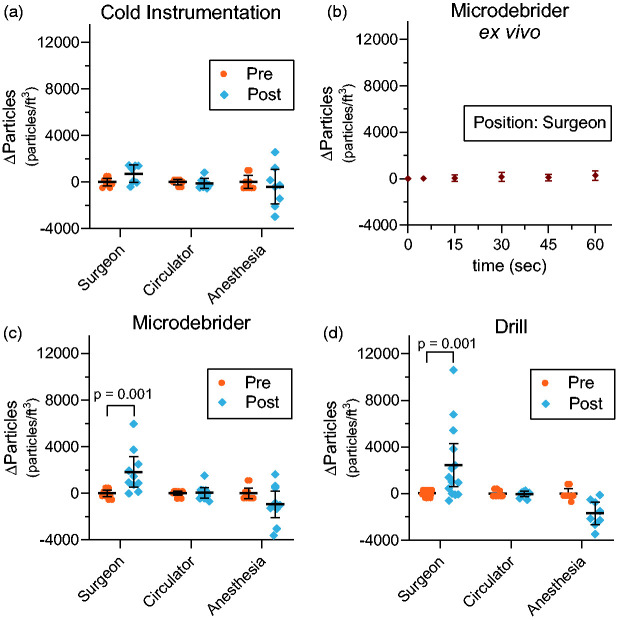
The mean change in particle concentrations (Δ particles) compared to pre-instrumentation levels during cold instrumentation with suction demonstrated an increase of 716 p/ft3 at the surgeon position (p = 0.34), a decrease of 112 p/ft3 at the circulator workstation position (p = 0.99), and a decrease of 398 p/ft3 at the anesthesia provider position (p = 0.76; Figure 2(A)). Increasing durations of ex vivo microdebrider use, conducted at the operator position demonstrated comparable aerosol concentrations when compared to pre-procedure aerosol concentrations at the operator position at 5, 15, 30, 45, and 60 seconds of use (Figure 2(B)). When used in surgical patients, the mean change in particle concentration (Δ particles) following microdebrider use demonstrated an increase of 1825 p/ft3 at the surgeon position (p = 0.001), an increase of 40 p/ft3 at the circulator workstation position (p = 0.99), and a decrease of 935 p/ft3 at the anesthesia provider position (p = 0.16; Figure 2(B)). The change in particle concentration (Δ particles) after drill use demonstrated an increase of 2418p/ft3 at the surgeon position (p = 0.001), a decrease of 34 p/ft3 at the circulator workstation position (p>.99), and a decrease of 1690 p/ft3 at the anesthesia provider position (p = 0.13; Figure 2(C)).
Figure 2.
Changes in mean particle concentration particles/ft3 (p/ft3) exposure for different OR personnel before and after surgical instrument. All pre-instrumentation values normalized to zero to illustrate changes in concentration. (a) The mean difference in particle concentration before and after cold instrumentation with suction was 716 p/ft3 at the surgeon position, −112 p/ft3 at the circulator workstation position, and –398 p/ft3 at the anesthesia provider position. (b) Ex vivo aerosol concentrations measured after progressively longer durations of use, demonstrated comparable aerosol concentrations when compared at the operator position. (c) The mean difference in particle concentration before and after microdebrider use was 1825 (p = 0.001) at the surgeon position, 40 p/ft3 at the circulator workstation position, and −935 p/ft3 at the anesthesia provider position. (d) The mean difference in particle concentration before and after drill use was 2418 p/ft3 (p = 0.001) at the surgeon position, –34 p/ft3 at the circulator workstation position, and −1690 p/ft3 at the anesthesia provider position. 95% confidence intervals designated by black bars.
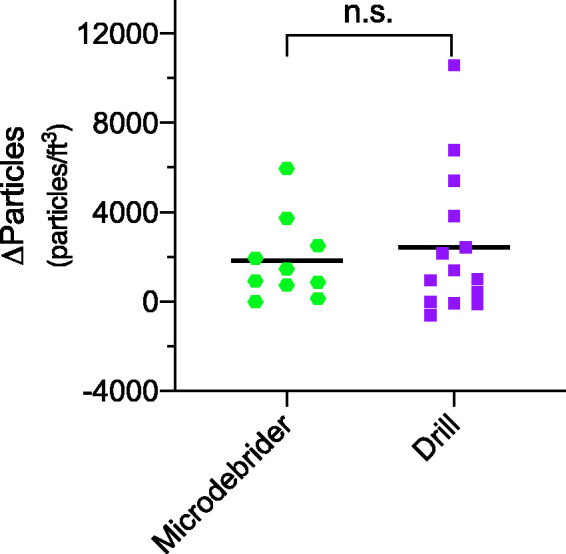
Direct comparison of aerosol concentrations during microdebrider use (1825 particles/ft3 (95% CI 508 to 3141) and drill use (2445 particles/ft3 (95% CI 595 to 4294) did not demonstrate a significant difference (p = 0.59; Figure 3).
Figure 3.

Difference in mean particle concentrations during drill use compared to microdebrider use. No significant difference (p = 0.59) found in mean aerosol concentration for the microdebrider at 1825 particles/ft3 (95% CI 508 to 3141) compared to the mean aerosol concentration for the drill at 2445 particles/ft3 (95% CI 595 to 4294).
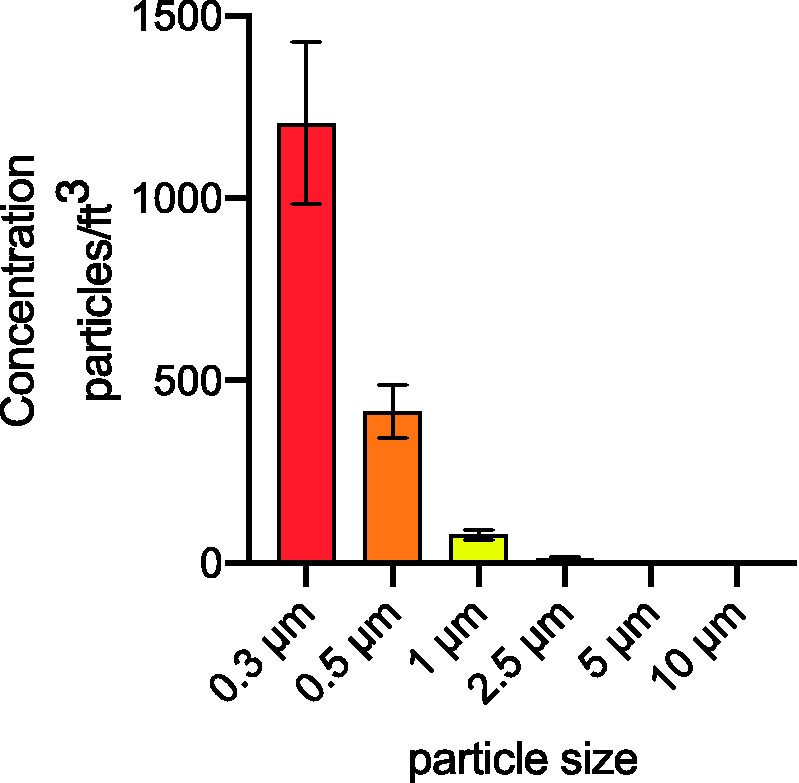
A combined total of 133 sampling measurements were taken between all OR positions. Combining all 133 sampling events, over 99% of all measured airborne particles were size 1.0 µm or less with 70.3% of total particulate measured to be 0.3 µm in size and 24.2% as 0.5 µm in size (Figure 4).
Figure 4.

Distribution of mean particle concentration by measured particle size. Total of 133 sample measurements were taken with a mean of 1205 particles measuring 0.3 µm in diameter, 414 particles at 0.5 µm in diameter, 78 particles at 1.0 µm in diameter, 12 particles at 2.5 µm in diameter, 2 particles at 5.0 µm in diameter, and a mean of 1 particle at 10 µm in diameter.
Discussion
The highly transmissible SARS-CoV-2 virus has led to renewed focus on modes of iatrogenic viral transmission. In the rapidly evolving climate of COVID-19, otolaryngologists need to manage exposure risk during upper airway procedures. Our understanding of airborne particle generation during endoscopic surgery is evolving; however, it is reasonable to assume that aerosolized particles in SARS-CoV-2 positive patients during such procedures may contain viral particles. 13 , 14 Workman et al. have shown evidence for particle generation at the droplet (30-100µm) and airborne (1-10µm) size during endonasal instrumentation using cadaveric models in a laboratory. 11 , 12
On electron microscopy, SARS-CoV-2 is estimated to be 65–125 nm in diameter. 15 It is currently unknown how many viral particles are needed for infection; however, some evidence suggests that disease severity correlates with increased viral exposure. 14 , 16 Droplet nuclei can arise after the partial evaporation of larger airborne particles, and can remain suspended in the air for significant periods of time, allowing them to be transmitted over distances >1 m. 17,18 Recent findings by Liu et al. describe SARS-CoV-2 genetic material in aerosols sample in two Wuhan hospitals, suggesting the possibility for airborne transmission. 19 In light of these findings, the iatrogenic generation of airborne sized particles 0.3 to 1.0 µm during powered instrumentation of the nasal airway is cause for concern and it is therefore, reasonable to assume airborne precautions during endonasal procedures. Currently the CDC guidelines regarding AGPs states all OR staff should wear an “N95 or higher-level respirator such as disposable filtering facepiece respirators, powered air purifying respirator (PAPRs), and elastomeric respirators, eye protection, gloves, and a gown.” 10
Continued investigation of aerosol generation during powered endonasal instrumentation is warranted, however, the observed changes in aerosol concentrations in this study provide evidence supporting this proposed phenomenon. The size distribution of particles showed a vast majority measuring at ≤1 µm, this may suggest a distinct process during the interaction of powered instrumentation with nasal mucosa. Or simply, that particles of larger mass may be less frequently ejected from the nose and with a trajectory more influenced by gravity, lending to less frequent detection with a narrow range optical particle sizer.
We have demonstrated aerosol particle generation during powered instrumentation of the sinonasal cavity in surgery, with live patients, in operating rooms meeting standard air circulation requirements. However, the provided data suggests that these particles are focal and do not significantly diffuse through the entire operating room. The observed increases in airborne particle concentrations solely at the surgeon position should reassure the rest of the operating room staff that they are at nominal risk of infection via aerosolized particles. Additional, confirmatory data may help reduce the use of PPE by the entire surgical team. These results vary slightly from those of Workman et al, which did not report significant generation of airborne particles with microdebrider use. Differences between the findings described by Workman et al. and those in this study, may be attributed to differences in sampling environments. Compared to cadaveric simulation in the laboratory setting, our sample measurements were obtained in the operative environment during instrumentation of perfused mucosa with relatively normal nasal architecture, temperature and airflow. Additionally, our investigation did not show a significant difference in particle concentrations using cold instrumentation and suction.
There are several important limitations in this study worth noting. The Extech VPC300 Particle Counter has an optic sensor that is limited to the detection of particles within the size range 0.3-10µm, it also does not differentiate the particle composition and therefore may detect other particulate in the air, not generated by the patient (i.e. dust). However, it seems unlikely that a drill or a microdebrider in a patients’ sinonasal cavity is increasing measurable particulate in the room not related to the surgery itself. Additionally, airborne particles are very dynamic and can change as doors are opened and personnel and equipment move around the room. The localized particle effect described in this study quantifies aerosol concentrations at distinct positions, and therefore is limited in describing exposure risk to OR staff who move about freely in the OR, such as the nurse circulator. Additionally, high levels of staff activity, and proximity to the entry way may explain the variability in measured particle concentrations for the anesthesia position. All measurement samples were collected in 20 second intervals at a single position, providing only a snapshot of particle concentrations in the operating room.
Conclusion
Our study supports a recent growing body of evidence that the use of powered instrumentation during endonasal procedures increases aerosolized particles. However, the increases in particle concentrations were only observed at the operating surgeon position with no increase in aerosol concentrations measured around other OR staff positions. These findings suggest a localized particle effect during the use of powered endonasal instrumentation.
Footnotes
Declaration of Conflicting Interests: The author(s) declared no potential conflicts of interest with respect to the research, authorship, and/or publication of this article.
Funding: The author(s) disclosed receipt of the following financial support for the research, authorship, and/or publication of this article: The project described was supported by NIH grants KL2TR002490 to AJK and the Howard Holderness Distinguished Medical Scholars program and Pillsbury Medical Student Research Fellowship Grants. The content is solely the responsibility of the authors and does not necessarily represent the official views of the NIH. No authors have any financial conflicts of interest.
ORCID iDs: Alex Murr https://orcid.org/0000-0003-1102-9477
William Colby Brown https://orcid.org/0000-0002-5305-1210
References
- 1.Livingston E, Desai A, Berkwits M. Sourcing personal protective equipment during the COVID-19 pandemic. JAMA. 2020; 323(19):1912–1914. [DOI] [PubMed] [Google Scholar]
- 2.Indolfi C, Spaccarotella C. The outbreak of COVID-19 in Italy. JACC Case Rep. 2020; 2(9):1414–1418. [DOI] [PMC free article] [PubMed] [Google Scholar]
- 3.Nacoti M, Ciocca A, Giupponi A. At the epicenter of the Covid-19 pandemic and humanitarian crises in Italy: changing perspectives on preparation and mitigation. NEJM Catal Innov Care Deliv. 2020; 1(2). [Google Scholar]
- 4.Abbasi J. The promise and peril of antibody testing for COVID-19. JAMA. 2020; 323(19):1881–1883. [DOI] [PubMed] [Google Scholar]
- 5.Tahamtan A, Ardebili A. Real-time RT-PCR in COVID-19 detection: issues affecting the results. Expert Rev Mol Diagn. 2020; 20(5):453–454. [DOI] [PMC free article] [PubMed] [Google Scholar]
- 6.Patel ZM, Fernandez-Miranda J, Hwang PH, et al. Letter: precautions for endoscopic transnasal skull base surgery during the COVID-19 pandemic. Neurosurgery. 2020; 87(1):E66–E67. [DOI] [PMC free article] [PubMed] [Google Scholar]
- 7.Huang X, Zhu W, Zhao H, et al. In reply: precautions for endoscopic transnasal skull base surgery during the COVID-19 pandemic. Neurosurgery. 2020; 87(2):E160–E161. [DOI] [PMC free article] [PubMed] [Google Scholar]
- 8.Europe’s doctors face same pitfalls as China’s, say Wuhan medics. Bloomberg. March 17, 2020. https://www.bloomberg.com/news/articles/2020-03-17/europe-s-doctors-getting-sick-like-in-wuhan-chinese-doctors-say
- 9.Tran K, Cimon K, Severn M, et al. Aerosol generating procedures and risk of transmission of acute respiratory infections to healthcare workers: a systematic review. PLoS One. 2012; 7(4):e35797. [DOI] [PMC free article] [PubMed] [Google Scholar]
- 10.Interim U.S. Guidance for risk assessment and work restrictions for healthcare personnel with potential exposure to COVID-19 | CDC. https://www.cdc.gov/coronavirus/2019-ncov/hcp/guidance-risk-assesment-hcp.html. Updated June 18, 2020. Accessed May 28, 2020.
- 11.Workman MA, Jafari A, Bradley Welling D, et al. Airborne aerosol generation during endonasal procedures in the era of COVID-1 19: risks and recommendations. Otolaryngol Head Neck Surg. 2020;163(3):465--470. doi:10.1177/0194599820931805. [DOI] [PMC free article] [PubMed]
- 12.Workman AD, Welling DB, Carter BS, et al. Endonasal instrumentation and aerosolization risk in the era of COVID-19: simulation, literature review, and proposed mitigation strategies. Int Forum Allergy Rhinol. 2020; 10(7):798–805. [DOI] [PubMed] [Google Scholar]
- 13.Mick P, Murphy R. Aerosol-generating otolaryngology procedures and the need for enhanced PPE during the COVID-19 pandemic: a literature review. J Otolaryngol Head Neck Surg. 2020; 49(1):29. [DOI] [PMC free article] [PubMed] [Google Scholar]
- 14.Zheng S, Fan J, Yu F, et al. Viral load dynamics and disease severity in patients infected with SARS-CoV-2 in Zhejiang province, China, January–March 2020: retrospective cohort study. BMJ. 2020; 369:m1443. [DOI] [PMC free article] [PubMed] [Google Scholar]
- 15.Shereen MA, Khan S, Kazmi A, Bashir N, Siddique R. COVID-19 infection: origin, transmission, and characteristics of human coronaviruses. J Adv Res. 2020; 24:91–98. [DOI] [PMC free article] [PubMed] [Google Scholar]
- 16.Liu Y, Yan LM, Wan L, et al. Viral dynamics in mild and severe cases of COVID-19. Lancet Infect Dis. 2020; 20(6):656–657. [DOI] [PMC free article] [PubMed] [Google Scholar]
- 17.Roy CJ, Milton DK. Airborne Transmission of Communicable Infection - The Elusive Pathway. N Engl J Med. 2004;350:1710--1712. [DOI] [PubMed] [Google Scholar]
- 18.WHO Guidelines. Infection prevention and control of epidemic-and pandemic-prone acute respiratory infections in health care. www.who.int/about/licensing/copyright_form/en/index.html. Published 2014. Accessed July 27, 2020. [PubMed]
- 19.Liu Y, Ning Z, Chen Y, et al. Aerodynamic analysis of SARS-CoV-2 in two Wuhan hospitals. Nature. 2020; 582(7813):557–560. [DOI] [PubMed] [Google Scholar]


