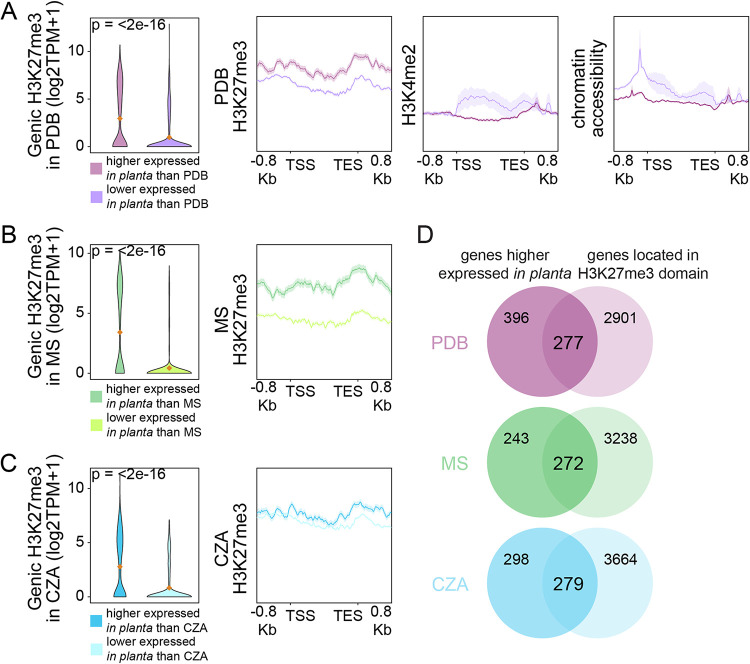
FIG 5.
In planta-induced genes are H3K27me3 associated under transcriptionally repressive conditions. (A to C) Violin plots displaying input-corrected H3K27me3 ChIP signals over genes differentially expressed between in planta and 6 days of cultivation in potato dextrose broth (PDB) (A), half-strength Murashige-Skoog medium (MS) (B), and Czapek-Dox medium (CZA) (C). Mean values are indicated by orange diamonds. Line plots display average coverages of chromatin features over the gene sets. (D) Overlap of genes that are more highly expressed in planta than in PDB, MS, or CZA with genes located in an H3K27me3 domain in the corresponding growth medium. Significant differences in H3K27me3 coverage were determined by the one-sample Wilcoxon signed-rank test (*, P ≤ 0.05).

