Abstract
Background
Experimental autoimmune encephalomyelitis (EAE) is a common animal model of multiple sclerosis (MS). C57BL/6 mice immunized with myelin oligodendrocyte glycoprotein exhibit chronic disease course, together with optic neuritis, consisting of demyelination/axonal loss of the optic nerve.
Objectives
To characterize functional and structural visual damages in two different phases of EAE: pre- and post-motor onset.
Methods
Visual alterations were detected with Visual Evoked Potential (VEP), Electroretinogram (ERG) and Optical Coherence Tomography (OCT). Optic nerve histology was performed at 7 (pre-motor onset) or 37 (post-motor onset) days post-immunization (dpi).
Results
At 7 dpi, optic nerve inflammation was similar in EAE eyes with and without VEP latency delay. Demyelination was detected in EAE eyes with latency delay (p < 0.0001), while axonal loss (p < 0.0001) and ERG b-wave amplitude (p = 0.004) were decreased in EAE eyes without latency delay compared to Healthy controls. At 37 dpi, functional and structural optic nerve damage were comparable between EAE groups, while a decrease of ERG amplitude and NGCC thickness were found in EAE eyes with VEP latency delay detected post-motor onset.
Conclusions
Thanks to non-invasive methods, we studied the visual system in a MS model, which could be useful for developing specific therapeutic strategies to target different disease phases.
Keywords: Experimental autoimmune encephalomyelitis, visual system, visual evoked potential, electroretinogram, optical coherence tomography
Introduction
Multiple sclerosis (MS) is an inflammatory-demyelinating autoimmune disease of the central nervous system (CNS) mediated by immune cells targeting myelin sheaths that surround nerve axons. 1 Optic nerves are vulnerable to immunologic attack in MS, particularly in early stages of the disease; indeed about 20% of MS patients have a clinical presentation that starts with optic neuritis (ON). 2 ON is caused by inflammatory attacks in optic nerve and retina, resulting in demyelination, axonal damage, retinal nerve fiber layer thinning and retinal ganglion cells (RGCs) death. 3 Considering that the mechanisms that trigger and drive MS are not completely understood and little is known about the utility of visual field in monitoring the course of MS, 4 animal models are necessary to unravel these issues. The most known preclinical model of MS is the Experimental Autoimmune Encephalomyelitis (EAE) that is induced through injection of myelin oligodendrocyte glycoprotein peptides (MOG35–55). 5 Immunized C57BL/6 mice develop a chronic disease in which motor disability onset is generally around 14 dpi and ON is often detected. 6 It has been reported that in the optic nerve, where the volume to surface ratio of myelin is quite low, MOG expression is increased compared to other proteins such as proteolipid protein (PLP), which is concentrated on the compact myelin. 7 Functional damage of the anterior visual system can be detected with Visual Evoked Potential (VEP) and Electroretinogram (ERG), while Optical Coherence Tomography (OCT) is used to evaluate structural retinal alterations. 8 VEPs are electrical signals generated in the visual cortex in response to visual stimuli. 9 VEP recording on animal models is usually performed with invasive methods that need the use of needle or implanted electrodes.10–14 Our group developed a non-invasive approach that takes advantage of epidermal electrodes to evaluate the optic nerve function without surgical procedures.15,16 In this study, we monitored ON in EAE mice through non-invasive VEP recording, since VEP latency delay is a reliable biomarker of demyelination. 10 Moreover, in order to study RGC activity, we acquired photopic electroretinogram (pERG), since ERG is useful to assess functional retina integrity 17 using non-invasive corneal electrodes. 18 In particular, amplitude of two pERG components, the b-wave 19 and PhNR, 20 reflects the activity of Müller/bipolar cells 21 and RGCs, respectively. The loss of vision after an episode of ON seems proportional to the number of functional RGCs. 22 Finally, we performed OCT to characterize morphological changes in retinal layers of EAE mice. OCT technology is increasingly being used in preclinical settings, enabling cross-sectional imaging of tissue microstructure in real-time. 23 Therefore, using non-invasive methods, such as VEP, pERG and OCT, we investigated functional and structural alterations in the anterior visual pathways of EAE mice. This work adds new data regarding ON occurring in the main preclinical model of MS, which could be useful to develop specific treatments for different disease stages, with the final goal of ameliorating the life condition of MS patients.
Methods
Animals
Female C57BL/6 mice (n = 59) aged 6–8 weeks were used. 18 mice were left untouched and considered as Healthy controls, whereas 41 mice were immunized (EAE). To monitor the visual damage occurring in EAE, 18 EAE mice were studied during pre-motor onset experiment (0–7 dpi) and 23 EAE mice were followed during post-motor onset experiment (0–37 dpi). Mice were housed under a controlled 12 h/12h light/dark cycle, with free access to chow pellets and tap water. This study was conducted in accordance with the European Community guidelines (Directive 2010/63/EU) and approved by the San Raffaele Institutional Animal Care and Use Committee (IACUC).
EAE induction
Mice were immunized with subcutaneous injection at the base of the tail with 300 µl PBS containing 200 µg of myelin oligodendrocyte glycoprotein peptide (MOG35–55; Espikem, Florence, Italy) in incomplete Freund’s adjuvant (IFA; Sigma Aldrich, Milan, Italy) containing 4 mg/mL Mycobacterium tuberculosis (strain H37Ra; Difco Laboratories Inc., Franklin Lakes, NJ, USA) to obtain CFA. Pertussis toxin (Sigma; 500 ng) was injected intraperitoneally on the day of the immunization and two days later.
VEP recording
Non-invasive epidermal VEPs were recorded using a 6 mm Ø Ag/AgCl cup electrode placed on the shaved scalp over V1, contralateral to the stimulated eye (1 mm anterior to interaural line and 2.5 mm contralateral to stimulation) and a needle electrode was inserted in the nose for reference. The cup was fixed with electro-conductive adhesive paste and at the end of first eye recording, it was placed on the opposite hemisphere, as described previously. 15 Mice were intraperitoneally anesthetized (80 mg/kg ketamine, 10 mg/kg xylazine) and adequate level of anesthesia was verified by checking for the presence of tail-pinching reflex. Body temperature was maintained at 36.5 ± 0.5°C by a homeothermic blanket system with a rectal thermometer probe. Both eyes were dilated with 1% tropicamide and protected using ophthalmic gel. Before recording procedures, mice were placed in a dark room and allowed to adapt to darkness for 5 minutes. For each VEP recording session, 3 trains of 20 flash stimuli (with 260 mJ intensity, 10 µs duration and 1 Hz frequency) were delivered with a flash photostimulator (Micromed, Mogliano Veneto, Italy) placed at 15 cm from the stimulated eye.
VEP analysis
VEPs were acquired and measured offline by Micromed System Plus Evolution software at a sampling frequency of 4096 Hz (bandpass-filtered 0.16–1024), coded with 16 bits and bandpass-filtered (5–100 Hz) and notch filtered (50 Hz). Visual identification allowed latency measurement of the first negative peak (N1). In order to compare eyes and avoid physiological differences between different mice, data were normalized on baseline and expressed in percentage of change (%). In addition, all EAE eyes were stratified according to a latency cutoff value (% change). In pre-motor onset experiment, cutoff value was calculated on latency change (expressed in % of the baseline) of Healthy eyes between baseline and 7 dpi. Regarding post-motor onset experiment, cutoff value was calculated using latency change of each Healthy eye between baseline and every time point. Thus, all values (expressed in %) were averaged to find a single cutoff. Below the cutoff formula
Therefore, in the study of visual pathway alterations in the pre-motor experiment, eyes with percentage of latency change over cutoff were defined “EAE eyes with latency delay (EAE W LD)”, while eyes with percentage of latency change under cutoff were defined “EAE eyes without latency delay (EAE W/O LD)”. In the post-motor onset experiment, EAE eyes were divided into “EAE eyes with early optic neuritis (EAE EON)” and “EAE eyes with late optic neuritis (EAE LON)”.
Photopic ERG recording
PERGs were recorded after 10 min of light adaptation under intraperitoneal anaesthesia (80 mg/kg ketamine, 10 mg/kg xylazine). Pupils were dilated with 1% tropicamide and moisturized with ophthalmic gel (2% hydroxypropylmethylcellulose) to avoid eye drying. Body temperature was maintained with a homeothermic blanket system at 36.5 ± 0.5°C. PERG was recorded in one eye at a time using a corneal electrode connected via flexible cables to a Micromed amplifier. Each session included 3 trains of 10 flash stimuli (with 130 mJ intensity, 10 µs duration and 0.5 Hz frequency).
Photopic ERG analysis
PERGs were acquired with Micromed System Plus Evolution at a sampling frequency of 4096 Hz (bandpass-filtered 0.16–1024), coded with 16 bits, bandpass-filtered (5–100 Hz), and notch filtered (50 Hz). PERGs were analyzed offline and both b-wave and PhNR amplitudes were measured from baseline to their respective peaks.
Optical coherence tomography
Mice underwent bilateral circular peripapillary scans with a Micron IV Image-Guided OCT for rodents (Phoenix Research Labs; Pleasanton, CA, USA). Mice underwent intraperitoneal anaesthesia (80 mg/kg ketamine, 10 mg/kg xylazine), then pupils were dilated with 1% tropicamide and ophthalmic gel (2% hydroxypropylmethylcellulose) was applied frequently to the cornea to prevent dehydration and to reduce frictions between OCT lens and the eye. Circular scans were centered at optic nerve head and acquired from both eyes with a diameter of 1085 µm. Every circular scan was averaged from 5 B scans (each with 1024 A-scans) with an axial resolution of 1.2 µm. The acquired images were examined for quality control as suggested by OSCAR-IB guideline.24,25In-house automatic segmentation software written with MATLAB (Mathworks, Natick, MA, USA) was used to separate the neuronal ganglion cell complex (NGCC), which was the sum of retinal nerve fiber layer (RNFL), ganglion cell layer (GCL) and inner plexiform layer (IPL). To minimize the influence of respiratory movements, the analysis was performed averaging three images acquired consecutively.
Tissue preparation and histology
Optic nerves from mice sacrificed at 7 or 37 dpi were fixed in 4% paraformaldehyde overnight and then embedded in paraffin. Longitudinal optic nerve sections 8 µm thick were obtained. To investigate demyelination, axonal loss and microglia/macrophage cells, the optic nerve sections were stained with Luxol Fast Blue (LFB), SMI 312 and Iba 1, respectively. Demyelination and axonal loss were quantified as a percentage of damaged area on the whole optic nerve section, as previously reported, 26 using the following formula:
For inflammation, Iba 1+ cells were counted and normalized on mm2. All histological analyses were performed with ImageJ software. Results were obtained averaging three consecutive optic nerve sections.
Statistical analysis
Normality of data was visually inspected and tested using Shapiro test. Spearman correlation coefficient was used to calculate possible correlations between VEP latency change and histology. Correlations were considered significant when p < 0.05. To model longitudinal changes in VEP, ERG, OCT and histological parameters in the three groups, generalized estimating equation (GEE) models were used with an exchangeable working correlation structure to account for correlation between the two eyes from a single mouse, with the covariance matrix gauged via an iterative jackknife resampling method. Statistical differences were considered significant when p < 0.01.
Results
Visual pathway alteration in EAE pre-motor onset experiment
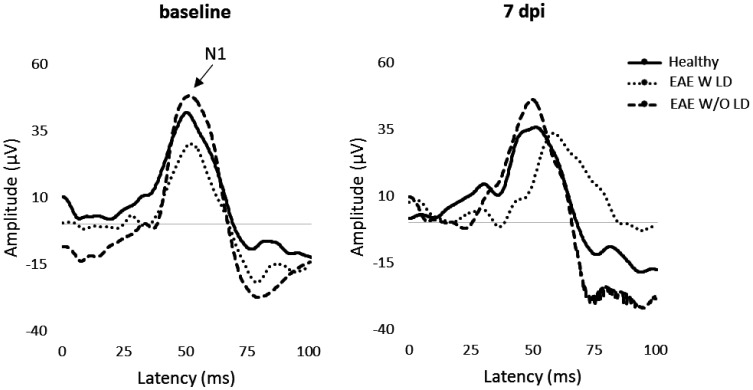
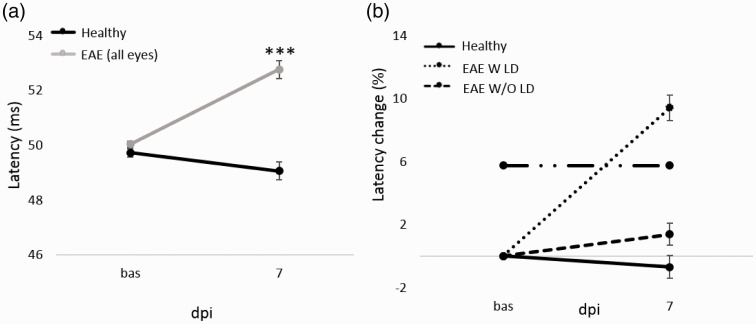
The first experiment was focused on ON in EAE pre-motor onset phase. In particular, VEPs were performed at baseline and 7 dpi (Figure 1). All EAE eyes showed a significant increase of latency compared to Healthy (p < 0.0001; Table 1. Figure 2(a)). Cutoff value was set at 5.76% and EAE W LD showed an increase of 9.41%, while EAE W/O LD presented an increase of 1.37% compared to baseline (Figure 2(b)). At 7 dpi, the proportion of EAE W LD was 53% (19/36 eyes) and 47% for EAE W/O LD (17/36 eyes).
Figure 1.
Representative VEP waveforms at baseline and 7 dpi.
Table 1.
VEP data and statistical analysis in pre-motor onset study.
| Group | Latency (ms) |
||
|---|---|---|---|
| Baseline | 7 dpi | ||
| Healthy | average | 49.73 | 49.06 |
| standard error | 0.15 | 0.33 | |
| EAE (all eyes) | average | 50.04 | 52.76 |
| standard error | 0.11 | 0.32 | |
| EAE W LD | average | 49.84 | 54.42 |
| standard error | 0.09 | 0.37 | |
| EAE W/O LD | average | 50.17 | 50.81 |
| standard error | 0.11 | 0.33 | |
| p value | Healthy vs EAE (all eyes) | 0.12 | <0.0001 |
Figure 2.
VEP latency and VEP latency change (%) from baseline to 7 dpi. (a): VEP latency (ms) at baseline and 7 dpi in Healthy (n = 20 eyes) and EAE (n = 26 eyes). Pairwise comparisons of predicted marginal means were performed according to the concept of least‑squares means (***p < 0.0001). Error bars represent the SE. (b) VEP latency change (%) from baseline to 7 dpi in Healthy (n = 20 eyes), EAE W LD (n = 19 eyes) and EAE W/O LD (17 eyes). Dashed-dot line represents the cutoff value set at 5.76%. Error bars represent the SEM.
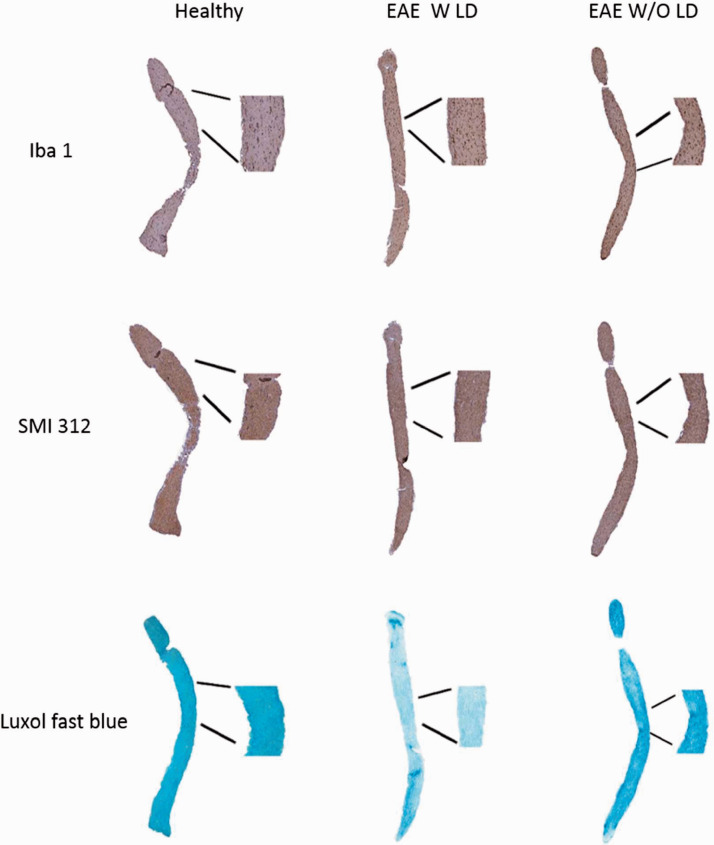
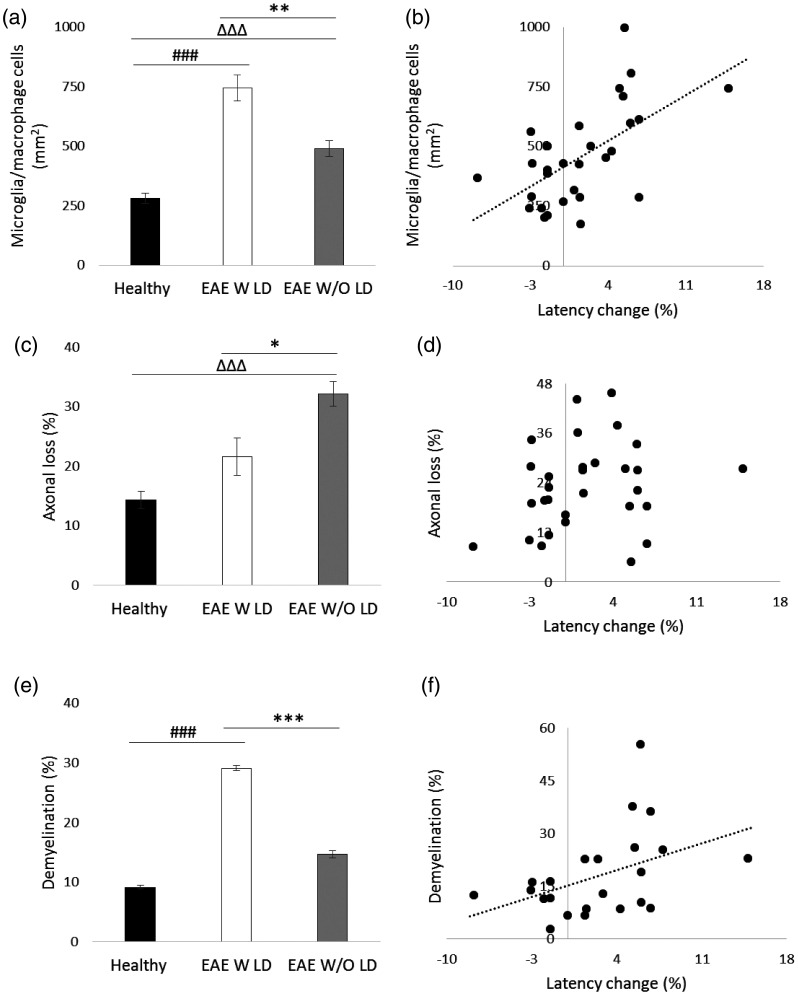
Optic nerve histology was performed (Figure 3) to validate VEP results. Iba 1+ cell count showed a significant increase of microglia/macrophage cells in both EAE groups compared to Healthy (EAE W LD: p < 0.0001; EAE W/O LD: p < 0.0001). Moreover, a significant difference was found between the two EAE groups (p = 0.0002; Figure 4(a)) and there was a positive correlation between the VEP latency change and Iba 1+ cell count (r = 0.574, p = 0.001; Figure 4(b)). Regarding SMI staining, a significant axonal loss was observed in EAE W/O LD compared to both Healthy (p < 0.0001) and EAE W LD (p = 0.008. Figure 4(c)). However, the correlation between VEP latency change and axonal loss was not significant (r = 0.179, p = 0.343; Figure 4(d)). LFB staining showed a significant increase of demyelination in EAE W LD compared to both Healthy (p < 0.0001) and EAE W/O LD (p < 0.0001; Figure 4(e)), while a positive correlation between VEP latency change and demyelination was found (r = 0.418; p = 0.047; Figure 4(f)).
Figure 3.
Representative longitudinal optic nerve sections at 7 dpi stained with Iba 1, SMI 312 and LFB.
Figure 4.
Histological analysis of longitudinal optic nerve sections and correlations at 7 dpi. (a) Quantification of microglia/macrophage cells (mm2) in optic nerves stained with Iba 1. (b) Correlation between VEP latency change (%) and microglia/macrophage cells. (c) Quantification of axonal loss (%) in optic nerves stained with SMI 312. (d) Correlation between VEP latency change and axonal loss. (e) Quantification of demyelination (%) in optic nerves stained with LFB. (f) Correlation between VEP latency change and demyelination. (a, c, e) Healthy (black columns, n = 12 eyes); EAE W LD (white columns, n = 8 eyes); EAE W/O LD (grey columns, n = 12 eyes). Error bars represent the SE. Hashes represent significant differences between EAE W LD and Healthy; triangles represent significant differences between EAE W/O LD and Healthy; asterisks represent significant differences between EAE W LD and EAE W/O LD. (a, c, e) Pairwise comparisons of predicted marginal means were performed according to the concept of least‑squares means (*p < 0.01;**p < 0.001;***p < 0.0001). (b, d, f) Spearman’s correlations.
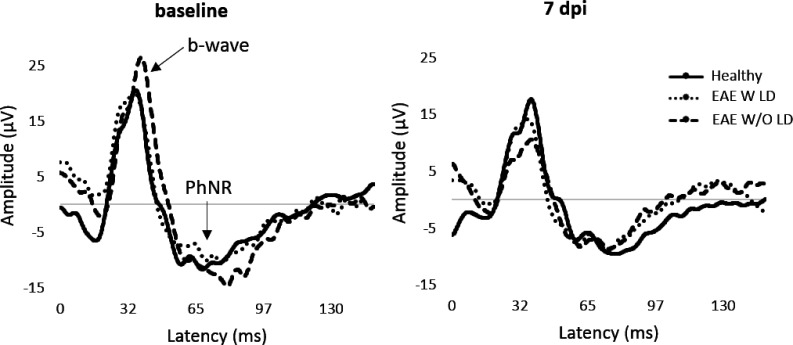
PERG recorded at 7 dpi (Figure 5) detected a significant amplitude decrease of b-wave in EAE W/O LD compared to both Healthy (p = 0.004) and EAE W LD (p = 0.004; Table 2), while PhNR amplitude was not significantly different between groups (Table 3). In order to better appreciate functional alterations, pERG results were normalized on baseline and expressed in percentage of amplitude change (Figure 6).
Figure 5.
Representative pERG waveforms at baseline and 7 dpi.
Table 2.
b-Wave data and statistical values in pre-motor onset experiment.
| Group | Amplitude (µV) |
||
|---|---|---|---|
| Baseline | 7 dpi | ||
| Healthy | average | 23.41 | 21.30 |
| standard error | 2.08 | 1.98 | |
| EAE W LD | average | 22.86 | 18.94 |
| standard error | 0.60 | 1.29 | |
| EAE W/O LD | average | 23.60 | 14.22 |
| standard error | 0.59 | 1.04 | |
| p value | Healthy vs EAE W LD | 0.58 | 0.51 |
| Healthy vs EAE W/O LD | 0.83 | 0.004 | |
| EAE W LD vs EAE W/O LD | 0.41 | 0.004 | |
Table 3.
PhNR data and statistical values in pre-motor onset study.
| Group | Amplitude (µV) |
||
|---|---|---|---|
| Baseline | 7 dpi | ||
| Healthy | average | –11.49 | –10.56 |
| standard error | 0.32 | 0.92 | |
| EAE W LD | average | –11.06 | –8.74 |
| standard error | 0.35 | 0.75 | |
| EAE W/O LD | average | –11.63 | –9.85 |
| standard error | 0.51 | 1.03 | |
| p value | Healthy vs EAE W LD | 0.39 | 0.31 |
| Healthy vs EAE W/O LD | 0.84 | 0.60 | |
| EAE W LD vs EAE W/O LD | 0.41 | 0.72 | |
Figure 6.
Photopic ERG change (%) from baseline to 7 dpi. b-wave (a) and PhNR amplitude change (b) from baseline to 7 dpi in Healthy (n = 8 eyes), EAE W LD (n = 10 eyes) and EAE W/O LD (n = 14 eyes). Error bars represent the SEM.
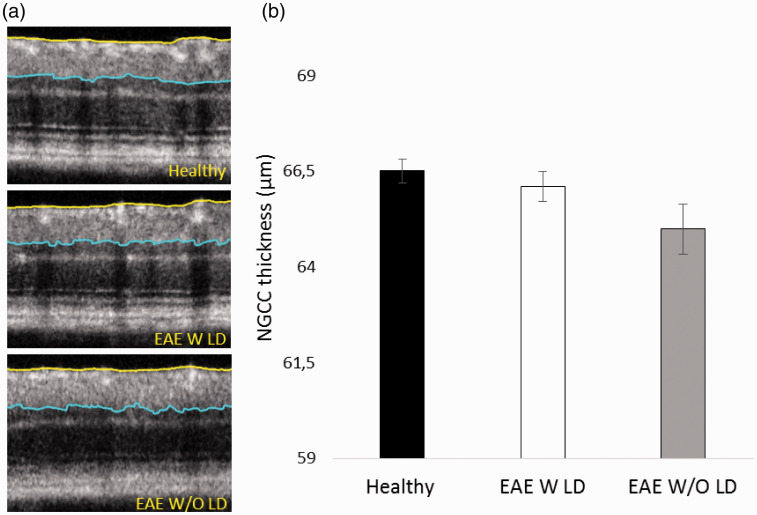
OCT segmentation (Figure 7(a)) noticed a trend towards significance of NGCC thinning in EAE W/O LD compared to Healthy (p = 0.038; Figure 7(b)).
Figure 7.
Representative OCT images and NGCC thickness measured at 7 dpi. (a) Representative OCT images from Healthy, EAE W LD and EAE W/O LD. (b) NGCC thickness of Healthy (black column, n = 20 eyes), EAE W LD (white column, n = 17 eyes), and EAE W/O LD (grey column, n = 15 eyes). Error bars represent the SE.
Visual pathway alteration in EAE post-motor onset experiment
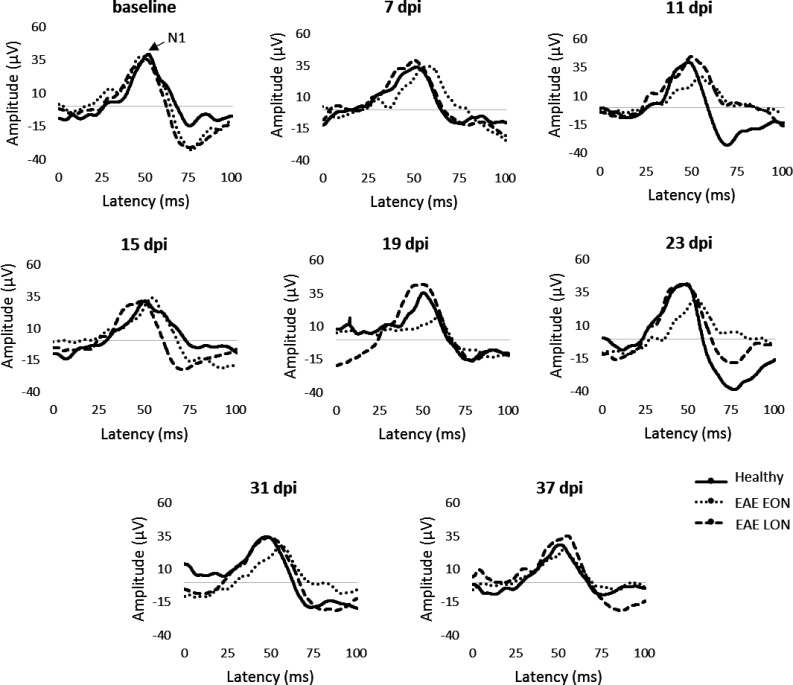
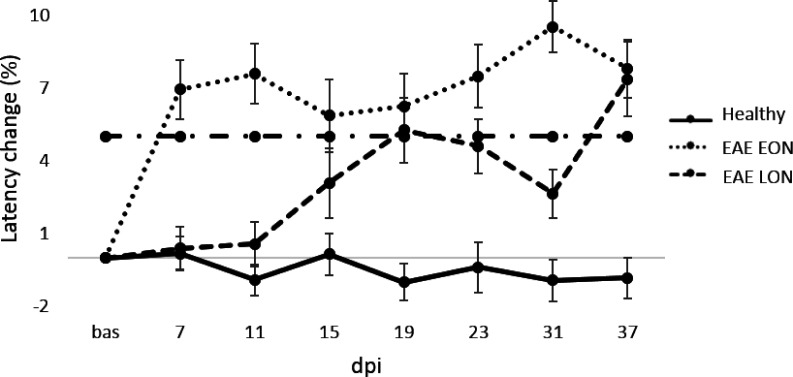
With the aim to characterize the ON at later stages of the disease, EAE was induced and followed until 37 dpi (Table 4). The cutoff value (% change) was used to define EAE eyes with VEP latency delay before clinical onset (detected at 13 dpi; EAE EON and EAE LON) with the possibility to appreciate waveform alterations over time (Figure 8). For this analysis, the cutoff value was set at 5.0% and the proportion of EAE EON was 52% (24/46 eyes) with a VEP latency change of 6.9% and 7.6% at 7 and 11 dpi, respectively. The proportion of EAE LON was 37% (17/46 eyes), with a VEP latency change of 0.3% and 0.4% at 7 and 11 dpi, respectively. However, the VEP latency change increased at 19 dpi (5.3%; Figure 9), followed by a partial decrease at 23 and 31 dpi. It is important to underline that 11% (5/46 eyes) of EAE eyes were excluded from this analysis because they did not show any VEP delay (i.e. the VEP latency change was below the cutoff value). At 37 dpi, VEP latency change in EAE EON was comparable to EAE LON (7.8% and 7.2%, respectively). Interestingly, there was a positive correlation between VEP latency change recorded at 7 and 31 dpi (r = 0.554, p = 0.0002; data not shown).
Table 4.
VEP data in each time point of post-motor onset study.
| Latency (ms) |
|||||||||
|---|---|---|---|---|---|---|---|---|---|
| Group | Baseline | 7 dpi | 11 dpi | 15 dpi | 19 dpi | 23 dpi | 31 dpi | 37 dpi | |
| Healthy | average | 49.58 | 49.64 | 49.01 | 49.52 | 48.97 | 49.25 | 49.99 | 49.03 |
| standard error | 0.16 | 0.25 | 0.28 | 0.26 | 0.32 | 0.32 | 0.31 | 0.29 | |
| EAE EON | average | 48.92 | 52.28 | 52.60 | 51.72 | 51.94 | 52.52 | 53.54 | 52.70 |
| standard error | 0.16 | 0.58 | 0.58 | 0.65 | 0.63 | 0.56 | 0.47 | 0.55 | |
| EAE LON | average | 49.11 | 49.29 | 49.37 | 50.60 | 51.34 | 51.37 | 50.40 | 52.71 |
| standard error | 0.14 | 0.40 | 0.41 | 0.66 | 0.60 | 0.58 | 0.48 | 0.73 | |
Figure 8.
Representative VEP waveforms from baseline to 37 dpi.
Figure 9.
VEP latency change (%) from baseline to 37 dpi in Healthy (n = 16 eyes), EAE EON (n = 24 eyes) and EAE LON (17 eyes). Dashed-dot line represents the cutoff value set a 5.0%. Error bars represent the SEM.
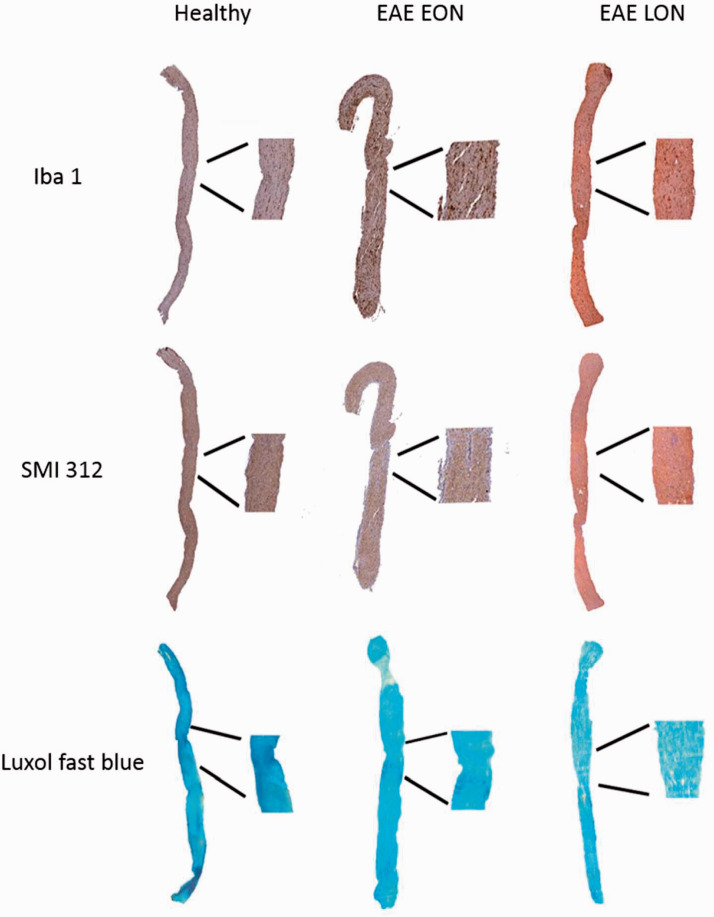
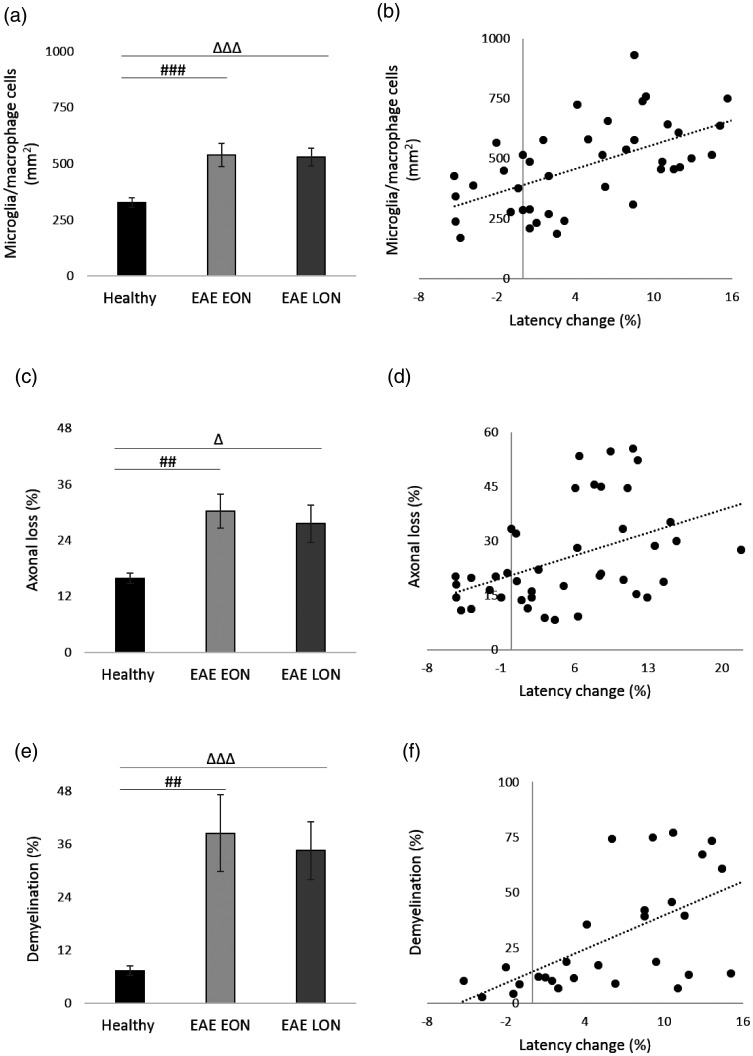
With the same methods used in the experiment ended at 7 dpi, longitudinal optic nerve sections were cut, stained and analyzed (Figure 10). Results of Iba 1+ cell count showed a significant increase of microglia/macrophage cells in both EAE groups compared to Healthy (p < 0.0001; Figure 11(a)). Moreover, there was a positive correlation between VEP latency change and presence of microglia/macrophage cells (r = 0.579; p < 0.0001; Figure 11(b)). Considering SMI staining, a significant axonal loss was observed in both EAE EON and EAE LON with respect to Healthy (p = 0.0002 and p = 0.006, respectively; Figure 11(c)). A positive correlation between VEP latency change and axonal loss was found (r = 0.443, p = 0.003; Figure 1(d)). Regarding LFB staining, demyelination was noticed in both EAE EON and EAE LON compared to Healthy (p = 0.0004 and p < 0.0001, respectively; Figure 11(e)). In addition, there was a positive correlation between VEP latency change and demyelination (r = 0.607, p = 0.001; Figure 11(f)).
Figure 10.
Representative longitudinal optic nerve sections at 37 dpi stained with Iba 1, SMI 312, and LFB.
Figure 11.
Histological analysis of longitudinal optic nerve sections and significant correlations at 37 dpi. (a) Quantification of microglia/macrophage cells (mm2) in optic nerves stained with Iba 1. (b) Correlation between VEP latency change (%) and microglia/macrophage cells. (c) Quantification of axonal loss (%) in optic nerves stained with SMI 312. (d) Correlation between VEP latency change and axonal loss. (e) Quantification of demyelination (%) in optic nerve stained with LFB. (f) Correlation between VEP latency change and demyelination. (a, c, e) Healthy (black columns, n = 13 eyes); EAE EON (light grey columns, n = 14 eyes); EAE LON (dark grey bars, n = 14 eyes). Error bars represent the SE. Hashes represent significant differences between EAE EON and Healthy; triangles represent significant differences between EAE LON and Healthy. (a, c, e) Pairwise comparisons of predicted marginal means were performed according to the concept of least‑squares means (*p < 0.01;**p < 0.001;***p < 0.0001). (b, d, f) Spearman’s correlations.
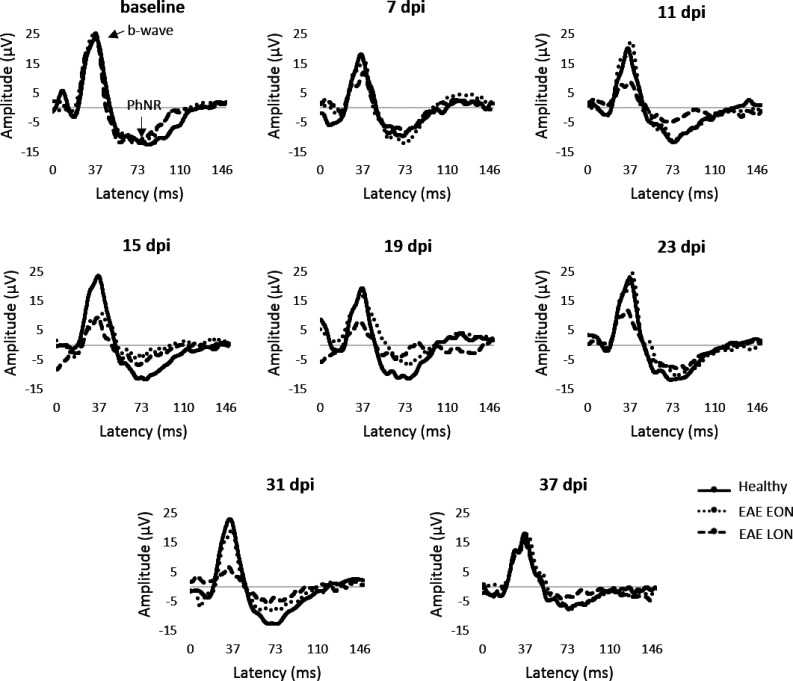
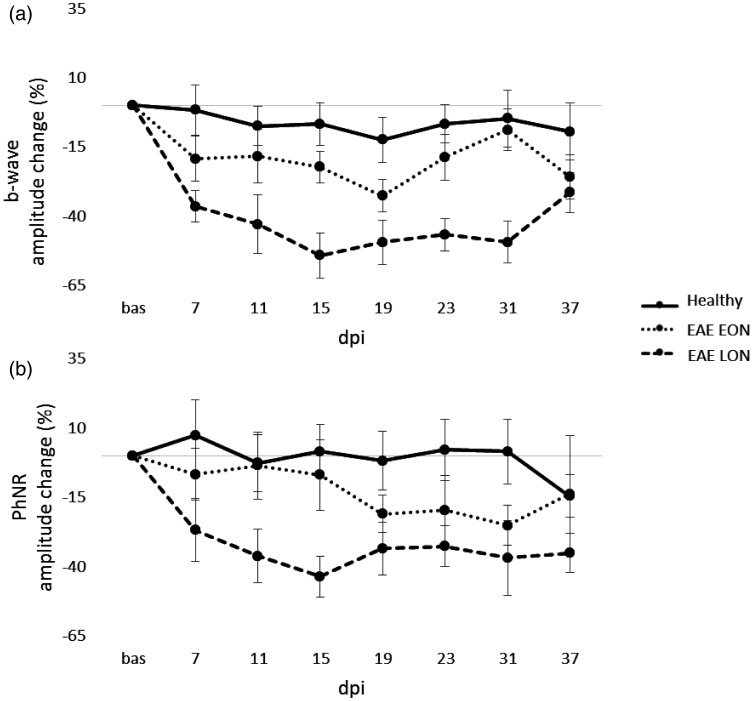
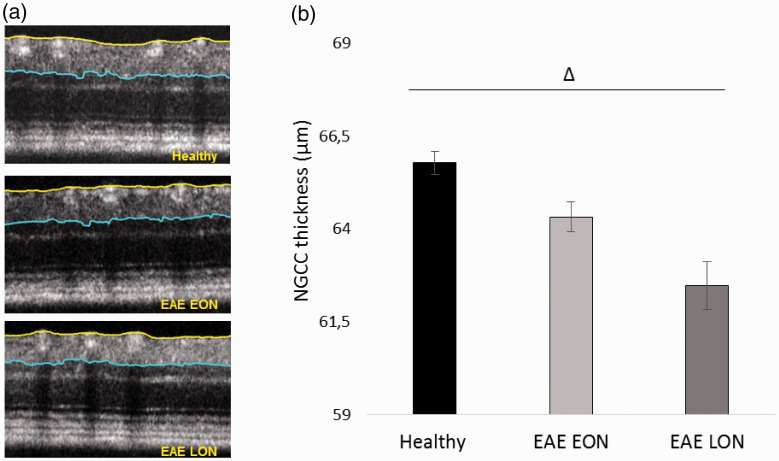
Representative pERG waveforms are reported in Figure 12. Statistical analysis on b-wave amplitude showed a significant difference between EAE groups. In particular, b-wave amplitude of EAE LON was significantly decreased at 11 dpi (p = 0.01), 15 dpi (p = 0.0006), 19 dpi (p = 0.006), 23 dpi (p = 0.001) and 31 dpi (p = 0.002) compared to Healthy (Table 5). Significant decreases of b-wave amplitude were noticed between EAE EON and EAE LON at 15 dpi (p = 0.003), 23 dpi (p = 0.008) and 31 dpi (p = 0.001). Regarding PhNR, EAE LON showed a significant decrease at 15 dpi compared to Healthy (p = 0.006; Table 6). In order to better appreciate functional alterations over time, results were normalized on baseline and expressed in percentage of amplitude change (Figure 13). OCT segmentation (Figure 14(a)) showed a significant decrease of NGCC thickness in EAE LON with respect to Healthy (p = 0.01; Figure 14(b)).
Figure 12.
Representative pERG waveforms from baseline to 37 dpi.
Table 5.
b-Wave data and statistical values in each time point of post-motor onset study.
| Amplitude (µV) |
|||||||||
|---|---|---|---|---|---|---|---|---|---|
| Group | Baseline | 7 dpi | 11 dpi | 15 dpi | 19 dpi | 23 dpi | 31 dpi | 37 dpi | |
| Healthy | average | 21.80 | 19.78 | 18.98 | 18.93 | 17.62 | 19.75 | 19.11 | 18.14 |
| standard error | 1.08 | 1.32 | 1.03 | 1.11 | 1.02 | 1.46 | 1.15 | 1.61 | |
| EAE EON | average | 19.01 | 15.43 | 15.14 | 14.49 | 12.57 | 14.98 | 16.63 | 13.60 |
| standard error | 0.98 | 1.72 | 1.41 | 0.97 | 0.92 | 1.29 | 1.05 | 0.84 | |
| EAE LON | average | 23.98 | 14.41 | 12.65 | 9.87 | 10.88 | 11.62 | 11.23 | 15.19 |
| standard error | 1.99 | 1.41 | 1.84 | 1.55 | 1.50 | 1.19 | 1.50 | 0.88 | |
| p value | Healthy vs EAE EON | 0.06 | 0.56 | 0.65 | 0.44 | 0.27 | 0.43 | 0.88 | 0.46 |
| Healthy vs EAE LON | 0.39 | 0.02 | 0.01 | 0.0006 | 0.006 | 0.001 | 0.002 | 0.11 | |
| EAE EON vs EAE LON | 0.05 | 0.08 | 0.04 | 0.003 | 0.03 | 0.008 | 0.001 | 0.23 | |
Table 6.
PhNR data and statistical values in each time point of post-motor onset study.
| Amplitude (µV) |
|||||||||
|---|---|---|---|---|---|---|---|---|---|
| Group | Baseline | 7 dpi | 11 dpi | 15 dpi | 19 dpi | 23 dpi | 31 dpi | 37 dpi | |
| Healthy | average | –10.55 | –10.38 | –9.52 | –9.34 | –9.68 | –9.45 | –9.80 | –8.76 |
| standard error | 0.49 | 0.89 | 0.70 | 0.57 | 0.57 | 0.64 | 0.62 | 0.87 | |
| EAE EON | average | –9.49 | –8.52 | –8.68 | –7.90 | –7.21 | –7.00 | –6.78 | –6.67 |
| standard error | 0.62 | 0.81 | 0.93 | 0.73 | 0.59 | 0.85 | 0.47 | 0.65 | |
| EAE LON | average | –11.14 | –7.62 | –0.71 | –5.87 | –6.83 | –6.96 | –6.13 | –6.86 |
| standard error | 0.94 | 0.95 | 0.81 | 0.56 | 0.68 | 0.48 | 1.15 | 0.52 | |
| p value | Healthy vs EAE EON | 0.20 | 0.58 | 0.88 | 0.76 | 0.23 | 0.30 | 0.09 | 0.45 |
| Healthy vs EAE LON | 0.62 | 0.07 | 0.04 | 0.006 | 0.03 | 0.03 | 0.02 | 0.12 | |
| EAE EON vs EAE LON | 0.18 | 0.17 | 0.05 | 0.02 | 0.20 | 0.29 | 0.02 | 0.35 | |
Figure 13.
Photopic ERG amplitude change (%) from baseline to 37 dpi. b-wave (a) and PhNR amplitude change (b) from baseline to 37 dpi in Healthy (n = 14 eyes), EAE EON (n = 12 eyes) and EAE LON (6 eyes). Error bars represent the SEM.
Figure 14.
Representative OCT images and NGCC thickness measured at 37 dpi. (a) Representative OCT images from Healthy, EAE W LD and EAE W/O LD. (b) NGCC thickness of Healthy (black column, n = 13 eyes), EAE EON (light grey column, n = 21 eyes) and EAE LON (dark grey column, n = 9 eyes). Error bars represent the SE. Triangles represent significant differences between EAE LON and Healthy. Pairwise comparisons of predicted marginal means were performed according to the concept of least squares means (*p < 0.01).
Discussion
C57BL/6 mice immunized with MOG35-55 exhibit a chronic EAE course 27 with optic neuritis (ON), consisting of inflammation, demyelination, axonal and RGC loss. Visual pathway is receiving increasing attention as a tool to monitor neurodegeneration. 28 Although the linkages between EAE and ON are well documented,29,30 disease induction has a heterogeneous efficiency 31 and more efforts are still necessary to characterize functional and structural visual alterations. In the present work, we investigated optic nerve damage and visual dysfunction in EAE through two longitudinal studies. Firstly, we focused on the characterization of ON in EAE eyes with VEP latency delay (EAE W LD) and EAE eyes without VEP latency delay (EAE W/O LD), in order to detect potential differences before EAE motor onset. ON is an early event, such as weight loss, which develops few days before clinical and pathological EAE signs, as demonstrated by Shao and coauthors. 32 However, the authors did not measure optic nerve function, defining ON with histological analysis. At 7 dpi, our histological results showed inflammation and demyelination in EAE W LD. Therefore, histology confirmed ON that was previously detected by VEPs. In EAE W/O LD, we found a significant decrease of b-wave, probably because bipolar/Muller/amacrine cells layer might be susceptible to inflammation and cell death. Moreover, this inflammatory state could decrease the RGC number, but not its functional activity, as confirmed by the unchanged PhNR amplitude of EAE W/O LD. Accordingly, we could assume that the surviving RGCs might compensate the ongoing retinal dysfunction. Through this short follow up study, we found two different visual degenerations; indeed in some MS patients RGC loss occurs without episodes of ON, suggesting that the RGC decrease may mediate visual loss in MS. 33
In the second part of our work, we studied EAE visual alterations until the chronic phase of disease. The subdivision between EAE eyes with early optic neuritis (EAE EON) and EAE eyes with late optic neuritis (EAE LON) allowed us to observe different optic nerve dysfunction profiles over time. It has been reported that there are different VEP profiles in EAE mice with early and late optic nerve damage. 34 In EAE EON, the VEP latency delay was present and stable over time, while in EAE LON the VEP delay started at 19 dpi, after EAE motor onset. Interestingly, we noticed a positive correlation between VEP latency change at 7 and 31 dpi, thus the early optic nerve dysfunction predicted its degeneration that was detected at a later time point. Thanks to pERG recording, EAE LON showed a significant b-wave amplitude reduction from 15 to 31 dpi, together with a significant decrease of PhNR amplitude at 15 dpi. These results could be congruent with the existing literature: indeed Manogaran and coauthors reported a decreased number of Müller cells in EAE mice from 15 to 28 dpi. 28 Moreover, we detected a significant decrease of NGCC thickness at OCT. All these evidences suggested that visual damage in EAE LON was present in both retina and optic nerve. Several studies postulate that RGC loss represents a secondary effect of optic nerve inflammation, whereas current findings from human OCT propose an independent development between eye damage and optic nerve pathology. 35 However, observing the last time point of our study (37 dpi), no differences in electrophysiological measures were found between EAE groups, whereas VEP outcomes were confirmed by histological quantifications. Our results suggested that non-invasive epidermal VEP recording was effective in detecting EAE visual dysfunctions. VEP in combination with pERG and OCT can discriminate between two types of visual pathway damage in EAE. In one case, the optic nerve is affected by early and high inflammation that may cause myelin damage followed by axons degeneration. On the other hand, in eyes with late VEP latency increase, axonal loss seemed to be the detrimental process leading to chronic ON, together with retina alterations detected by pERG recording and OCT imaging. In conclusion, using different non-invasive methods, we managed to distinguish between axonal and myelin damage at early EAE stages, which could be crucial to develop more specific treatments for neurodegeneration and/or demyelination.
Conflict of Interests
The author(s) declared no potential conflicts of interest with respect to the research, authorship, and/or publication of this article.
Footnotes
Funding: The author(s) disclosed receipt of the following financial support for the research, authorship, and/or publication of this article: S. Marenna is supported through a Fellowship from the Italian Foundation of Multiple Sclerosis (FISM Fellowship 203/19/F14). The other authors received no financial support for the research, authorship, and/or publication of this article.
ORCID iD: Letizia Leocani https://orcid.org/0000-0001-9326-6753
References
- 1.Mayo L, Quintana FJ, Weiner HL. The innate immune system in demyelinating disease. Immunol Rev 2012; 248: 170–187. [DOI] [PMC free article] [PubMed] [Google Scholar]
- 2.Silbermann E, Wooliscroft L, Bourdette D. Using the anterior visual system to assess neuroprotection and remyelination in multiple sclerosis trials. Curr Neurol Neurosci Rep 2018; 18: 49. [DOI] [PubMed] [Google Scholar]
- 3.Compston A, Sadovnick AD. Epidemiology and genetics of multiple sclerosis. Curr Opin Neurol Neurosurg 1992; 5: 175–181. [PubMed] [Google Scholar]
- 4.Martínez-Lapiscina EH, Sanchez-Dalmau B, Fraga-Pumar E, et al. The visual pathway as a model to understand brain damage in multiple sclerosis. Mult Scler 2014; 20: 1678–1685. [DOI] [PubMed] [Google Scholar]
- 5.Khare P, Challa DK, Devanaboyina SC, et al. Myelin oligodendrocyte glycoprotein-specific antibodies from multiple sclerosis patients exacerbate disease in a humanized mouse model. J Autoimmun 2018; 86: 104–115. [DOI] [PubMed] [Google Scholar]
- 6.Wu GF, Parker Harp CR, Shindler KS. Optic neuritis: a model for the immuno-pathogenesis of central nervous system inflammatory demyelinating diseases. Curr Immunol Rev 2015; 11: 85–92. [DOI] [PMC free article] [PubMed] [Google Scholar]
- 7.Bettelli E, Pagany M, Weiner HL, et al. Myelin oligodendrocyte glycoprotein-specific T cell receptor transgenic mice develop spontaneous autoimmune optic neuritis. J Exp Med 2003; 197: 1073–1081. [DOI] [PMC free article] [PubMed] [Google Scholar]
- 8.Gallo A, Bisecco A, Bonavita S, et al. Functional plasticity of the visual system in multiple sclerosis. Front Neurol 2015; 6: 79. [DOI] [PMC free article] [PubMed] [Google Scholar]
- 9.Green AJ. Visual evoked potentials, electroretinography, and other diagnostic approaches to the visual system. In: Aminoff MJ. (ed.) Aminoff’s electrodiagnosis in clinical neurology. Cham: Elsevier, 2017, pp.477–503. [Google Scholar]
- 10.Martin M, Hiltner TD, Wood JC, et al. Myelin deficiencies visualized in vivo: visually evoked potentials and T2-weighted magnetic resonance images of shiverer mutant and wild-type mice. J Neurosci Res 2006; 84: 1716–1726. [DOI] [PubMed] [Google Scholar]
- 11.Makowiecki K, Garrett A, Clark V, et al. Reliability of VEP recordings using chronically implanted screw electrodes in mice. Transl Vis Sci Technol 2015; 4: 15. [DOI] [PMC free article] [PubMed] [Google Scholar]
- 12.Mazzucchelli A, Conte S, D’Olimpio F, et al. Ultradian rhythms in the N1-P2 amplitude of the visual evoked potential in two inbred strains of mice: DBA/2J and C57bl/6. Behav Brain Res 1995; 67: 81–84. [DOI] [PubMed] [Google Scholar]
- 13.Meyers L, Groover CJ, Douglas J, et al. A role for apolipoprotein A-I in the pathogenesis of multiple sclerosis. J Neuroimmunol 2014; 277: 176–185. [DOI] [PubMed] [Google Scholar]
- 14.Zhang HK, Ye Y, Zhao ZN, et al. Neuroprotective effects of gypenosides in experimental autoimmune optic neuritis. Int J Ophthalmol 2017; 10: 541–545. [DOI] [PMC free article] [PubMed] [Google Scholar]
- 15.Marenna S, Castoldi V, d’Isa R, et al. Semi-invasive and non- invasive recording of visual evoked potentials in mice. Doc Ophthalmol 2019; 138: 169–179. [DOI] [PubMed] [Google Scholar]
- 16.Santangelo R, Castoldi V, D’Isa R, et al. Visual evoked potentials can be reliably recorded using noninvasive epidermal electrodes in the anesthetized rat. Doc Ophthalmol 2018; 136: 165–175. [DOI] [PubMed] [Google Scholar]
- 17.Costello F. The afferent visual pathway: designing a structural-functional paradigm of multiple sclerosis. ISRN Neurol 2013; 2013: 134858. [DOI] [PMC free article] [PubMed] [Google Scholar]
- 18.Saszik SM, Robson JG, Frishman LJ. The scotopic threshold response of the dark-adapted electroretinogram of the mouse. J Physiol (Lond) 2002; 543: 899–916. [DOI] [PMC free article] [PubMed] [Google Scholar]
- 19.Brandli A, Stone J. Using the electroretinogram to assess function in the rodent retina and and the protective effects of remote limb ischemic preconditioning. J Vis Exp 2015; (100): e52658. [DOI] [PMC free article] [PubMed] [Google Scholar]
- 20.Frishman LJ, Wang MH. Electroretinogram of human, monkey and mouse. In: LA Levin, SFE Nilsson, J Ver Hoeve, et al. (eds) Adler’s physiology of the eye. 11th ed. New York: Saunders Elsevier, 2011, pp.480–501. [Google Scholar]
- 21.Kim HD, Park JY, Ohn YH. Clinical applications of photopic negative response (PhNR) for the treatment of glaucoma and diabetic retinopathy. Korean J Ophthalmol 2010; 24: 89–95. [DOI] [PMC free article] [PubMed] [Google Scholar]
- 22.Locri F, Cammalleri M, Pini A, et al. Further evidence on efficacy of diet supplementation with fatty acids in ocular pathologies: insights from the EAE model of optic neuritis. Nutrients 2018; 10: 1447. [DOI] [PMC free article] [PubMed] [Google Scholar]
- 23.Wang HW, Chen Y. Clinical applications of optical coherence tomography in urology. Intravital 2014; 3: e28770. [DOI] [PMC free article] [PubMed] [Google Scholar]
- 24.Tewarie P, Balk L, Costello F, et al. The OSCAR-IB consensus criteria for retinal OCT quality assessment. PLoS One 2012; 7: e34823. [DOI] [PMC free article] [PubMed] [Google Scholar]
- 25.Schippling S, Balk LJ, Costello F, et al. Quality control for retinal OCT in multiple sclerosis: validation of the OSCAR-IB criteria. Mult Scler 2015; 21: 163–170. [DOI] [PubMed] [Google Scholar]
- 26.Castoldi V, Marenna S, d’Isa R, et al. Non-invasive visual evoked potentials to assess optic nerve involvement in the dark agouti rat model of experimental autoimmune encephalomyelitis induced by myelin oligodendrocyte glycoprotein. Brain Pathol 2020; 30: 137–150. [DOI] [PMC free article] [PubMed] [Google Scholar]
- 27.Quinn TA, Dutt M, Shindler KS. Optic neuritis and retinal ganglion cell loss in a chronic murine model of multiple sclerosis. Front Neurol 2011; 2: 50. [DOI] [PMC free article] [PubMed] [Google Scholar]
- 28.Aras S, Tanriover G, Aslan M, et al. The role of nitric oxide on visual-evoked potentials in MPTP-induced Parkinsonism in mice. Neurochem Int 2014; 72: 48–57. [DOI] [PubMed] [Google Scholar]
- 29.Manogaran P, Walker-Egger C, Samardzija M, et al. Exploring experimental autoimmune optic neuritis using multimodal imaging. Neuroimage 2018; 175: 327–339. [DOI] [PubMed] [Google Scholar]
- 30.Shindler KS, Ventura E, Dutt M, et al. Inflammatory demyelination induces axonal injury and retinal ganglion cell apoptosis in experimental optic neuritis. Exp Eye Res 2008; 87: 208–213. [DOI] [PMC free article] [PubMed] [Google Scholar]
- 31.Croxford AL, Kurschus FC, Waisman A. Mouse models for multiple sclerosis: historical facts and future implications. Biochim Biophys Acta 2011; 1812: 177–183. [DOI] [PubMed] [Google Scholar]
- 32.Shao H, Huang Z, Sun SL, et al. Myelin/oligodendrocyte glycoprotein-specific T-cells induce severe optic neuritis in the C57BL/6 mouse. Invest Ophthalmol Vis Sci 2004; 45: 4060–4065. [DOI] [PubMed] [Google Scholar]
- 33.Horstmann L, Schmid H, Heinen AP, et al. Inflammatory demyelination induces glia alterations and ganglion cell loss in the retina of an experimental autoimmune encephalomyelitis model. J Neuroinflammation 2013; 10: 120. [DOI] [PMC free article] [PubMed] [Google Scholar]
- 34.Nishioka C, Liang HF, Chung CF, et al. Disease stage-dependent relationship between diffusion tensor imaging and electrophysiology of the visual system in a murine model of multiple sclerosis. Neuroradiology 2017; 59: 1241–1250. [DOI] [PMC free article] [PubMed] [Google Scholar]
- 35.Wilmes AT, Reinehr S, Kühn S, et al. Laquinimod protects the optic nerve and retina in an experimental autoimmune encephalomyelitis model. J Neuroinflammation 2018; 15: 183. [DOI] [PMC free article] [PubMed] [Google Scholar]


