

LIST OF ABBREVIATIONS
- BCL2
BCL2 apoptosis regulator
- CD70
CD70 molecule
- CNV
copy number variation
- CREBBP
CREB binding protein
- CXCR4
C‐X‐C motif chemokine receptor 4
- DEGs
differentially expressed genes
- FL
follicular lymphoma
- GC
germinal center
- HBsAg
HBV surface‐antigen
- HBV
hepatitis B virus
- IGH
immunoglobulin heavy locus
- KMT2D
lysine methyltransferase 2D
- MBCs
class‐switched memory B cells.
- MHC
major histocompatibility complex
- NHL
indolent non‐Hodgkin's lymphoma
- PBMCs
peripheral blood mononuclear cells
- PFS
progression‐free survival
- R2
rituximab plus lenalidomide
- TIGIT
T cell immunoreceptor with Ig and ITIM domains
- TNFAIP3
tumor necrosis factor‐α induced protein 3
- VISTA
V‐set immunoregulatory receptor
- WT
wild type
Dear Editor,
Follicular lymphoma (FL) represents the most common subtype of indolent non‐Hodgkin's lymphoma (NHL) with distinct pathological, cytogenetic, and molecular features, accounting for 9.7% of NHLs in China [1]. FL maintains a differentiation stage similar to germinal center (GC) B cells and is divided into grades 1, 2, 3A, and 3B [2]. Up to 90% of FLs harbor the t(14;18)(q32;q21)/BCL2 apoptosis regulator (BCL2)‐immunoglobulin heavy locus (IGH) translocation and epigenetic modifier mutations, particularly lysine methyltransferase 2D (KMT2D) and CREB‐binding protein (CREBBP) [2]. Meanwhile, FL is composed of various immune cells, including CD8+ T and CD4+ T helper cells. Growing evidence suggests hepatitis B virus (HBV) as a potential pathogenic factor in B‐cell NHL [3]. The positive rate of HBV surface‐antigen (HBsAg) was 21.5% in FL patients [4], higher than that in the general Chinese population (7.2%) [5]. Here, we performed an integrated genomic and transcriptomic analysis to elucidate the pathogenetic role of HBV in FL and investigate potential therapeutic approaches targeting genetic and microenvironmental vulnerabilities of HBV‐associated FL.
A total of 253 consecutive patients with newly diagnosed FL were enrolled. Among them, 175 were treated with immunochemotherapy, and 78 with rituximab plus lenalidomide (the R2 regimen). The detailed methods are described in the Supplementary file.
As compared to HBsAg− FLs (n = 210), HBsAg+ FLs (n = 43) presented more frequent spleen involvement, higher histological grade, and higher proliferation index (Supplementary Table S1), which were both observed in the immunochemotherapy and R2 cohorts (Supplementary Tables S2‐S3). No significant differences in the liver function and occurrence rates of liver cirrhosis and hepatocellular carcinoma were observed between these two cohorts (Supplementary Table S4). To explore the genetic features of HBsAg+ FL, genetic aberrations were compared between 24 HBsAg+ FL and 76 HBsAg− FL patients. The results showed that HBsAg+ FL were associated with increased immune modulator mutations, including tumor necrosis factor‐α induced protein 3 (TNFAIP3), CD70 molecule (CD70), and C‐X‐C motif chemokine receptor 4 (CXCR4), and with decreased epigenetic modifier mutations (KMT2D and CREBBP) and BCL2 translocation (Figure 1A). We also investigated copy number variations (CNVs) and observed a distinct pattern in HBsAg+ FL, mainly involved in immune‐related signaling pathways (Supplementary Figure S1A‐S1B). Besides, integration of viral genes in the genome of tumor cells was not detected in HBsAg+ FL. Also, HBsAg was not detected in HBsAg+ FL tissues (Supplementary Figure S1C). Therefore, HBV‐associated FL may be driven by immune alterations, which is different from “classical” FL, dominated by BCL2 translocation and epigenetic modifier mutations [2]. In HBsAg− FL, significant difference in neither gene mutations nor CNVs was observed between HBsAg−HBcAb+ and HBsAg−HbcAb− patients (Supplementary Tables S5‐S6).
FIGURE 1.
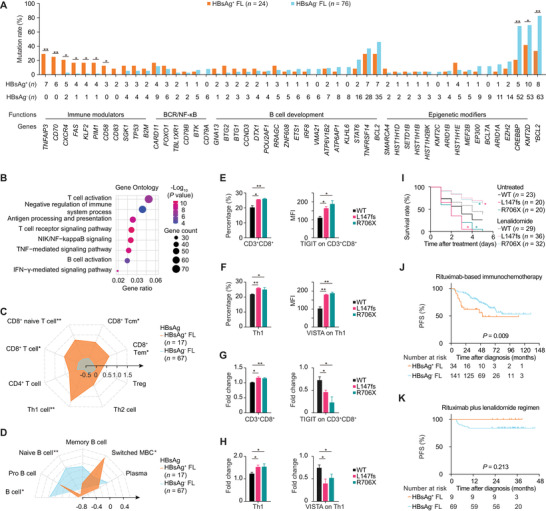
Features of Hepatitis B virus‐associated follicular lymphoma. (A) The mutation rates of indicated genetic abnormalities in HBsAg+ and HBsAg− FL. (B) Gene Ontology terms on the 1514 DEGs between HBsAg+ and HBsAg− FL. (C) Summary radar plot, with 0.5 radial intervals depicting normalized average scores of T‐cell subsets in HBsAg+ (orange polygon) and HBsAg− FL (blue polygon). (D) Summary radar plot, with 0.4 radial intervals, depicting normalized average scores of B‐cell subsets in HBsAg+ FL and HBsAg− FL. (E) Percentage of CD3+CD8+ T cells in PBMCs when co‐cultured with SC‐1 cells transfected with indicated TNFAIP3 plasmids and MFI of TIGIT on CD3+CD8+ T cells. (F) Percentage of Th1 cells in PBMCs when co‐cultured with SC‐1 cells transfected with indicated TNFAIP3 plasmids and MFI of VISTA on Th1 cells. (G) Fold change of CD3+CD8+ T cells and MFI of TIGIT on CD3+CD8+ T cells upon lenalidomide treatment when co‐cultured with SC‐1 cells transfected with indicated TNFAIP3 plasmids. (H) Fold change of Th1 cells and MFI of VISTA on co‐cultured Th1 upon lenalidomide treatment when co‐cultured with SC‐1 cells transfected with indicated TNFAIP3 plasmids. (I) Survival curves of zebrafish xenograft models injected with SC‐1 cells transfected with indicated TNFAIP3 plasmids without and with lenalidomide treatment. Red asterisk indicates significant difference between the TNFAIP3‐L147fs and TNFAIP3‐WT groups, and green asterisk indicates significant difference between the TNFAIP3‐R706X and TNFAIP3‐WT groups. (J) PFS curves of HBsAg+ and HBsAg− FL patients who received rituximab‐based immunochemotherapy (n = 175). (K) PFS in HBsAg+ and HBsAg− FL patients who received the rituximab plus lenalidomide regimen (n = 78). Assays in panels E‐H were set up in triplicate, and the data are represented as mean ± SD. The Fisher's exact test was used in panel A; the two‐sided unpaired t‐test was used in panels C‐H; the log‐rank test was used in panels I‐K. *P < 0.05, **P < 0.001. Abbreviations: HBsAg, hepatitis B virus surface antigen; FL, follicular lymphoma; * BCL2, t(14;18)(q32;q21)/BCL2‐IGH translocation; DEGs, differentially expressed genes; CD8+ Tcm, CD8+ central memory T cell; CD8+ Tem, CD8+ effector memory T cell; Treg, regulatory T cell; Switched MBC, class‐switched memory B cell; PBMCs, peripheral blood mononuclear cells; WT: wild type; MFI, mean fluorescence intensity; PFS, progression‐free survival.
Using transcriptomic sequencing on 84 tumor samples, we compared the gene expression profiles between HBsAg+ FLs (n = 17) and HBsAg− FLs (n = 67). Overall, 1514 differentially expressed genes (DEGs) were identified (Supplementary Table S7). Enriched Gene Ontology terms of DEGs revealed that HBsAg+ FL was closely related to inflammation‐related pathways, mainly T‐cell activation, antigen processing and presentation, and T‐cell receptor signaling pathways (Figure 1B). We evaluated the relationship with major histocompatibility complex (MHC) molecules and observed increased expression of MHC I and II molecules in HBsAg+ FL patients (Supplementary Figure S2A‐S2B). We also noticed upregulation of interferon signatures [6] in HBsAg+ FL patients (Supplementary Figure S2C). T‐cell subsets were distinguished using the xCell method. HBsAg+ FL patients presented increased CD8+ T and T helper cells 1 (Th1) (Figure 1C). Upregulation of individual genes related to CD8+ T and Th1 cells was also found in HBsAg+ FL (Supplementary Figure S2D), which was confirmed by immunohistochemistry (Supplementary Figure S3).
B‐cell subsets were further investigated using the xCell method. We observed decreased naïve B cells and increased class‐switched memory B cells (MBCs) in HBsAg+ FL (Figure 1D), indicating ongoing immune response [7]. Accordingly, individual genes related to naïve B cells were downregulated, while those of MBCs were upregulated in HBsAg+ FL (Supplementary Figure S4A). The expression of the major transcription factors involved in GC development [8] was subsequently analyzed. Significant downregulation of transcription factors involved in early GC initiation, late GC initiation, and GC maintenance and upregulation of transcription factors involved in post‐GC development were found in HBsAg+ FL (Supplementary Figure S4B). Moreover, it was confirmed that most HBsAg+ FL was derived from post‐GC B cells (Supplementary Figure S4C‐S4D) using the unsupervised hierarchical clustering algorithm [8].
Based on these findings, we propose a model in which HBV induces a T‐cell inflamed phenotype, manifested by frequent immune modulator mutations, enhanced inflammation‐related pathways, and increased CD8+ T and Th1 cell infiltration. Meanwhile, T‐cell inflamed status contributes to a hyper‐active status (post‐GC phenotype) and subsequent malignant progression of B cells.
To further determine the role of immune modulator mutations in HBV‐associated FL, the function of TNFAIP3 mutation was investigated. TNFAIP3‐wild type (WT) and TNFAIP3‐mutant plasmids were transfected into SC‐1 cell line. The transfection efficiency was confirmed (Supplementary Figure S5A). We observed enhanced cell proliferation in TNFAIP3‐mutant cells than in TNFAIP3‐WT cells (Supplementary Figure S5B). Of note, when co‐cultured with peripheral blood mononuclear cells (PBMCs), significant increase in CD8+ T cells and higher expression of T‐cell immunoreceptor with Ig and ITIM domains (TIGIT) on CD8+ T cells were shown in TNFAIP3‐mutant cells than in TNFAIP3‐WT cells (Figure 1E). We also noticed an increase in Th1 cells and higher expression of V‐set immunoregulatory receptor (VISTA) on Th1 cells in TNFAIP3‐mutant cells (Figure 1F). As reported, TIGIT and VISTA negatively regulate T‐cell response [9]. Therefore, another prominent feature of HBV‐associated FL is their ability to facilitate immune escape, particularly due to upregulation of inhibitory immune checkpoints, as previously described in T‐cell inflamed lymphomas [10].
Lenalidomide shows long‐term efficacy on FL through stimulating tumor‐infiltrating CD8+ T and T helper cells and targeting inflammatory pathways, all of which were enriched in HBsAg+ FL. Indeed, when co‐cultured with PBMCs, the growth of TNFAIP3‐mutant cells was inhibited by lenalidomide (Supplementary Figure S5C). Meanwhile, CD8+ T and Th1 cells in the co‐cultured system with TNFAIP3‐mutant cells were increased, while the expression of TIGIT on CD8+ T cells and the expression of VISTA on Th1 cells were decreased (Figure 1G‐1H). In vivo, zebrafish xenograft models showed decreased survival when injected with TNFAIP3‐mutant cells and prolonged survival upon lenalidomide treatment (Figure 1I). In clinical settings, the median follow‐up duration was 49.9 (range, 3.1‐129.6) months in the immunochemotherapy cohort and 33.6 (range, 12.9‐45.6) months in the R2 cohort. For the immunochemotherapy cohort (n = 175), HBsAg+ FLs presented lower 2‐year progression‐free survival (PFS) rates than HBsAg− FLs (62.0% vs. 91.5%, Figure 1J). For the R2 cohort (n = 78), no such significant difference was observed (100.0% vs. 84.1%, Figure 1K). Together, FL with immune modulator mutations showed higher sensitivity to lenalidomide both in vitro and in vivo. The R2 regimen appeared to mitigate a negative impact of HBV on clinical outcome upon immunochemotherapy. Long‐term follow‐up is required to further confirm the improved survival of HBsAg+ FL patients by the R2 regimen.
In conclusion, HBV‐associated FL may be considered as a specific entity, based on distinct immune modulator mutations and CD8+ T‐ and Th1‐enriched post‐GC phenotype. Potent immunomodulatory effect of lenalidomide on HBsAg+ FL may provide clinical rationale of enhancing anti‐tumor immune surveillance in treating virus‐associated B‐cell lymphomas.
DECLARATIONS
ETHICS APPROVAL AND CONSENT TO PARTICIPATE
The study was approved by the Ruijin Hospital Ethics Committee with written informed consent obtained in accordance with the Declaration of Helsinki.
All animal experiments were approved by the Animal Care and Use Committee of Shanghai Jiao Tong University. All animal experiment procedures followed the rules of the Committee on Animal Care of Shanghai, China and the ARRIVE guidelines.
CONSENT FOR PUBLICATION
Not applicable.
CONFLICT OF INTEREST
The authors declare no competing interests.
FUNDING
This study was supported, in part, by research funding from the National Natural Science Foundation of China (81830007 and 81900193), Chang Jiang Scholars Program, Shanghai Municipal Education Commission Gaofeng Clinical Medicine (20152206 and 20152208), Shanghai Sailing Program (19YF1430900), Clinical Research Plan of Shanghai Hospital Development Center (SHDC2020CR1032B), and Multicenter Clinical Research Project by Shanghai Jiao Tong University School of Medicine (DLY201601).
AUTHORS’ CONTRIBUTIONS
NW and WQ performed the experiments, collected and analyzed the data, and wrote the article. NW and ZZ prepared biological samples, and performed the experiments. NW and MZ were responsible for bioinformatics investigation. NW, ZZ, JX, RS, LW, PPX, and SC recruited patients, collected study data, and prepared biological samples. LD and HMX reviewed the histopathologic diagnoses. HF, YCW, CL, XJS and FZ gave technical support. WLZ conceived the study, directed, and supervised research and wrote the manuscript. All authors read and approved the final manuscript.
Supporting information
Supporting Information
Supporting Information
Supporting Information
ACKNOWLEDGMENTS
We thank the Multicenter Hematology‐Oncology Programs Evaluation System (M‐HOPES), Network & Information Center at Shanghai Jiao Tong University, Collaborative Innovation Center of Systems Biomedicine, and the Samuel Waxman Cancer Research Foundation, and all the patients involved for allowing us to analyze their clinical data.
DATA AVAILABILITY STATEMENT
Raw data of sequencing is available at the National Omics Data Encyclopedia (NODE, https://www.biosino.org/node/, Project ID: OEP001917).
REFERENCES
- 1. Liu W, Ji X, Song Y, Wang X, Zheng W, Lin N, et al. Improving survival of 3760 patients with lymphoma: Experience of an academic center over two decades. Cancer Med. 2020;9:3765‐74. [DOI] [PMC free article] [PubMed] [Google Scholar]
- 2. Carbone A, Roulland S, Gloghini A, Younes A, von Keudell G, López‐Guillermo A, et al. Follicular lymphoma. Nat Rev Dis Primers. 2019;5:83‐102. [DOI] [PubMed] [Google Scholar]
- 3. Li M, Gan Y, Fan C, Yuan H, Zhang X, Shen Y, et al. Hepatitis B virus and risk of non‐Hodgkin lymphoma: An updated meta‐analysis of 58 studies. J Viral Hepat. 2018;25:1‐10. [DOI] [PubMed] [Google Scholar]
- 4. Cheng CL, Fang WQ, Lin YJ, Yuan CT, Ko BS, Tang JL, et al. Hepatitis B surface antigen positivity is associated with progression of disease within 24 months in follicular lymphoma. J Cancer Res Clin Oncol. 2021. [DOI] [PMC free article] [PubMed] [Google Scholar]
- 5. Campos‐Valdez M, Monroy‐Ramírez HC, Armendáriz‐Borunda J, Sánchez‐Orozco LV. Molecular Mechanisms during Hepatitis B Infection and the Effects of the Virus Variability. Viruses. 2021;13. [DOI] [PMC free article] [PubMed] [Google Scholar]
- 6. Ayers M, Lunceford J, Nebozhyn M, Murphy E, Loboda A, Kaufman DR, et al. IFN‐γ‐related mRNA profile predicts clinical response to PD‐1 blockade. J Clin Invest. 2017;127:2930‐40. [DOI] [PMC free article] [PubMed] [Google Scholar]
- 7. Brandsma CA, Hylkema MN, Geerlings M, van Geffen WH, Postma DS, Timens W, et al. Increased levels of (class switched) memory B cells in peripheral blood of current smokers. Respir Res. 2009;10:108. [DOI] [PMC free article] [PubMed] [Google Scholar]
- 8. Basso K, Dalla‐Favera R. Germinal centres and B cell lymphomagenesis. Nat Rev Immunol. 2015;15:172‐84. [DOI] [PubMed] [Google Scholar]
- 9. Qin S, Xu L, Yi M, Yu S, Wu K, Luo S. Novel immune checkpoint targets: moving beyond PD‐1 and CTLA‐4. Mol Cancer. 2019;18:155. [DOI] [PMC free article] [PubMed] [Google Scholar]
- 10. Kline J, Godfrey J, Ansell SM. The immune landscape and response to immune checkpoint blockade therapy in lymphoma. Blood. 2020;135:523‐33. [DOI] [PubMed] [Google Scholar]
Associated Data
This section collects any data citations, data availability statements, or supplementary materials included in this article.
Supplementary Materials
Supporting Information
Supporting Information
Supporting Information
Data Availability Statement
Raw data of sequencing is available at the National Omics Data Encyclopedia (NODE, https://www.biosino.org/node/, Project ID: OEP001917).