Abstract
Background
To build an automatic pathological diagnosis model to assess the lymph node metastasis status of head and neck squamous cell carcinoma (HNSCC) based on deep learning algorithms.
Study Design
A retrospective study.
Methods
A diagnostic model integrating two‐step deep learning networks was trained to analyze the metastasis status in 85 images of HNSCC lymph nodes. The diagnostic model was tested in a test set of 21 images with metastasis and 29 images without metastasis. All images were scanned from HNSCC lymph node sections stained with hematoxylin–eosin (HE).
Results
In the test set, the overall accuracy, sensitivity, and specificity of the diagnostic model reached 86%, 100%, and 75.9%, respectively.
Conclusions
Our two‐step diagnostic model can be used to automatically assess the status of HNSCC lymph node metastasis with high sensitivity.
Level of evidence
NA.
Keywords: convolutional neural network, deep learning, digital pathology, head and neck squamous cell carcinoma, lymph node metastasis
In this retrospective study, we developed and tested an automatic two‐step detection model for head and neck squamous cell carcinoma (HNSCC) lymph node metastasis using deep learning. In the test set of 21 pathological images with metastasis and 29 pathological images without metastasis, the sensitivity and specificity of our model reached 100% and 75.9%, respectively. Our results suggest that deep learning can be used to assist the pathological assessment of HNSCC lymph node metastasis.
1. INTRODUCTION
Head and neck cancer is the sixth common malignant disease in the world, most of which are squamous cell carcinoma. 1 The prognosis of patients with head and neck squamous cell carcinoma (HNSCC) is poor owing to treatment metastasis, resistance, and recurrence. 2 , 3 Regional cervical lymph node metastasis is an independent poor prognostic factor for patients with HNSCC. 4 , 5 Therefore, accurate diagnosis of lymph nodes metastasis status is an important part of the staging and grading of HNSCC, guiding clinical decision making, and treatment management. 6 In clinical practice, pathological diagnosis is the gold standard for the evaluation of lymph node metastasis, which was estimated by pathologists. However, manual pathological assessment is an exhausting and subjective task. 7 In particular, micro‐metastases (between 2 mm and 0.2 mm) and isolated cancer cell clusters (<0.2 mm) may be ignored and missed. 8 Immunohistochemistry can improve the accuracy of manual evaluation. However, most HNSCC lymph node sections only stained by hematoxylin–eosin (HE) without immunohistochemical detection due to laboratory technology and costs.
Digital pathology includes the process of digitizing histopathological slices and analyzing these digitized images. Digital pathology is widely used in cancer research, including diagnosis, 9 quantitative analysis, 10 biomarkers prediction, 11 and prognostic evaluation. 12 , 13 Deep learning, especially convolutional neural network (CNN), has performed well in the interpretation of digital pathology images. In CAMELYON16 7 and CAMELYON17 8 challenges, using artificial intelligence algorithms detected metastases from whole slice images (WSIS) of the HE‐stained breast cancer lymph node, deep learning models even showed similar or better diagnostic performance compared with experienced pathologists. Campanella et al. 9 achieved an area under the curve (AUC) of 0.966 in a dataset of 9894 axillary breast cancer lymph nodes WSIS using weakly supervised learning. Therefore, developing artificial intelligence diagnostic models may be an auxiliary method to solve the shortage of pathologists. However, there is currently no research on artificial intelligence diagnosis of HNSCC lymph node pathological slices.
In this study, we aim to use a deep learning method to extract high‐dimensional features from HE‐stained histopathological images to detect tumor tissues in HNSCC lymph nodes, which finally strives to develop a deep learning‐based model to diagnose the metastasis status of HNSCC lymph nodes and annotate the areas of tumor lesions to assist the pathologist.
2. MATERIALS AND METHODS
2.1. Dataset
A total of 135 HE‐stained lymph node histopathological images from 20 HNSCC patients treated with neck lymph node dissection at Xiangya Hospital of Central South University between August 2018 and May 2019 were enrolled in this study. The digitized histopathological images were acquired at ×20 magnification (0.5 μm/pixel on both horizontal and vertical) by the Pannoramic MIDI scanner (3DHISTECH Ltd, Hungary). The labels of the metastatic status of these lymph node images were based on past pathological reports and manual review. According to the surgery date, 85 lymph node histopathological images from the previous 11 patients were used to construct the development set, and the remaining 50 images were used as the test set (Table 1). The study was approved by the Ethic Committee of the Xiangya Hospital of Central South University (IRB: NO2019121187), while informed consent was obtained from the participants in the study.
TABLE 1.
Development set and test set
| Dataset | Patients | Positive lymph node images | Negative lymph node images | Total lymph node images |
|---|---|---|---|---|
| Development set | 11 | 38 | 47 | 85 |
| Test set | 9 | 21 | 29 | 50 |
| Total | 20 | 59 | 76 | 135 |
2.2. CNN‐based primary model
We extracted 40 × 40 pixels patches at 10× magnification (1.0 μm/pixel) as the input unit. All patches containing cancer cells (even if only one cancer cell) were labeled with “tumor”, and the remaining patches were labeled with “nontumor” (Figure 1A). The “nontumor” patches dataset included noncancerous areas from negative lymph node images and positive lymph node images. It should be noted that necrotic tissue and tumor‐associated stroma were also labeled with “nontumor”.
FIGURE 1.
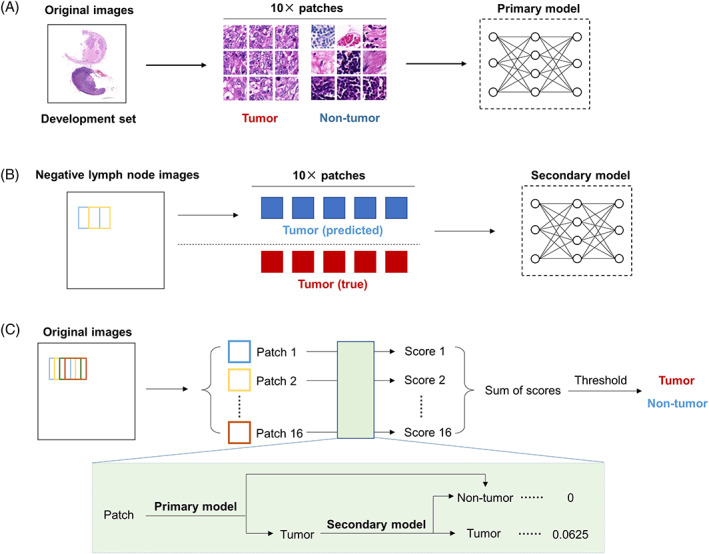
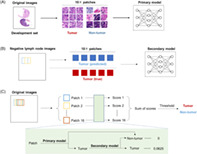
Workflows. (A) Training flowchart of the primary model. (B) Training flowchart of the secondary model. (C) Training flowchart of the integrating diagnostic model based on the primary model and the secondary model
We extracted 16,000 “tumor” patches and 16,000 “nontumor” patches from the development set to train the CNN models (Table S1). The patches of each classification were randomly divided into a training set and a validation set at a ratio of 7:3. Four pretrained CNNs based on the ImageNet database (available at http://www.image-net.org/) were trained to classify “tumor” patches from “nontumor” patches: GoogLeNet, 14 MobileNet‐v2, 15 ResNet50, 16 and ResNet101. 16 To increase the generalization and robustness of the model, we augmented the training set by eight times, by rotating (clockwise rotation at 0°, 90°, 180°, and 270°), flipping (in the horizontal or vertical), and combination of these operations. In the training procession, we used the adaptive moment estimation (ADAM) optimizer 17 to update the gradient. The initial learning rate was set to 0.001 and was reduced by a factor of 0.1 after every 10 epochs. The mini‐batch size was 128, and the maximum number of epochs was 30 (the maximum number of training iterations was 42,000). L2 regularization and early stopping mechanism were used to reduce overfitting. The accuracy and the AUC of the receiver operating characteristic curve (ROC) were used to evaluate the classification performance. 18
2.3. Visualization of whole lymph node images based on the primary model
We defined a sliding window with a size of 40 × 40 pixels, nonoverlapping sampling along with the horizontal and vertical directions on the whole lymph node image at 10x magnification. The obtained patches were input into the primary model. If the predicted label was “tumor”, it was marked in red at the corresponding position of the lymph node image, otherwise, it was marked in white. We merged the generated images on the original images to visualize the detection results of the whole lymph node images in the development set by the primary model. The primary model misidentified some negative regions as “tumor”, such as lymphoid follicles and sinus cavities.
2.4. CNN‐based secondary model
To reduce false‐positive recognition of the primary model, we analyzed all negative lymph node images in the development set with the primary model. To extract more false‐positive patches, we adopted partial overlapping sampling with 20 pixels as a sliding length (Figure 1B). In this way, a total of 10,137 false‐positive patches were obtained and were labeled with “nontumor”. Then, 10,137 actual “tumor” patches were randomly selected from the primary model dataset and were used to develop the secondary model with those false positive patches. MobileNet‐v2 was used to train the secondary model, which achieved the best performance in the primary classification (Table 2). Similarly, 70% of the image patches were randomly divided into the training set and were augmented, and the rest constituted the validation set (Table S2). The training options and evaluation methods of the second model were roughly the same as those of the primary model.
TABLE 2.
Basic characteristics and performance of the four CNNs for classification of the image patches in the validation set
| Networks | Depth | Number of parameters (million) | Accuracy (%) | AUC |
|---|---|---|---|---|
| GoogLeNet | 22 | 7.0 | 97.3 | 0.9957 |
| MobileNet‐v2 | 53 | 3.5 | 98.7 | 0.9982 |
| ResNet50 | 50 | 25.6 | 98.1 | 0.9974 |
| ResNet101 | 101 | 44.6 | 97.9 | 0.9975 |
Abbreviations: AUC, area under the curve; CNN, convolutional neural network.
2.5. Lymph node metastasis classification
First, we delineated a tumor probability score heat map of a whole lymph node image. As shown in Figure 1C, a 40 × 40 pixels sliding window continuously cropped image patches in horizontal and vertical directions with steps of 10 pixels. In this way, each pixel, except for the edge area with a width of 30 pixels, was analyzed by 16 times in different patches. Further, the image edge areas (without tissue) were eventually removed. The initial value of the tumor probability score for each pixel was 0. As shown in Figure 1C, a combination of the primary model and the secondary model was used to calculate the tumor probability score for each patch. Specifically, if a patch was recognized as “tumor” by the primary model, then the patch would be entered into the secondary model; otherwise, the patch would be directly labeled as “nontumor”. Furthermore, if a patch was finally recognized as “tumor”, then the tumor probability scores of all pixels located on this patch would be increased by 0.0625; otherwise, the scores would plus 0. Finally, the tumor probability score heat maps of the lymph node images were obtained. Areas with higher scores are more likely to include tumor cells.
Then, we analyzed the distribution characteristics of tumor probability scores of negative and positive lymph nodes in the development set. Finally, the score threshold was set to 0.6875 to classify positive and negative lymph nodes. Images with total scores not less than the threshold were defined as positive; otherwise, the lymph node images were diagnosed as negative. The classification performance of this threshold was tested in the test set. Next, we analyzed the performance of the score threshold in the detection of metastatic lesions.
2.6. Statistics
All CNN models were trained on a desktop workstation with a NVIDIA GeForce RTX 2060 super GPU. The statistical analysis and algorithms in this study carried out with MATLAB® (version R2020a). We used the Deep Network Designer app for loading and editing pretrained networks on MATLAB®. On MATLAB, the plotconfusion function was used to plot classification confusion matrix. The perfcurve function was used for plotting ROC curve and calculating AUC. The performance of the primary model and secondary model were evaluated by confusion matrix and AUC. 18 , 19 The classification performance of lymph node metastasis status is evaluated with sensitivity, specificity, and accuracy. 19
3. RESULTS
3.1. CNNs can distinguish “tumor” patches from “nontumor” patches
The information of patients and lymph node images was shown in Table 1. Four common pretrained CNNs were trained to classify “tumor” patches from “nontumor” patches in the training set (Figure 1A and Table S1): GoogLeNet, MobileNet‐v2, ResNet50, and ResNet101. Then, we evaluated their performance in the validation set. The accuracy of four CNNs all exceed 97%, and the AUCs all exceed 0.99 (Table 2 and Figure S1). These results showed that CNNs could classify “tumor” patches from “nontumor” patches. In particular, the MobileNet‐v2‐based model achieved a classification accuracy of 98.7% and an AUC of 0.9982, both of which were the best among the four models (Table 2 and Figure S1). Hence, we chose the MobileNet‐v2‐based model as the primary model to analyze the whole lymph node histopathological images.
3.2. Hard negative regions are incorrectly detected in the whole lymph node images
We next applied the MobileNet‐v2‐based primary model to analyze large‐scale lymph node images in the development set. Reviewing the original images and the visual images, almost all areas of metastasis could be effectively detected. A positive example was presented in Figure 2A. However, we noticed that part of normal lymph node tissues, especially lymphoid follicles and sinus cavities, were misclassified as tumor tissues, as shown in Figure 2B. These misclassifications might lead to misdiagnosis of the lymph nodes. Therefore, we needed to improve the model's classification performance for these normal tissues that were difficult to identify.
FIGURE 2.
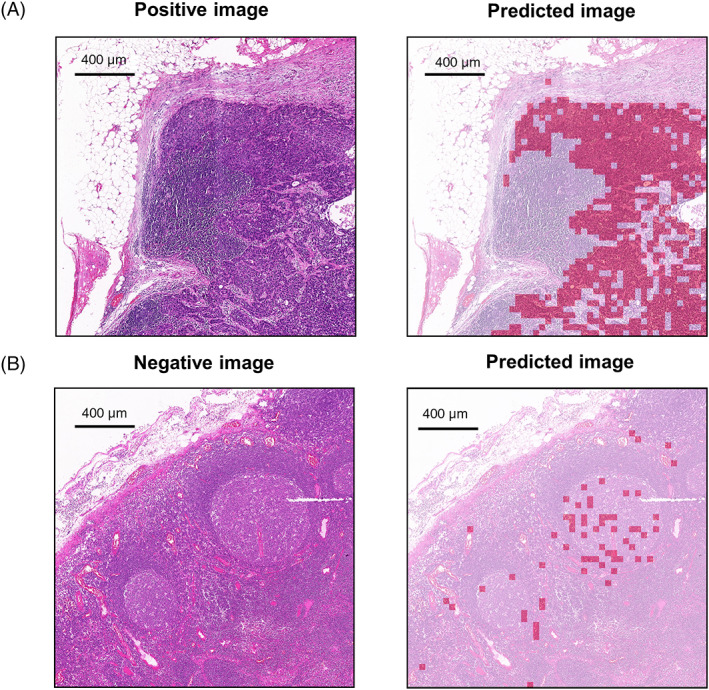
Visualization of large‐scale lymph node histopathological images analyzed by the primary model. Here are representative examples of correct (A) and incorrect (B) annotation of large‐scale lymph node images in the training set using the primary model with a sliding window of 40 × 40 pixels. The original images are on the left. The merged images are on the right. The area predicted to be tumor is marked in red. The area predicted to be nontumor is marked in white
3.3. The secondary model can improve the classification of hard negative patches by the primary model
Misclassifications of lymphoid follicles and sinus cavities were common problems in artificial intelligence detection of lymph node metastases. To improve the classification performance of the diagnostic model for these regions, we constructed a new data set to train the MobileNet‐v2‐based secondary model, consisting of 10,137 misidentified “nontumor” patches and 10,137 randomly matched “tumor” patches (Table S2). The accuracy and AUC of the secondary model in the validation set arrived 96.3% and 0.9933, respectively (Figures 3 and S2).
FIGURE 3.
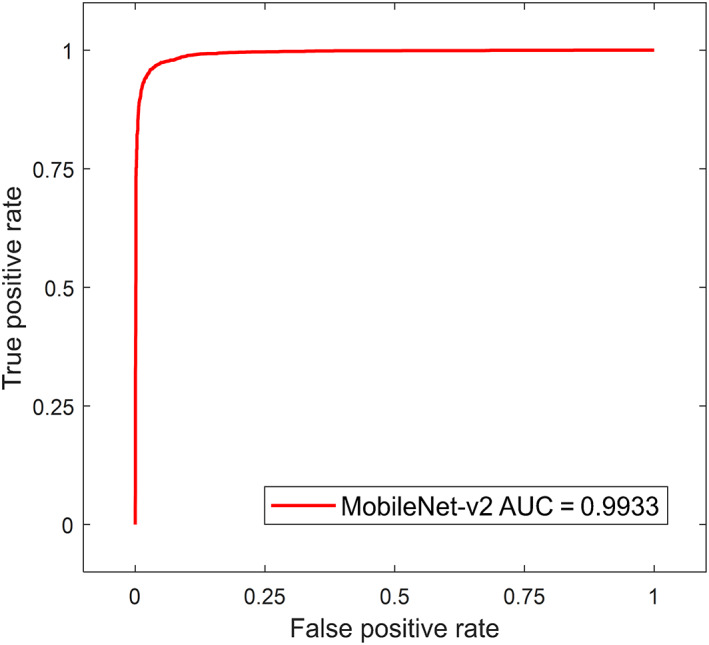
ROC of the secondary model. AUC, area under the curve; ROC, receiver operating characteristic curve
3.4. The diagnostic model can exclude approximately three‐quarters of the negative lymph node images while maintaining 100% sensitivity in the test set
Furthermore, we evaluated whether these models could be used to diagnose metastasis status of whole lymph node images. An algorithm was built to make the tumor possibility score heat maps of whole lymph node images using patches‐based classification CNN models (Figure 1C). The distribution characteristics of tumor probability scores in the development set and the test set were shown in Figures 3B and 4A, respectively. In the development set, all positive lymph node images included areas with a score not lower than 0.9375, and the scores of all lymph node negative images were less than 0.6875 (Figure 4A and Table 3). Lymph node images with tumor scores not less than 0.6875 were classified as positive, otherwise, they were classified as negative. We next evaluated the classification performance of the threshold in the test set, as shown in Figure 4B and Table 3, the classification model achieved a sensitivity of 100% and a specificity of 75.9% in the test set.
FIGURE 4.
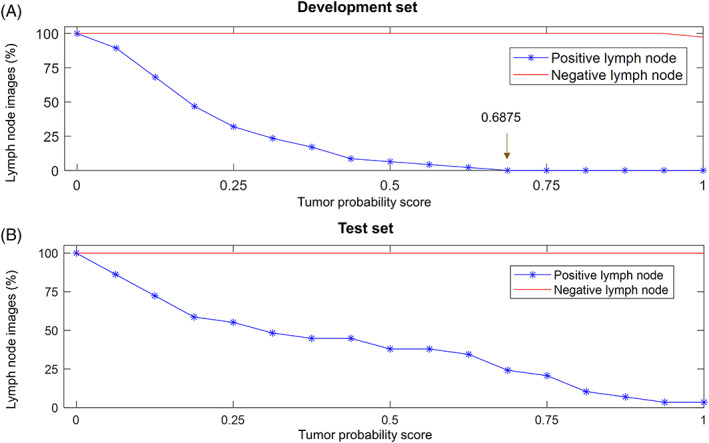
Distribution of tumor probability scores. (A) Distribution of tumor probability scores in the development set. When the score threshold is between 0.6875 and 1, the sensitivity and specificity of the model are both 100%. We set the score threshold to 0.6875 of the lower bound. This means that the area with a score not lower than 0.6875 will be marked as metastatic disease, otherwise, it will be marked as normal tissue. (B) Distribution of tumor probability scores in the test set
TABLE 3.
Performance of the integrating diagnostic model
| Datasets | Threshold = 0.6875 | ||
|---|---|---|---|
| Sensitivity | Specificity | Accuracy | |
| Development set | 38/38 (100%) | 47/47 (100%) | 85/85 (100%) |
| Test set | 21/21 (100%) | 22/29 (75.9%) | 43/50 (86%) |
Next, we analyzed the similarity between the area of the lymph node image where the tumor score was not lower than the threshold and the true metastatic disease area. Our results indicated that the model annotated the main metastatic lesions and excluded most of the nontumor areas in the development set and the test set (Figure 5). Interestingly, cancer cell clusters smaller than 200 microns were also occasionally detected (Figure 5A). However, there were still six false‐positive lymph node images and local false‐negative areas for pixel‐level metastasis detection (Figure S3). Nevertheless, no positive lymph node images were classified as negative.
FIGURE 5.
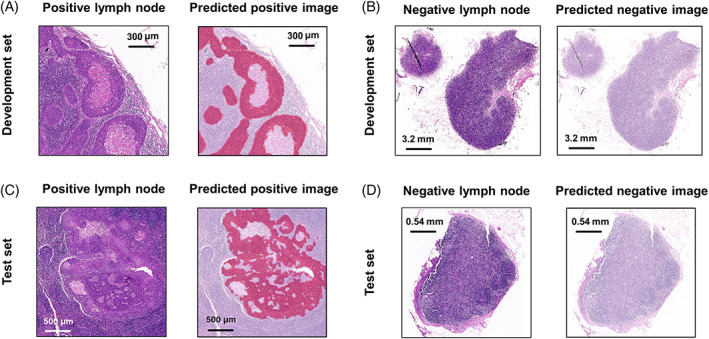
Representative examples of the delineation of metastatic lesions by the diagnostic model. The areas detected as metastatic lesions are marked in red. The area detected as normal tissue is marked in white. (A) The metastatic lesions with accurate segmentation in the development set. (B) A correctly classified negative lymph node in the development set. (C) The metastatic lesions with accurate segmentation in the test set. (D) A correctly classified negative lymph node in the test set
4. DISCUSSION
Previous studies have reported the application of artificial intelligence to detect lymph node metastasis in breast cancer, 7 , 8 , 9 lung cancer, 20 colorectal cancer, 21 and so on. Recently, there are some radiomics studies to predict HNSCC lymph node metastasis 22 or extranodal extension 23 from lymph node computed tomography (CT) imaging. However, the disadvantage is that only large enough lymph nodes can be detected from CT. A study predicts the presence or absence of lymph node metastasis from early‐stage oral tongue squamous cell carcinoma clinical and primary tumor pathology records, but it is impossible to evaluate specific individual lymph nodes. 24 In this pilot study, we developed a CNN‐based HNSCC lymph node diagnosis model and tested the classification performance on a dataset based on the images with or without metastasis. Our data indicate that this model can diagnose all positive lymph node images and exclude approximately three‐quarters of negative lymph node images. To our knowledge, this is the first application of deep learning from cervical lymph nodes HE‐stained pathological images in the prediction of lymph node metastasis in patients with HNSCC.
One advantage of this study is that we developed a secondary model to reduce the false positive recognition of hard negative regions. The primary model based on MobileNet‐v2 achieved an accuracy of 98.7% and an AUC of 0.9982 in the patches classification in the validation set; however, when analyzing in large‐scale images, some hard negative areas were identified as metastatic lesions, mainly located in lymphoid follicles and sinus cavities. This is a common phenomenon in the development of artificial intelligence models for lymph nodes in other malignancies, 7 , 8 which may be caused by a low proportion of hard negative patches in the training set. Therefore, researchers often used hard negative mining to increase the proportion of these hard negative patches in the training set. 7 , 8 Previous study in lung cancer has trained an additional model to eliminate lymphoid follicles in lymph node to reduce the false positive detection, 20 however, the hard negative areas apart from the lymphoid follicles were ignored in this model. In our study, we re‐collected these misclassified patches to train a secondary model to analyze the patches defined by the primary model as “tumor”, to improve the classification performance between tumor and hard negative regions.
Common postprocessing methods in the lymph node‐based classification include training new machine learning models and setting lesion size thresholds based on the generated probability heat maps. 8 , 20 In a previous study, the specificity of the artificial intelligence detection model without postprocessing was even 0. 20 However, postprocessing might cause false‐negative results. In the CAMELYON17 Challenge, the best model even classified 4 macro‐metastasis (larger than 2 mm) WSIS as negative. 8 A previous study set the threshold of positive lesion size to 0.6 mm and 0.7 mm, and the final sensitivity was 79.6% and 75.5%, respectively. 20 In clinical practice, it is often unacceptable for the missed diagnosis of positive lymph nodes in malignancies. 9 In our study, we calculated the tumor score by partially overlapping sampling and selected the score threshold to diagnose the status of lymph node metastasis based on the difference between the tumor score in positive and negative images. Our model can screen out a large number of negative lymph nodes with a sensitivity of 100% in our test set, freeing the pathologist to focus on the diagnosis of difficult slices. Meanwhile, as for lymph nodes that are diagnosed as positive by the model, pathologists also need to be cautious to distinguish malignant lesions from false‐positive identifications.
Next, we analyzed the role of the score threshold in annotating metastatic lesions. In many cases, the annotated lesions were basically consistent with the actual lesions, and even some tumor cell clusters smaller than 0.1 mm were also marked. In addition, the model identified the most negative lymph node images. We have to mention that some tumor tissues were ignored by the score threshold. As shown in Figure S3A,B, these metastatic lesions were not completely marked. Nevertheless, these false‐negative phenomena did not lead to the missing of diagnosis in our test set. Increasing the number of patches that include only a few tumor cells in the training set may improve the performance of the model. These results indicate that the threshold in the pixel‐wise detection for metastatic lesions still needs to be improved and it is necessary to further validate the performance of the model in the lymph node slices with micro‐metastases and isolated cancer cell clusters.
Focusing on the false‐positive lymph node images in the test set, one of these was predicted with a large area of metastasis (Figure S3C). We noticed that the staining of this lymph node was weaker than most other lymph node images. Color differences are rare in our dataset but cannot be ignored in slices from different institutions. To reduce the interference caused by color differences, common image preprocessing methods including color normalization and color augmentation are required. 7 , 8 , 12 Besides, the rest of the false‐positive lymph node images were marked with only a few scattered tumor spots, mainly located in lymphoid follicles and sinus cavities (Figure S3D).
There are some limitations in our study. Our training samples size is limited, and collected from one institution. A large‐scale multi‐institutional study in future will improve the robustness and generalizability of the model. Another limitation is that this is a retrospective study, and further prospective studies are necessary. Notwithstanding these limitations, this pilot study suggests that it is possible to develop a CNN‐based automatic diagnosis model of HNSCC lymph node metastasis with clinical applications.
5. CONCLUSIONS
In summary, our results suggest that it is possible to automatically detect metastasis from HNSCC lymph node pathological images. In our study, we developed and evaluated a two‐step deep learning model to screen suspected positive HNSCC lymph nodes and outline the regions of interest to assist pathologists. This method reduces false‐positive identification and maintains high sensitivity, but it still cannot replace manual evaluation. Whether this method can be applied to complex clinical practice will still require the further evaluation.
CONFLICT OF INTEREST
The authors have declared no conflicts of interest for this article.
Supporting information
FIGURE S1 Confusion matrices of four CNN pretrained models in the primary model validation set. After training, we evaluated the performance of the four models on the validation set of 4800 “tumor” patches and 4800 “nontumor” patches. (A–D) respectively showed the confusion matrices of GoogLeNet, MobileNet‐v2, ResNet50, and ResNet101 for classifying “tumor” patches from “nontumor” patches.
FIGURE S2 Confusion matrix of the secondary model. Classification of “tumor” patches from “nontumor” patches in the secondary model validation set with 3041 “tumor” patches and 3041 hard “nontumor” patches.
FIGURE S3 Analysis of the false‐negative areas and the false negative images by the diagnostic model. (A) The elongated lesions almost ignored in the development set. The dotted area pointed by the arrow is the actual tumor lesion. (B) The metastasic lesions almost ignored in the test set. The dotted area pointed by the arrow is the actual tumor lesion. (C) A negative lymph node with large false‐positive lesions in the test set. (D) A false‐positive lesion less than 0.1 mm, located in a lymphoid follicle of a negative lymph node in the test set.
TABLE S1 Dataset of primary model.
TABLE S2. Dataset of secondary model.
ACKNOWLEDGMENTS
This study was supported by the National Natural Science Foundation of China (Nos. 81773243, 81772903, 81874133, 81974424, and 82073009), the National Key Research and Development Program of China (Nos. 2020YFC1316900 and 2020YFC1316901), the China Postdoctoral Science Foundation (2021M693565), and the Youth Science Foundation of Xiangya Hospital, Central South University (2020Q03).
Tang H, Li G, Liu C, et al. Diagnosis of lymph node metastasis in head and neck squamous cell carcinoma using deep learning. Laryngoscope Investigative Otolaryngology. 2022;7(1):161‐169. doi: 10.1002/lio2.742
Haosheng Tang and Guo Li contributed equally to this study.
Funding information China Postdoctoral Science Foundation, Grant/Award Number: 2021M693565; National Key Research and Development Program of China, Grant/Award Numbers: 2020YFC1316900, 2020YFC1316901; National Natural Science Foundation of China, Grant/Award Numbers: 81772903, 81773243, 81874133, 81974424, 82073009; Youth Science Foundation of Xiangya Hospital, Grant/Award Number: 2020Q03
Contributor Information
Yuanzheng Qiu, Email: xyqyz@hotmail.com.
Yong Liu, Email: liuyongent@csu.edu.cn.
REFERENCES
- 1. Bray F, Ferlay J, Soerjomataram I, Siegel RL, Torre LA, Jemal A. Global cancer statistics 2018: GLOBOCAN estimates of incidence and mortality worldwide for 36 cancers in 185 countries. CA Cancer J Clin. 2018;68(6):394‐424. 10.3322/caac.21492. [DOI] [PubMed] [Google Scholar]
- 2. Chow LQM. Head and neck cancer. N Engl J Med. 2020;382(1):60‐72. 10.1056/NEJMra1715715. [DOI] [PubMed] [Google Scholar]
- 3. Johnson DE, Burtness B, Leemans CR, Lui VWY, Bauman JE, Grandis JR. Head and neck squamous cell carcinoma. Nat Rev Dis Primers. 2020;6(1):92. 10.1038/s41572-020-00224-3. [DOI] [PMC free article] [PubMed] [Google Scholar]
- 4. Mamelle G, Pampurik J, Luboinski B, Lancar R, Lusinchi A, Bosq J. Lymph node prognostic factors in head and neck squamous cell carcinomas. Am J Surg. 1994;168(5):494‐498. 10.1016/s0002-9610(05)80109-6. [DOI] [PubMed] [Google Scholar]
- 5. Roberts TJ, Colevas AD, Hara W, Holsinger FC, Oakley‐Girvan I, Divi V. Number of positive nodes is superior to the lymph node ratio and American joint committee on cancer N staging for the prognosis of surgically treated head and neck squamous cell carcinomas. Cancer. 2016;122(9):1388‐1397. 10.1002/cncr.29932. [DOI] [PubMed] [Google Scholar]
- 6. Lydiatt WM, Patel SG, O'Sullivan B, et al. Head and neck cancers‐major changes in the American joint committee on cancer eighth edition cancer staging manual. CA Cancer J Clin. 2017;67(2):122‐137. 10.3322/caac.21389. [DOI] [PubMed] [Google Scholar]
- 7. Ehteshami Bejnordi B, Veta M, Johannes van Diest P, et al. Diagnostic assessment of deep learning algorithms for detection of lymph node metastases in women with breast cancer. JAMA. 2017;318(22):2199‐2210. 10.1001/jama.2017.14585. [DOI] [PMC free article] [PubMed] [Google Scholar]
- 8. Bandi P, Geessink O, Manson Q, , et al. From detection of individual metastases to classification of lymph node status at the patient level: the CAMELYON17 challenge. IEEE Trans Med Imaging. 2019;38(2):550‐560. 10.1109/TMI.2018.2867350. [DOI] [PubMed] [Google Scholar]
- 9. Campanella G, Hanna MG, Geneslaw L, et al. Clinical‐grade computational pathology using weakly supervised deep learning on whole slide images. Nat Med. 2019;25(8):1301‐1309. 10.1038/s41591-019-0508-1. [DOI] [PMC free article] [PubMed] [Google Scholar]
- 10. Reichling C, Taieb J, Derangere V, et al. Artificial intelligence‐guided tissue analysis combined with immune infiltrate assessment predicts stage III colon cancer outcomes in PETACC08 study. Gut. 2020;69(4):681‐690. 10.1136/gutjnl-2019-319292. [DOI] [PMC free article] [PubMed] [Google Scholar]
- 11. Liao H, Long Y, Han R, et al. Deep learning‐based classification and mutation prediction from histopathological images of hepatocellular carcinoma. Clin Transl Med. 2020;10(2):e102. 10.1002/ctm2.102. [DOI] [PMC free article] [PubMed] [Google Scholar]
- 12. Kather JN, Krisam J, Charoentong P, et al. Predicting survival from colorectal cancer histology slides using deep learning: a retrospective multicenter study. PLoS Med. 2019;16(1):e1002730. 10.1371/journal.pmed.1002730. [DOI] [PMC free article] [PubMed] [Google Scholar]
- 13. Skrede OJ, De Raedt S, Kleppe A, et al. Deep learning for prediction of colorectal cancer outcome: a discovery and validation study. Lancet. 2020;395(10221):350‐360. 10.1016/S0140-6736(19)32998-8. [DOI] [PubMed] [Google Scholar]
- 14. Szegedy C, Liu W, Jia YQ, et al. Going deeper with convolutions. Paper presented at: 2015 IEEE Conference on Computer Vision and Pattern Recognition; 2015:7‐12. 10.1109/CVPR.2015.7298594. [DOI]
- 15. Sandler M, Howard A, Zhu ML, et al. MobileNetV2: inverted residuals and linear bottlenecks. Paper presented at: 2018 IEEE Conference on Computer Vision and Pattern Recognition; 2018:4510‐4520. 10.1109/CVPR.2018.00474. [DOI]
- 16. He KM, Zhang XY, Ren SQ, Sun J. Deep residual learning for image recognition. Paper presented at: 2016 IEEE Conference on Computer Vision and Pattern Recognition (CVPR); 2016:770‐778. 10.1109/CVPR.2016.90. [DOI]
- 17. Kingma DP & Ba J. Adam: A Method for Stochastic Optimization. arXiv. 2014. Pre‐print. https://arxiv.org/abs/1412.6980.
- 18. Zweig MH, Campbell G. Receiver‐operating characteristic (ROC) plots: a fundamental evaluation tool in clinical medicine. Clin Chem. 1993;39(4):561‐577. 10.1093/clinchem/39.4.561. [DOI] [PubMed] [Google Scholar]
- 19. Sokolova M, Lapalme G. A systematic analysis of performance measures for classification tasks. Inf Process Manag. 2009;45(4):427‐437. 10.1016/j.ipm.2009.03.002. [DOI] [Google Scholar]
- 20. Pham HHN, Futakuchi M, Bychkov A, Furukawa T, Kuroda K, Fukuoka J. Detection of lung cancer lymph node metastases from whole‐slide histopathologic images using a two‐step deep learning approach. Am J Pathol. 2019;189(12):2428‐2439. 10.1016/j.ajpath.2019.08.014. [DOI] [PubMed] [Google Scholar]
- 21. Chuang WY, Chen CC, Yu WH, et al. Identification of nodal micrometastasis in colorectal cancer using deep learning on annotation‐free whole‐slide images. Mod Pathol. 2021;34(10):1901–1911. 10.1038/s41379-021-00838-2. [DOI] [PMC free article] [PubMed] [Google Scholar]
- 22. Ariji Y, Fukuda M, Nozawa M, et al. Automatic detection of cervical lymph nodes in patients with oral squamous cell carcinoma using a deep learning technique: a preliminary study. Oral Radiol. 2021;37(2):290‐296. 10.1007/s11282-020-00449-8. [DOI] [PubMed] [Google Scholar]
- 23. Kann BH, Hicks DF, Payabvash S, et al. Multi‐institutional validation of deep learning for pretreatment identification of extranodal extension in head and neck squamous cell carcinoma. J Clin Oncol. 2020;38(12):1304‐1311. 10.1200/JCO.19.02031. [DOI] [PubMed] [Google Scholar]
- 24. Shan J, Jiang R, Chen X, et al. Machine learning predicts lymph node metastasis in early‐stage oral tongue squamous cell carcinoma. J Oral Maxillofac Surg. 2020;78(12):2208‐2218. 10.1016/j.joms.2020.06.015. [DOI] [PubMed] [Google Scholar]
Associated Data
This section collects any data citations, data availability statements, or supplementary materials included in this article.
Supplementary Materials
FIGURE S1 Confusion matrices of four CNN pretrained models in the primary model validation set. After training, we evaluated the performance of the four models on the validation set of 4800 “tumor” patches and 4800 “nontumor” patches. (A–D) respectively showed the confusion matrices of GoogLeNet, MobileNet‐v2, ResNet50, and ResNet101 for classifying “tumor” patches from “nontumor” patches.
FIGURE S2 Confusion matrix of the secondary model. Classification of “tumor” patches from “nontumor” patches in the secondary model validation set with 3041 “tumor” patches and 3041 hard “nontumor” patches.
FIGURE S3 Analysis of the false‐negative areas and the false negative images by the diagnostic model. (A) The elongated lesions almost ignored in the development set. The dotted area pointed by the arrow is the actual tumor lesion. (B) The metastasic lesions almost ignored in the test set. The dotted area pointed by the arrow is the actual tumor lesion. (C) A negative lymph node with large false‐positive lesions in the test set. (D) A false‐positive lesion less than 0.1 mm, located in a lymphoid follicle of a negative lymph node in the test set.
TABLE S1 Dataset of primary model.
TABLE S2. Dataset of secondary model.


