

Abstract
Background
Complications from liver cirrhosis are a leading cause of death in children with cystic fibrosis. Identifying children at risk for developing liver cirrhosis and halting its progression are critical to reducing liver-associated mortality.
Objective
Quantitative US imaging, such as shear-wave elastography (SWE), might improve the detection of liver fibrosis in children with cystic fibrosis (CF) over gray-scale US alone. We incorporated SWE in our pediatric CF liver disease screening program and evaluated its performance using magnetic resonance (MR) elastography.
Materials and methods
Ninety-four children and adolescents with CF underwent 178 SWE exams, aspartate aminotransferase (AST), alanine aminotransferase (ALT), gamma-glutamyl transferase (GGT) and platelet measurements. Of these, 27 children underwent 34 MR elastography exams. We evaluated SWE performance using 6-MHz and 9-MHZ point SWE, and 9-MHz two-dimensional (2-D) SWE.
Results
The 6-MHz point SWE was the only method that correlated with MR elastography (r=0.52; 95% confidence interval [CI] 0.20–0.74; P=0.003). SWE of 1.45 m/s distinguished normal from abnormal MR elastography (79% sensitivity, 100% specificity, 100% positive predictive value [PPV], 55% negative predictive value [NPV], area under the receiver operating characteristic [AUROC] curve 0.94). SWE of 1.84 m/s separated mild–moderate (3.00–4.77 kPa) from severe (>4.77 kPa) MR elastography (88% sensitivity, 86% specificity, 78% PPV, 93% NPV, AUROC 0.79). Elevations of AST, ALT, GGT and thrombocytopenia were associated with higher SWE. AST-to-platelet ratio index of 0.42, fibrosis-4 of 0.29, and GGT-to-platelet ratio of 1.43 all had >95% NPV for SWE >1.84 m/s.
Conclusion
Given its correlation with MR elastography, SWE might be a clinically useful predictor of liver fibrosis. We identified imaging criteria delineating the use of SWE to identify increased liver stiffness in children with CF. With multicenter validation, these data might be used to improve the detection and monitoring of liver fibrosis in children with CF.
Keywords: Adolescents, Children, Cystic fibrosis, Cystic fibrosis liver disease, Liver, Magnetic resonance elastography, Shear-wave elastography, Stiffness, Ultrasound
Introduction
Therapeutic advancements in cystic fibrosis (CF) have substantially increased life expectancy over the last two decades. Lung failure remains the most common cause of mortality; however, complications from liver cirrhosis are the next leading cause of death in CF [1]. Identifying children at risk for developing liver cirrhosis and halting the progression to portal hypertension and liver failure is critical to reducing liver-associated mortality. Similarly, developing tools to detect and monitor liver fibrosis, an intermediary step in the development of cirrhosis, is vital to studying potential interventional therapies [2].
The Cystic Fibrosis Foundation and European liver disease screening guidelines recommend annual measurement of serum aspartate aminotransferase (AST), alanine aminotransferase (ALT), gamma-glutamyl transferase (GGT), bilirubin and alkaline phosphatase [3, 4]. Unfortunately, given the heterogeneous pathogenesis of cirrhosis in CF, labs alone often fail to identify children with mild liver fibrosis prior to the onset of cirrhosis. Liver nodularity identified by transabdominal US correlates with fibrosis seen on histopathology but its assessment is confounded by inter- and intra-observer variability [5]. Quantitative US tools, such as transient elastography or shear-wave elastography (SWE), have been investigated as a way to fill this gap by directly measuring tissue stiffness. Despite several research studies examining US elastography for liver assessment in CF [6–8], no consensus exists regarding its clinical use in CF liver disease screening protocols.
Magnetic resonance (MR) elastography is increasingly being used to evaluate for liver fibrosis in children with CF. While MR elastography has not been validated against liver biopsies specifically for CF, it has been validated in other liver diseases, where it correlates well with METAVIR and Ludwig fibrosis scoring systems [9, 10]. In light of the poor sensitivity and invasiveness of liver biopsies in CF liver disease [11], many CF hepatologists use MR elastography to characterize liver pathology. Our CF center undertook a quality-improvement initiative to increase the detection of CF liver disease. Previously, we identified an algorithm integrating gray-scale US into our CF liver disease screening protocol [6]. In the current study, we examined the use of acoustic radiation force impulse (ARFI) SWE in CF liver disease screening, with a focus on its correlation with MR elastography in children and adolescents with CF. We performed additional analysis correlating serum liver function tests and liver fibrosis indices to SWE and examined, in detail, their correlation with SWE and MR elastography.
Materials and methods
Patients
Gray-scale US with Doppler and ARFI exams were performed in children and adolescents ages 6 years and older with CF with exocrine pancreatic insufficiency. These children were being cared for at a Cystic Fibrosis Foundation–accredited pediatric CF center within a tertiary-care pediatric academic medical center, as part of a quality-improvement initiative to increase the detection of CF-associated liver disease. Our institution determined this study to be exempt from institutional review board (IRB) oversight. Subsequent MR elastography was performed on children with clinical concerns for liver fibrosis/cirrhosis (e.g., nodularity, splenomegaly or evidence of portal hypertension on US, or SWE >1.5 m/s based on internal validation studies in non-CF liver disease), or other clinical need, according to standard clinical practice. Data were gathered from evaluations between November 2015 and February 2019. Retrospective review of clinical data was approved under an IRB-approved protocol (IRB #11197).
Ultrasound evaluation
Ultrasound exams were performed using an Acuson S3000 (Siemens Medical Solutions USA, Malvern, PA) and were read by pediatric radiologists at a tertiary-care pediatric academic hospital according to standard clinical care guidelines. Patients had nothing to eat or drink for at least 4 h prior to the exam. Measurements were obtained during a breath-hold as part of relaxed breathing (Valsalva maneuvers were not used). US results were categorized based on gray-scale liver echotexture and morphology (normal, echogenic or nodular), similar to our prior study [6]. ARFI SWE was performed through a right intercostal approach, with measurements 2–4 cm deep in segment VIII of the liver. Acquisitions were obtained using a linear 9L4 probe in point SWE and in two-dimensional (2-D) SWE mode at 9 MHz, and a curved 6C1 probe in point SWE mode at 6 MHz. Ten distinct measurements were obtained in each of the three modes. Rarely, the number of measurements was limited by patient cooperation. Only studies with ≥5 measurements were included.
Magnetic resonance elastography
Magnetic resonance imaging exams were performed using a 3.0-T scanner with a 32-channel cardiac coil (GE Healthcare, Waukesha, WI). Children fasted for at least 4 h before exams. Multiplanar, multisequence MR images of the abdomen were obtained for each child, with post-contrast images obtained following infusion of gadobenate dimeglumine (MultiHance; Bracco Diagnostics, Milan, Italy) or gadobutrol (Gadavist; Bayer Healthcare Pharmaceuticals, Leverkusen, Germany) gadolinium contrast agent. Echoplanar imaging (EPI) MR elastography was performed using a 60-Hz transducer placed on the abdomen. Protocol parameters were as follows: echo time (TE) 53.5 ms, field of view 42 x 42 cm, slice thickness 7 mm, reconstruction matrix 64 x 64. At least four measurements were obtained during breath-hold to generate a mean of means (normalized to region-of-interest size). Wave propagation maps were converted to kPa and were read by pediatric radiologists at the same tertiary-care pediatric academic hospital according to standard clinical care guidelines. We used the following kPa cutoff values to classify patients: normal (<3.0 kPa), mild–moderate (3.00–4.77 kPa) and severe (>4.77 kPa) [12–14].
Liver function tests, fibrosis indices and fibrosis biomarkers
Serum AST, ALT, GGT and platelets were obtained as part of routine clinical care; for analysis, we used the laboratory measurement closest to the date on which MR elastography was performed. For AST, ALT and GGT, we used CALIPER upper limit of normal values [6, 15, 16]. The lower limit of normal for platelets was 150 x 103/μL. Laboratory studies were excluded from analysis if abnormalities were attributable to medication side effects (e.g., lumacaftor/ivacaftor, voriconazole) with no abnormalities on imaging (5% of US exams). Fibrosis indices were calculated according to published formulas [17–19].
Statistics
We calculated mean, median and standard deviation (SD). To generate graphs and multivariate analysis, we used Prism 8 (GraphPad Software, San Diego, CA). We calculated sensitivity, specificity, positive predictive value (PPV), negative predictive value (NPV), Youden index optimal cutoff and area under the receiver operating characteristic (AUROC) curve using easyROC [20]. Significance was determined by P-values<0.05 using one-tailed unpaired Student’s t-test, chi-squared test or the cocor package in R to compare the significance of differences between correlations [21].
Results
Study cohort
During the study period, 94 children and adolescents received 178 US exams with SWE, an average of 1.9 per patient (range 1–6 exams). From these, 27 patients underwent a total of 34 SWE and MR elastography exams (Fig. 1). The median age in this group was 13 years (range 3–21 years); 46% were male. There was no difference in percentage predicted forced expiratory volume in 1 second (FEV1) or body mass index (BMI) among any of the groups. Most patients fell into the mild–moderate group (50%, 17/34), with the remaining evenly split between normal (24%, 8/34) and severe (26%, 9/34) groups. Liver nodularity and splenomegaly detected by US were significantly more frequent in the severe group than in the normal group (89% vs. 29%, P=0.008, and 78% vs. 29%, P=0.030, respectively). Ursodeoxycholic acid use was more prevalent in the mild–moderate and severe groups compared to the normal group (35% and 89% vs. 14%, P=0.002) (Table 1).
Fig. 1.
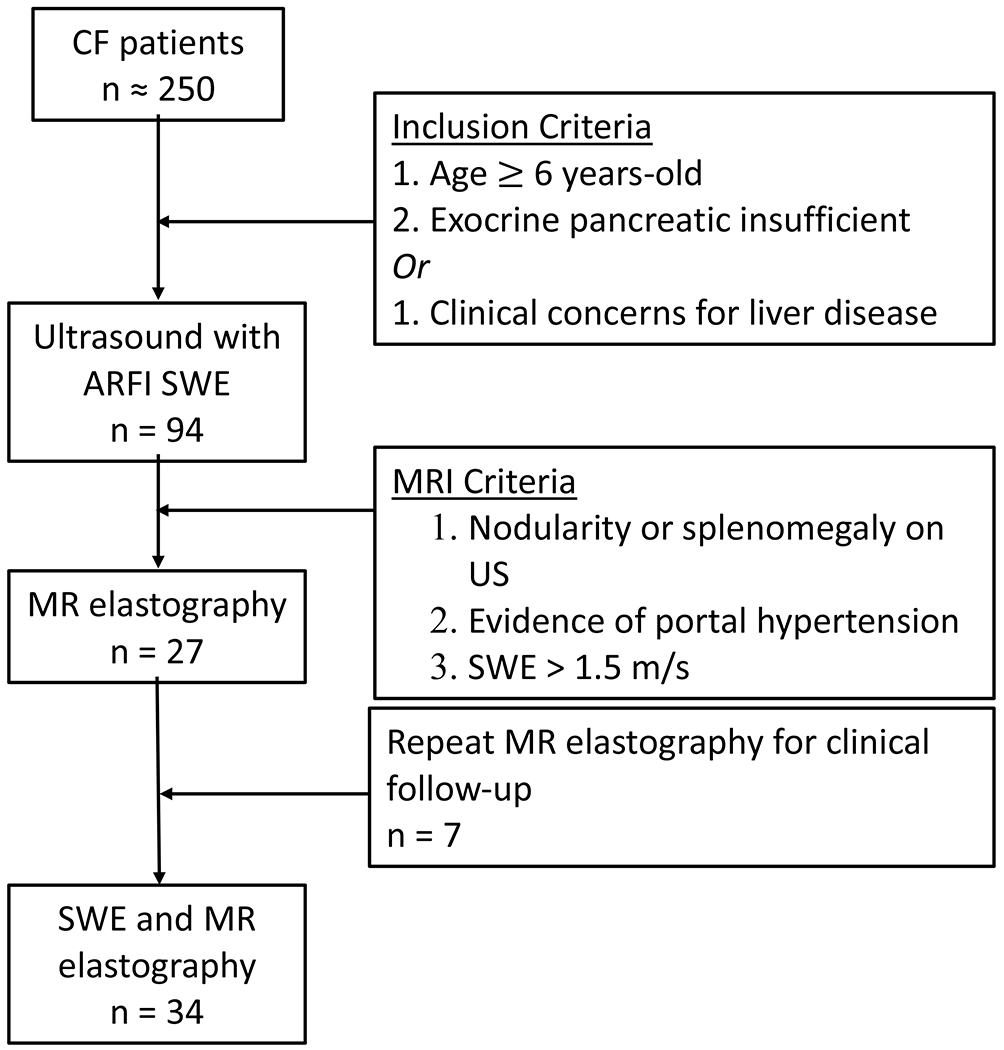
Flow diagram depicts the use of shear-wave elastography (SWE) and magnetic resonance (MR) elastography to evaluate children with cystic fibrosis who suspected of having liver fibrosis. ARFI acoustic radiation force impulse, CF cystic fibrosis
Table 1.
Clinical, US, and MRI characteristics of CF patients studied
| All Patients | Subset with US and MR Elastography | |||
|---|---|---|---|---|
| Normal | Mild-Moderate | Severe | ||
| Patients (n) | 178 | 8 | 17 | 9 |
| Gender (F/M) | 94/84 | 3/5 | 8/9 | 7/2 |
| Age (Years) | 13 ± 4 | 12 ± 4 | 13 ± 4 | 11 ± 4 |
| BMI (Percentile) | 50.5 ± 22.4 | 53.7 ± 21.1 | 53.6 ± 21.0 | 48.8 ± 17.5 |
| FEV1 (% Predicted) | 86 ± 21 | 85 ± 23 | 84 ± 22 | 85 ± 17 |
| On Ursodeoxycholic acid (%) | 14 | 13 | 35 | 89* |
| Hepatomegaly (%) | 17 | 25 | 29 | 0* |
| Splenomegaly (%) | 22 | 25 | 47 | 78* |
| Normal Echotexture (%) | 53 | 57 | 29 | 0* |
| Echogenic Echotexture (%) | 30 | 25 | 35 | 11 |
| Nodular-Appearing Morphology (%) | 17 | 25 | 35 | 89* |
| Days Between Labs and US | 37 ± 47 | - | - | - |
| Days Between Labs and MRI | - | 40 ± 24 | 63 ± 49 | 37 ± 22 |
| Days Between US and MRI | - | 99 ± 87 | 64 ± 37 | 8 ± 24 |
Data are expressed as Median (± SD). F: female, M: male, BMI: body mass index, FEV1: forced expiratory volume in 1 second, US: ultrasound. Hepatosplenomegaly was determined by ultrasound, according to age-specific ranges. In cases where patients had multiple ultrasounds performed, only the earliest timepoints were assessed.
, Indicates values which were significantly different from the Normal MR elastography group (P < 0.05).
Correlation between shear-wave elastography and magnetic resonance elastography
We examined the ability of SWE to accurately detect liver stiffness in CF using MR elastography as a standard. We found a positive correlation between SWE and MR elastography using 6-MHz point SWE (r=0.52; 95% confidence interval [CI] 0.20–0.74; P=0.003) (Fig. 2), but no correlation between 9-MHz point SWE or 2-D SWE and MR elastography (point SWE: r=0.09; 2-D SWE: r=0.02) (Online Supplemental Material 1). Using the Youden index to separate normal vs. abnormal (<3 kPa vs. >3 kPa), we identified a 6-MHz point SWE of 1.45 m/s with 79% sensitivity, 100% specificity, 100% PPV and 55% NPV, with an AUROC of 0.94. This result was similar to the cutoff of 1.34 m/s obtained when distinguishing nodular US from normal or echogenic groups using gray-scale US (Online Supplementary Material 2). We were able to further distinguish mild–moderate vs. severe using a cutoff of 1.84 m/s (88% sensitivity, 86% specificity, 78% PPV, 93% NPV, AUROC of 0.79) (Fig. 2).
Fig. 2.
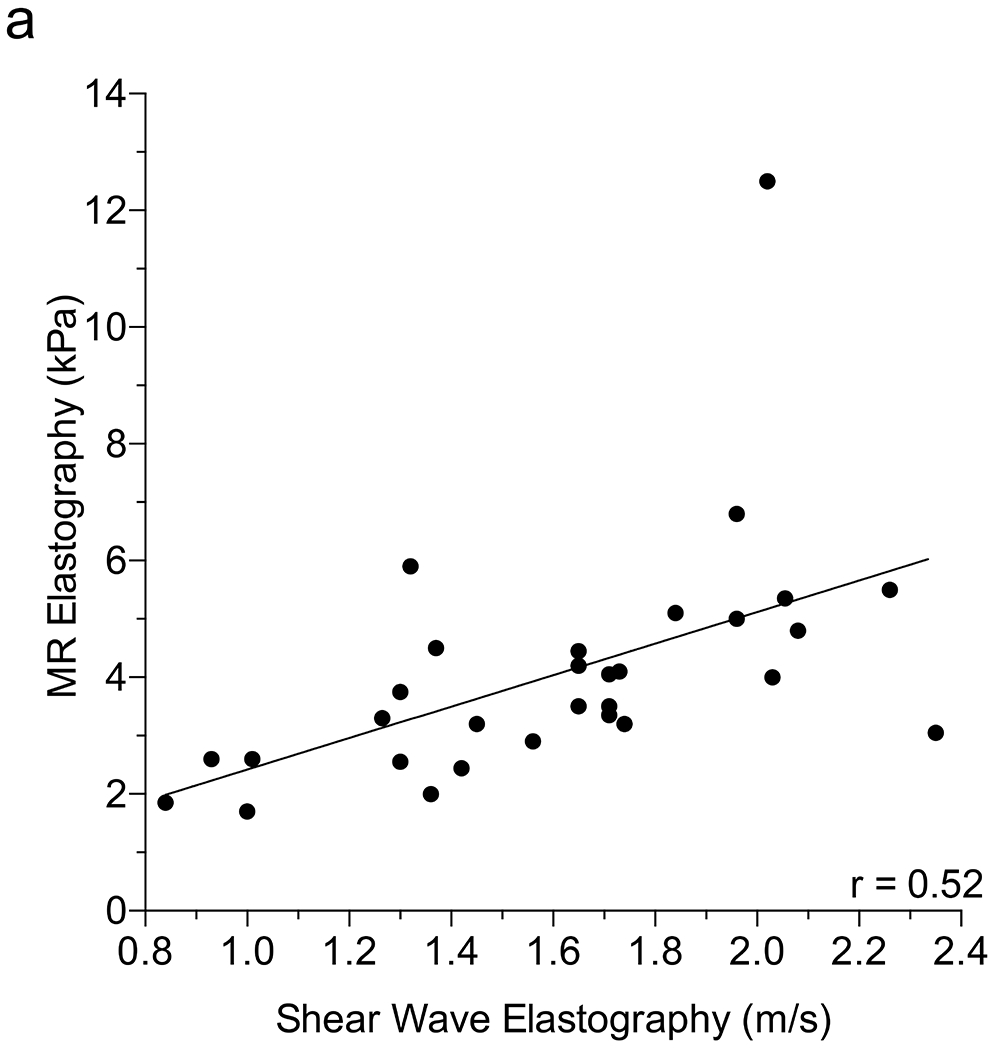
Correlation between shear-wave elastography (SWE) and magnetic resonance (MR) elastography. a Scatter plot depicts the Pearson correlation coefficient of SWE performed with curved 6C1 probe at 6 MHz and MR elastography. b Column scatter plots show the mean (line) 6-MHz SWE in patients separated according to MR elastography score. Dotted lines represent optimal cut-offs as determined by the Youden index. Significance in (b) was determined using the Student’s t-test
We examined whether particular patient characteristics could explain the 6-mHz point SWE superior accuracy in differentiating stages of liver stiffness. To determine whether the relative size of the child impacts the utility of 6-mHz point SWE for differentiating fibrosis stages, we compared SWE to MR elastography scores separately in children with higher vs. lower body mass index (BMI) and in younger vs. older children. We observed larger correlation coefficients between SWE and MR elastography in children with BMI ≥50th percentile vs. <50th percentile (r=0.36 and r=0.61, respectively) and in children age <12 years vs. ≥12 years (r=0.71 and r=0.50, respectively), but the differences were not statistically significant (P=0.410 comparing age <12 years to age ≥12 years; P=0.420 comparing BMI <50th percentile to BMI ≥50th percentile) (Online Supplementary Material 3).
Identification of factors contributing to shear-wave elastography variability
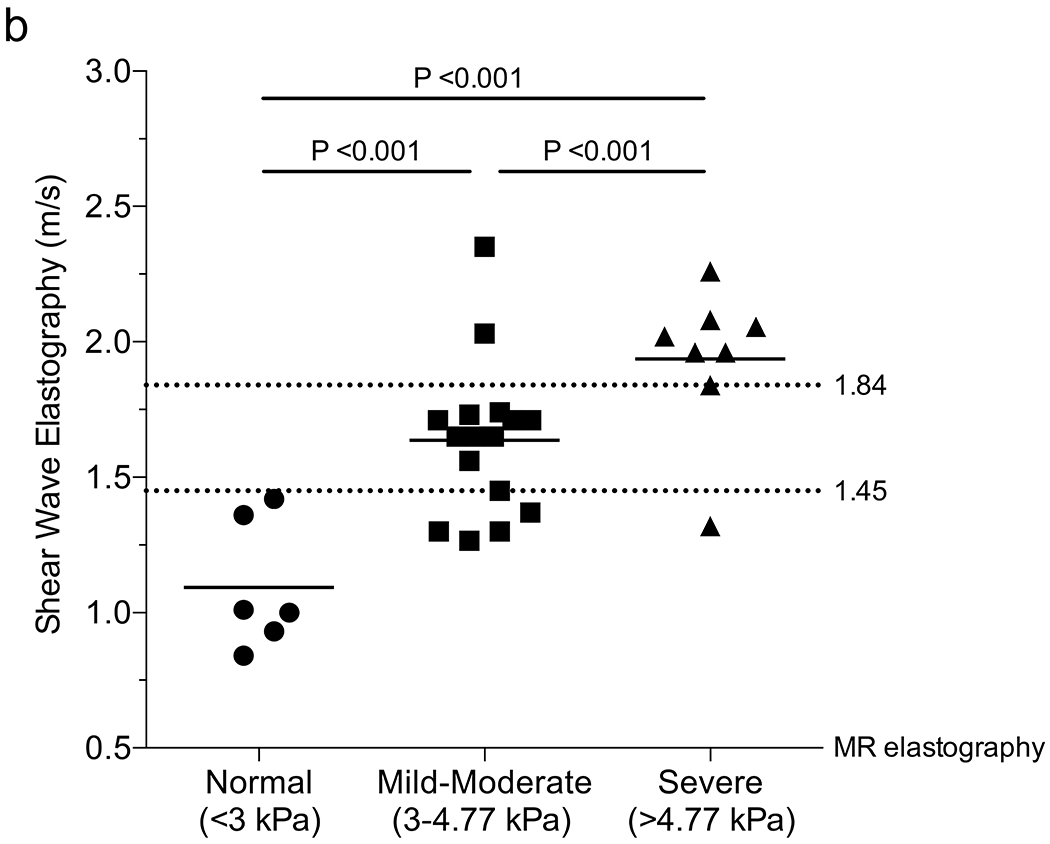
While 6-MHz point SWE discriminated between varying degrees of liver stiffness, the mild–moderate group exhibited a relatively low coefficient of determination (Fig. 2; r2=0.28). To better understand potential sources of variability, we examined the variability within each of the 6-MHz curved 6C1 probe datasets with corresponding MR elastography. While the median SWE values clustered well based on MR elastography, there was nonetheless a high amount of variability in each scan, highlighted by comparing minimum and maximum observed velocities (Fig. 3 and Online Supplementary Material 4). The mean ± standard error of the mean (SEM) variability in 6-MHz point SWE in the mild–moderate group was 0.66±0.17 m/s compared to 2.43±1.17 m/s in the severe group (P=0.026). The linear 9L4 probe at 9 MHz similarly showed increasing variability with increasing liver stiffness in point SWE; however, variability in 2-D SWE was similar across all groups (Online Supplementary Material 4 and 5).
Fig. 3.
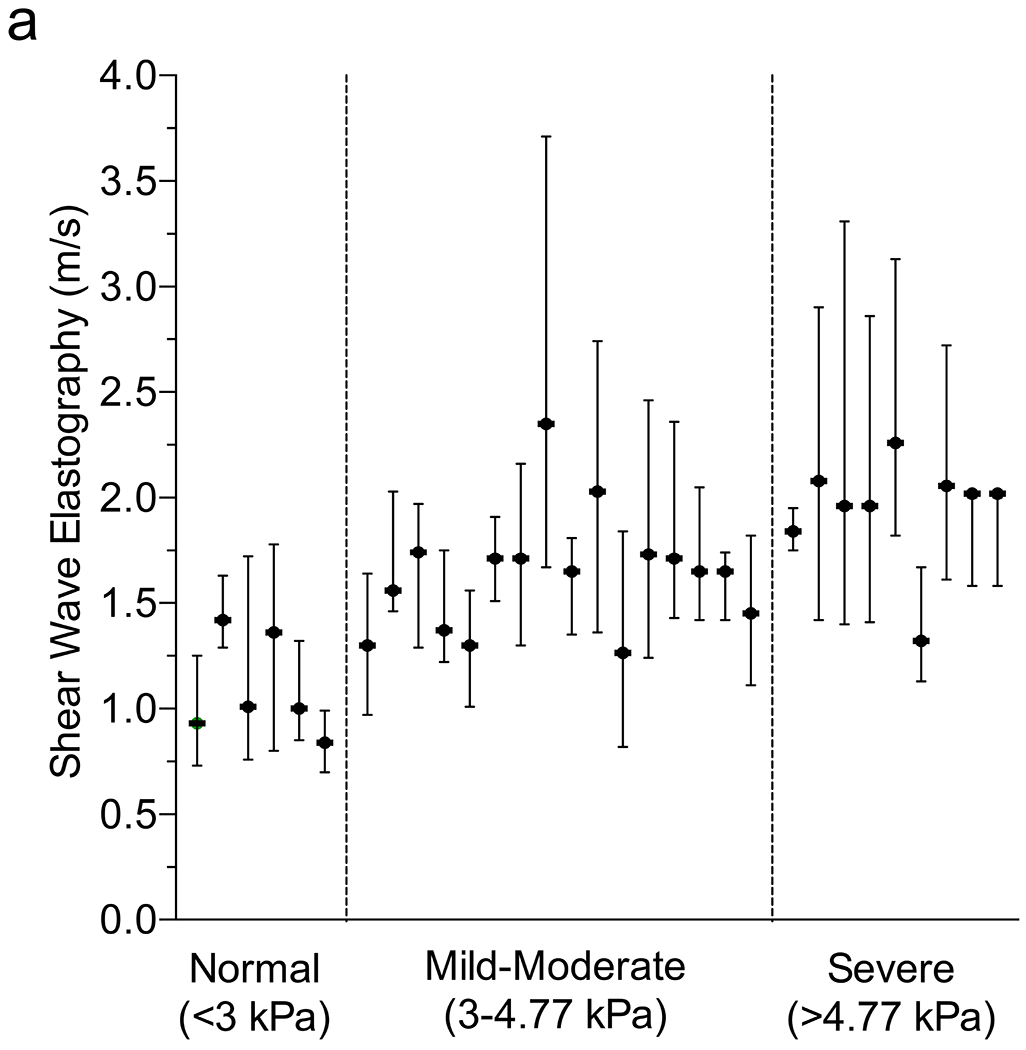
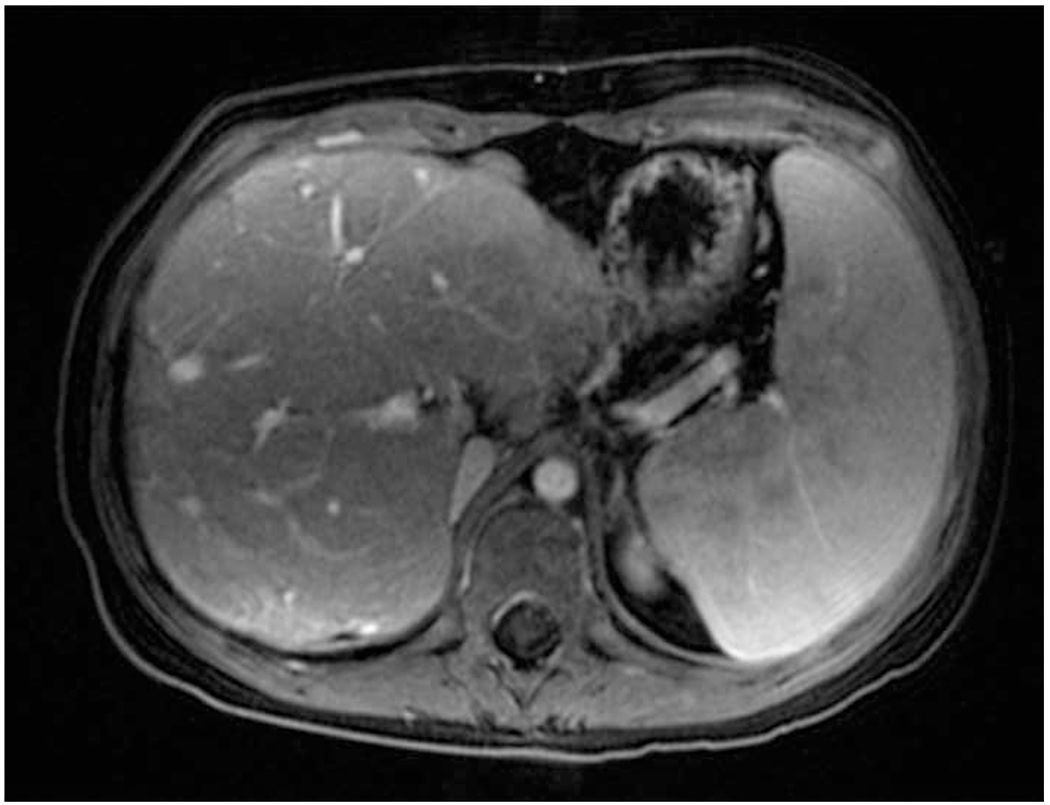
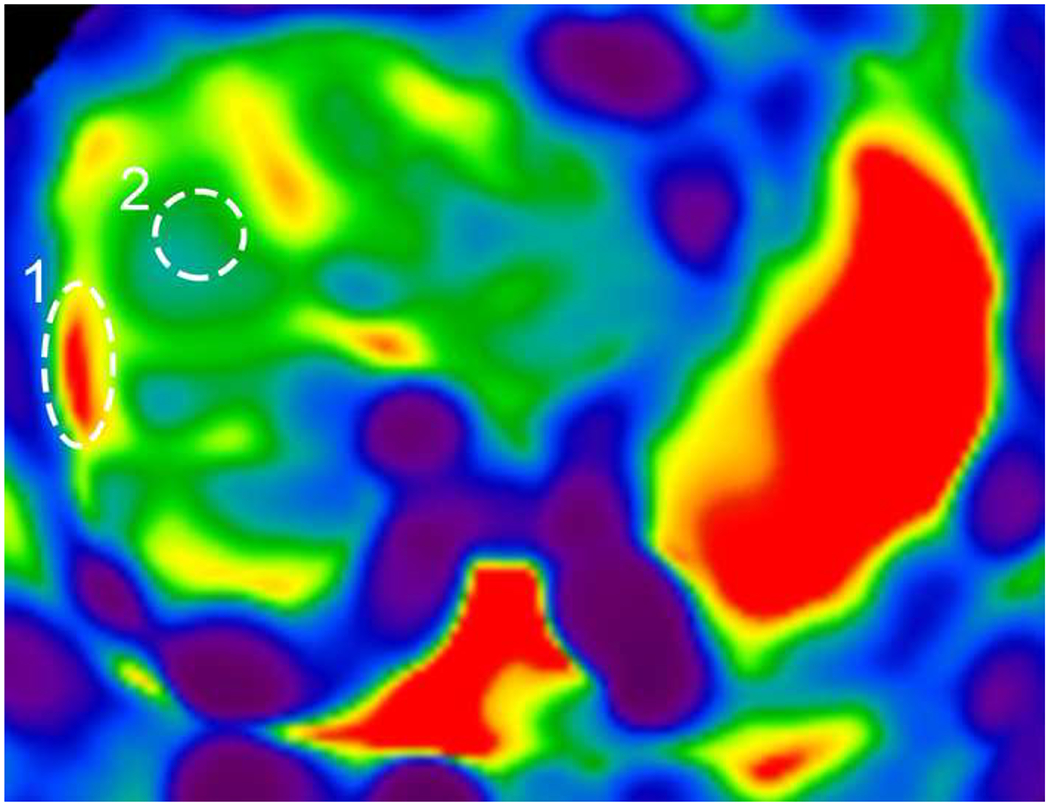
Variability in shear-wave elastography (SWE) and magnetic resonance (MR) elastography. a Plot depicts each patient’s median (dot) and minimum/maximum (whiskers) reported 6-MHz point SWE values (curved 6C1 probe), separated by MR elastography score (vertical dotted lines). b, c T1-weighted post-contrast axial MR image shows liver morphology (b) and elastogram (c) with areas of interest outlined including fibrosis (1) and normal (2). Confidence map overlay for (c) is available in Online Supplementary Material 4
Correlation between blood tests and shear-wave elastography
Subsequently, we examined the correlation between SWE and blood tests normally conducted as part of annual liver disease screening in children with CF. We assessed each laboratory value in the overall group of 178 US exams to determine their relationship with 6-MHz point SWE. The 6-MHz point SWE values were higher in patients with elevated AST (P<0.001), ALT (P=0.002) or GGT (P<0.001), and low platelets (P<0.001) (Online Supplementary Material 6). Weak positive correlations between SWE and AST (r=0.29; 95% CI 0.15–0.42; P<0.001) and ALT (r=0.19; 95% CI 0.03–0.33; P=0.020) precluded identification of reliable cut-offs to detect liver fibrosis. GGT and platelets had higher correlations with 6-mHz point SWE (GGT: r=0.48, 95% CI 0.35–0.59, P<0.001; and platelets: r=0.42, 95% CI 0.28–0.54, P<0.001). GGT was effective in distinguishing between normal and abnormal liver stiffness, whereas platelets performed best in identifying more advanced liver stiffness (>1.84 m/s) as compared to distinguishing grades of stiffness (Table 2) (Fig. 4).
Table 2.
Performance of laboratory cutoffs in predicting abnormal SWE
| Value | Sensitivity (%) | Specificity (%) | PPV (%) | NPV (%) | AUROC | |
|---|---|---|---|---|---|---|
| GGT | ||||||
| Abnormal (SWE > 1.45 m/s) | 15 | 85 | 53 | 34 | 95 | 0.80 |
| Severe Stiffness (SWE > 1.84 m/s) | -- | -- | -- | -- | -- | -- |
| Platelets | ||||||
| Abnormal (SWE > 1.45 m/s) | -- | -- | -- | -- | -- | -- |
| Severe Stiffness (SWE > 1.84 m/s) | 243 | 92 | 70 | 23 | 99 | 0.85 |
| APRI | ||||||
| Abnormal (SWE > 1.45 m/s) | 0.356 | 81 | 74 | 40 | 95 | 0.80 |
| Severe Stiffness (SWE > 1.84 m/s) | 0.423 | 92 | 80 | 31 | 99 | 0.89 |
| FIB-4 | ||||||
| Abnormal (SWE > 1.45 m/s) | 0.222 | 81 | 61 | 30 | 94 | 0.71 |
| Severe Stiffness (SWE > 1.84 m/s) | 0.288 | 77 | 78 | 25 | 97 | 0.82 |
| GPR | ||||||
| Abnormal (SWE > 1.45 m/s) | 0.403 | 81 | 81 | 48 | 95 | 0.85 |
| Severe Stiffness (SWE > 1.84 m/s) | 1.427 | 69 | 95 | 56 | 97 | 0.88 |
Values were determined using Youden’s Index. GGT: Gamma-glutamyl transferase, APRI: AST-to-Platelet Ratio Index, FIB-4: Fibrosis-4 Index, GPR: GGT-to-Platelet Ratio, PPV: Positive predictive value, NPV: Negative predictive value, AUROC: Area under the receiver operating characteristic.
Fig. 4.
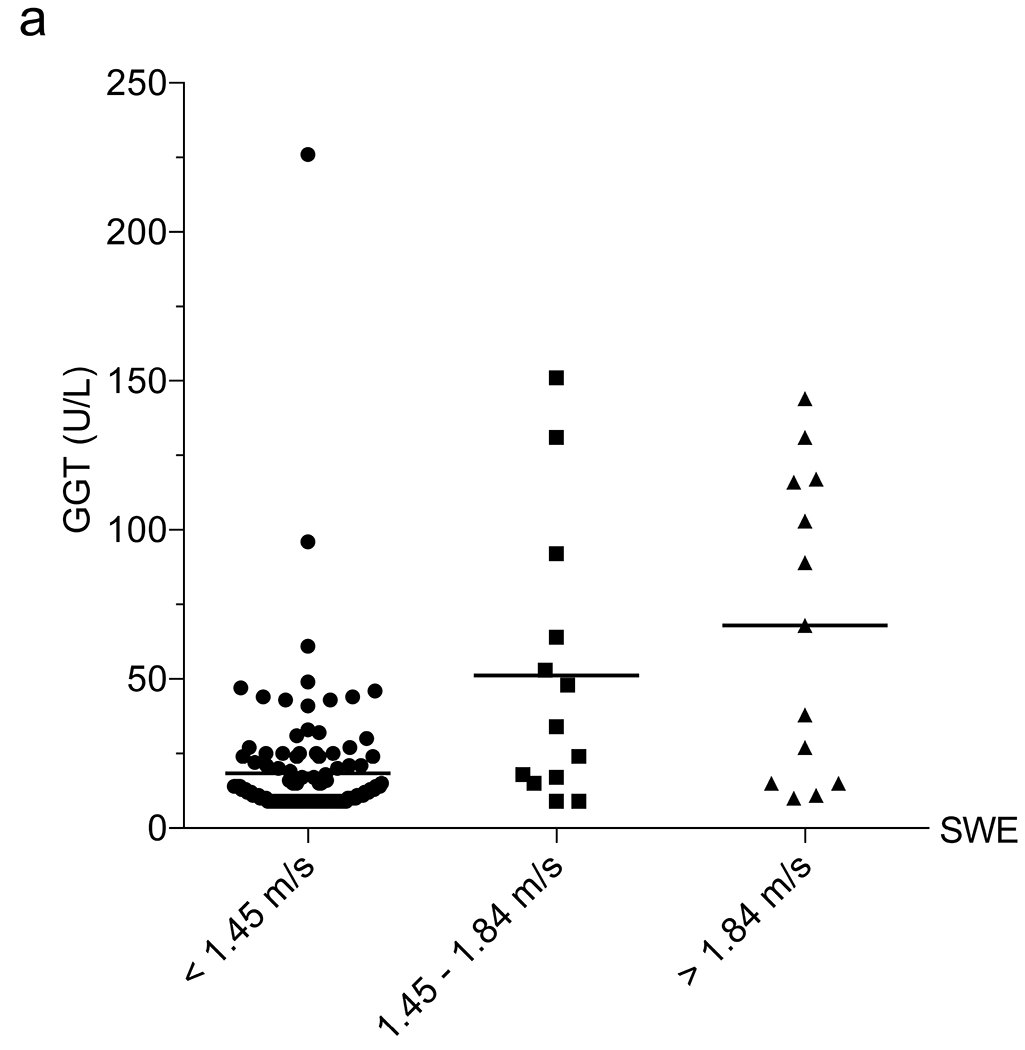
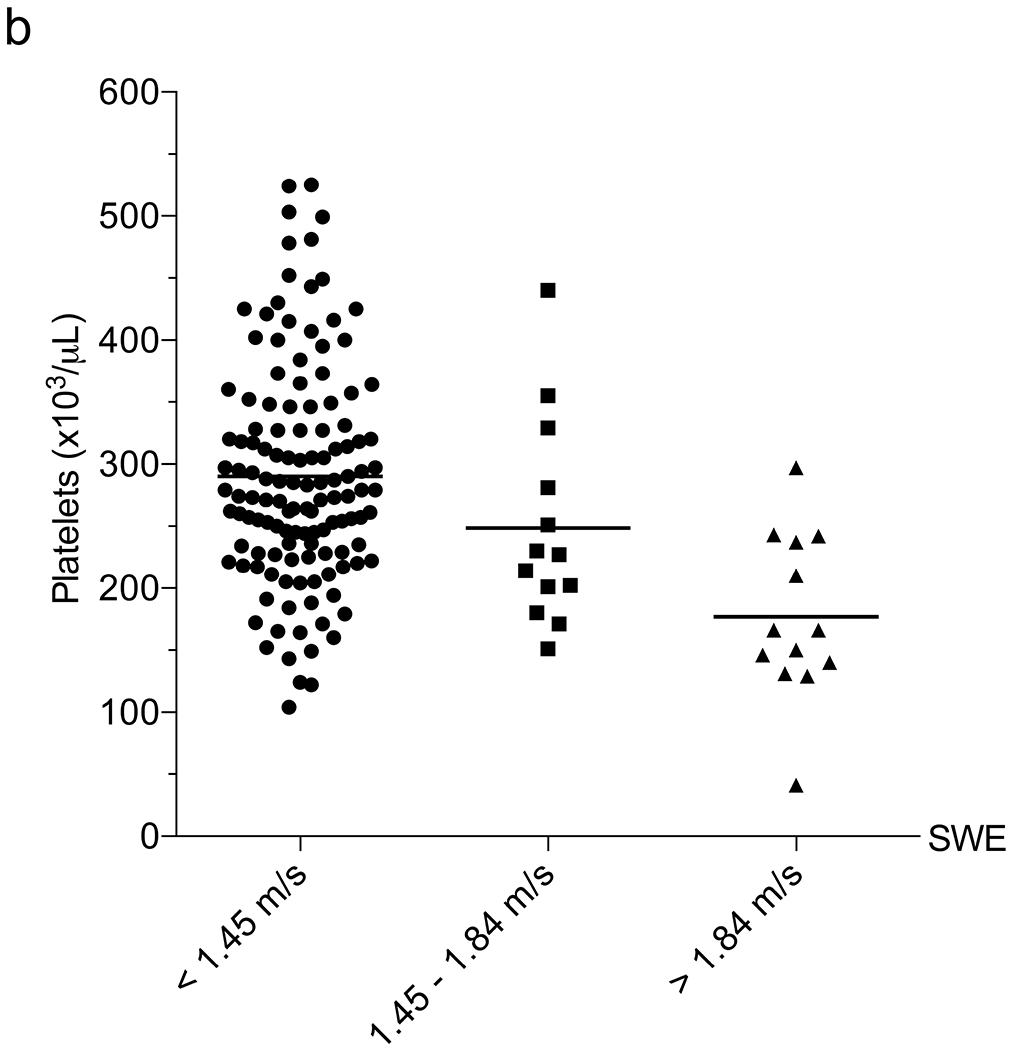
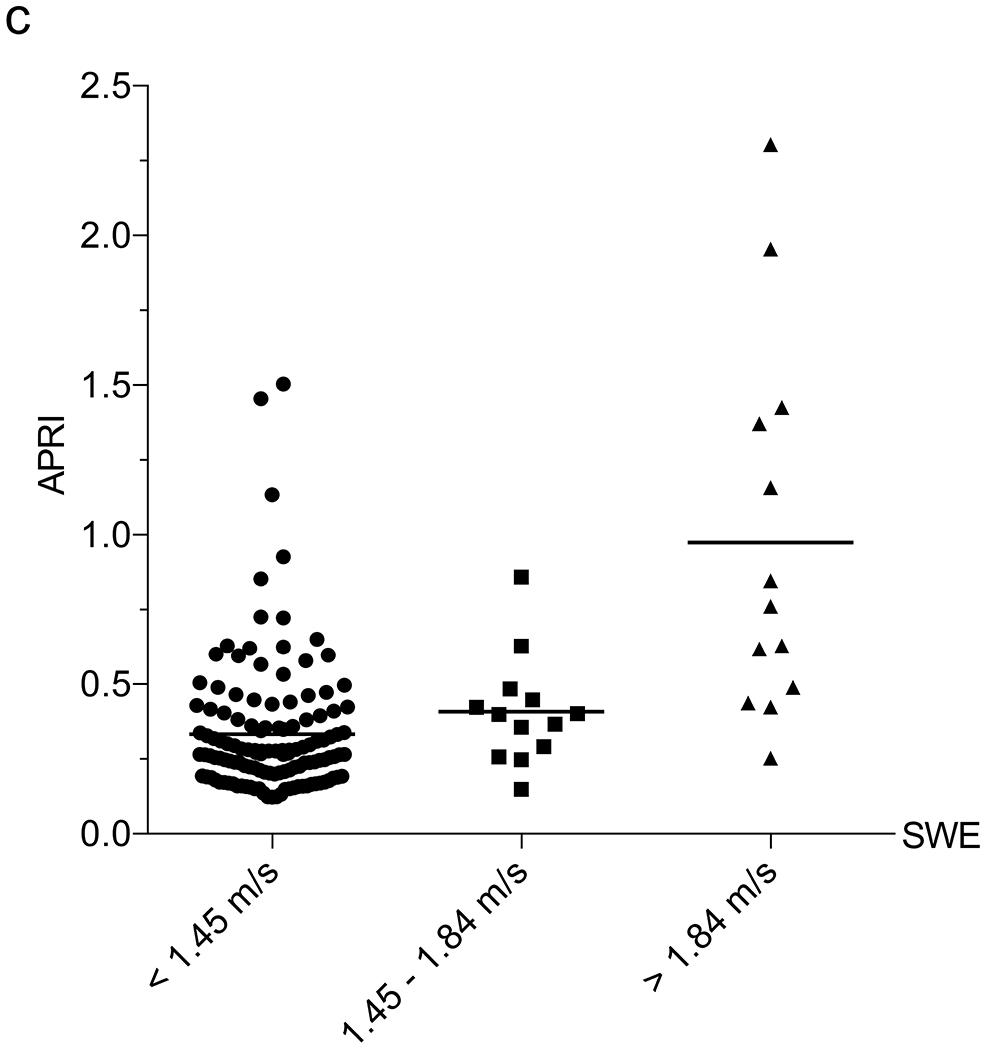
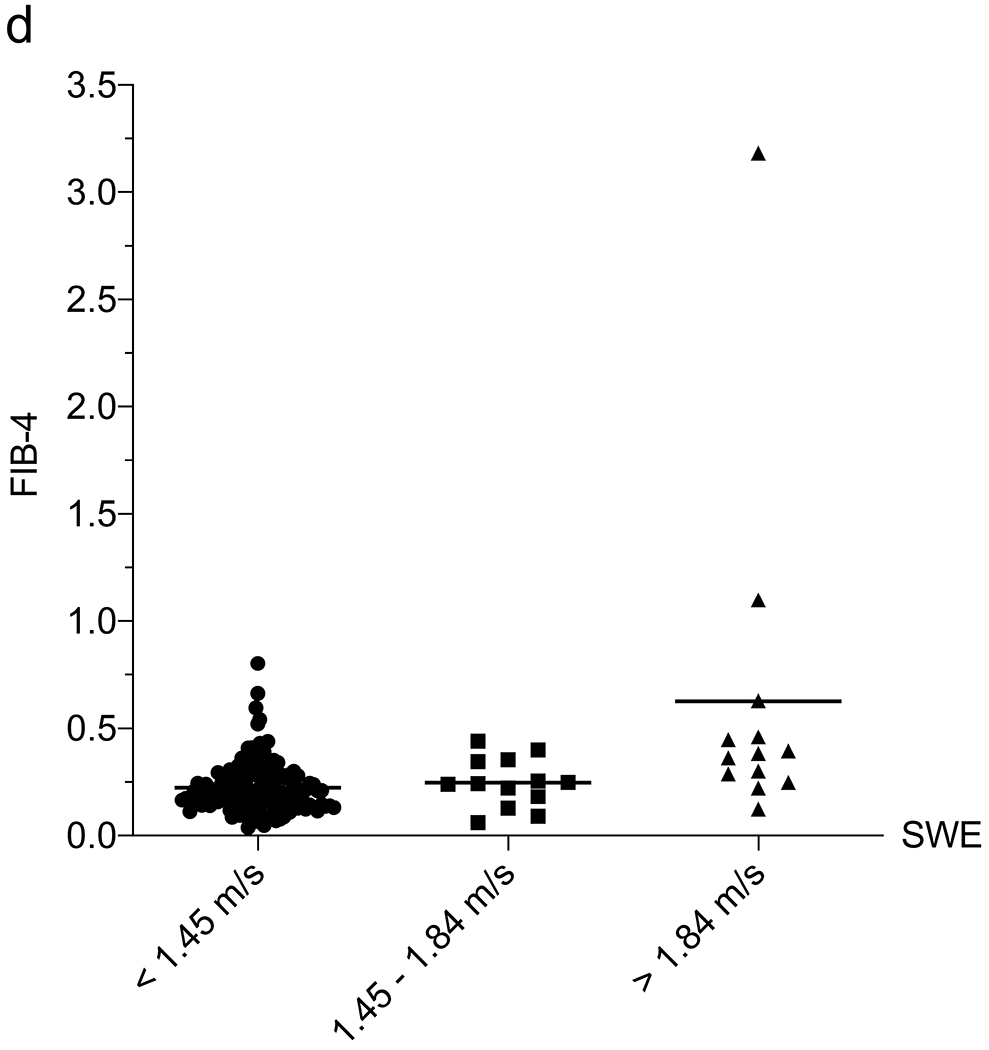
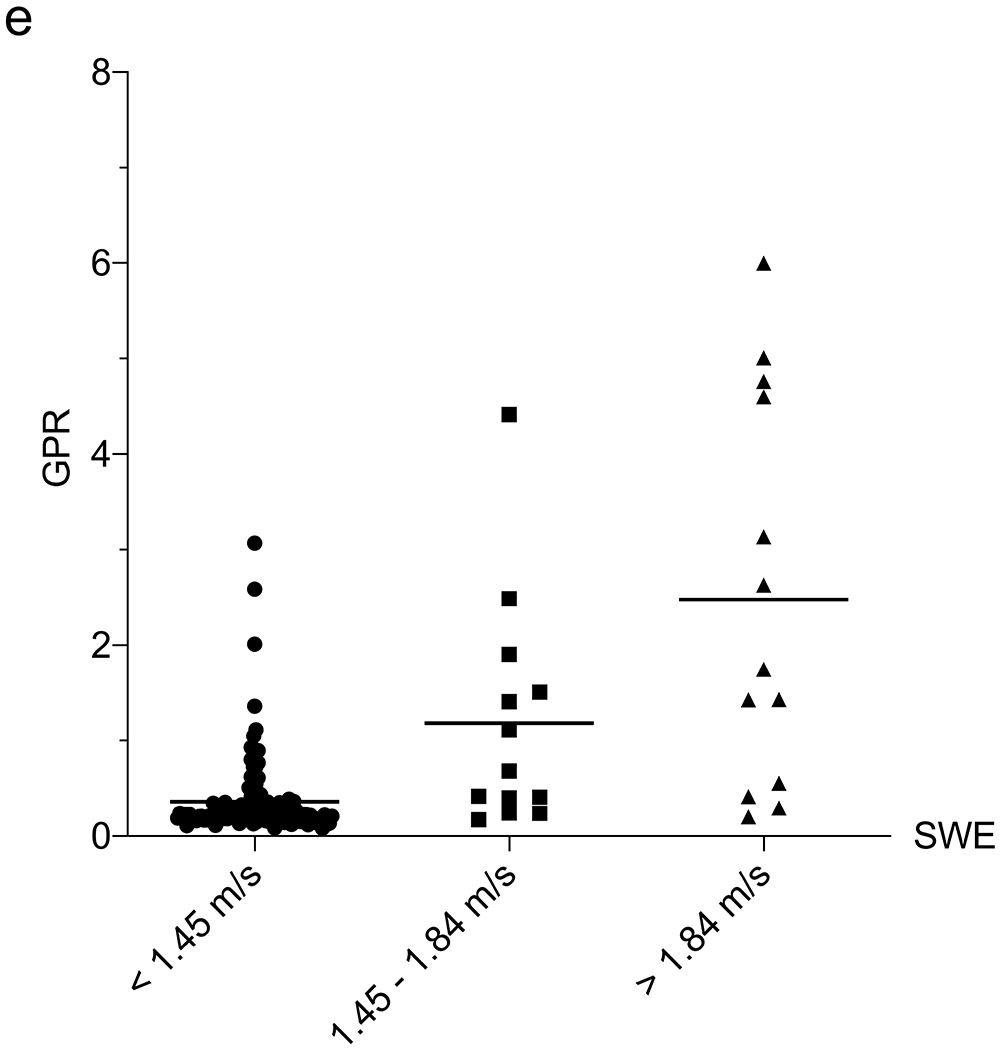
Correlation between liver function tests and shear-wave elastography (SWE). a–e Column scatter plots show the mean (line) and gamma-glutamyl transferase (GGT) (a), platelets (b), aspartate aminotransferase (AST)-to-platelet ratio index (APRI) (c), fibrosis-4 (FIB-4) (d) and GGT-to-platelet ratio (GPR) (e) in children and adolescents with SWE <1.45 m/s (normal), 1.45–1.84 m/s (mild–moderate) and >1.84 m/s (severe) fibrosis
We next assessed the correlation between 6-MHz point SWE and the liver fibrosis indices APRI (AST-to-platelet ratio index), FIB-4 (fibrosis-4) and GPR (GGT-to-platelet ratio), which have been used in the detection and monitoring of a variety of fibrotic liver diseases, including CF [11]. An APRI limit of 0.42, FIB-4 of 0.29 and GPR of 1.43 all had >95% NPV for SWE >1.84 m/s (Table 2). We explored a multivariate approach to determine whether the utility of 6-mHz point SWE for predicting MR elastography could be enhanced by including laboratory values. In a multiple linear regression including SWE, platelets, GGT, AST, ALT, APRI, FIB-4 and GPR, the only parameter that correlated with MR elastography was SWE (P=0.03) (an association was observed with GPR, although P=0.06). We attempted a multiple logistic regression to use SWE scores and labs to predict the likelihood that a child would have MR elastography >3 kPa or >4.77 kPa, although this approach was limited by the linear relationship between platelets and MR elastography and our small sample size.
Discussion
Liver cirrhosis and its complications remain a major source of morbidity for children with CF and are the leading cause of mortality after lung failure. Of children with CF who develop cirrhosis, 90% do so by 18 years of age [22–24]. Efforts to reduce the impact of liver cirrhosis have been hampered by a dearth of therapeutic interventions, a problem that is compounded by the inability to accurately identify children with mild fibrosis and stratify those at risk of developing cirrhosis. The ability to detect and monitor intermediate stages of liver fibrosis is critical to the development of novel interventional therapies that seek to prevent progression from fibrosis to cirrhosis. Quantitative imaging modalities, including MR elastography, are increasingly being used to evaluate for liver fibrosis in children with CF; however, this technology remains expensive and unavailable to many patients. US elastography might help overcome these challenges, but there is a lack of detailed knowledge on how this technology should be used in CF.
The Cystic Fibrosis Foundation and European guidelines recommend transabdominal US in patients with hepatomegaly or splenomegaly on exam or with abnormal screening laboratory values [3, 25]. Recent studies have further defined laboratory criteria to guide the decision of when to pursue US [6, 26]. We identified a GGT cutoff that separates children with normal vs. abnormal SWE and a platelet cutoff that identifies children with severe liver stiffness. These results were similar to cutoffs identified by MR elastography (data not shown) and also similar to prior studies with gray-scale US [6]. While these cutoffs need further validation in a larger, multicenter study, they might be useful in guiding the use of SWE in pediatric CF liver disease screening programs and identifying those individuals who would benefit from MRI for further evaluation of liver fibrosis.
We observed a positive correlation between SWE and the extent of MR elastography-defined fibrosis, such that SWE can separate children with fibrosis from those without it. Examining data from three techniques (curved 6C1 probe in 6-MHz point SWE, and linear 9L4 probe in 9-MHz point SWE and in 2-D SWE), we identified that 6-MHz point SWE with the 6C1 probe correlates best with MR elastography. Two recent studies evaluated ARFI SWE as a tool to (1) screen for liver disease in children with CF [8] or (2) stage the severity of liver disease in children with CF liver disease [27]. In the first study, an SWE cutoff of 1.27 m/s had a sensitivity of 56.5% and specificity of 90.5% for CF liver disease; the specific probes used in this study were not reported [8]. In the second study, SWE values ranged from 1.03 m/s in patients without US evidence of liver disease or laboratory evidence of exocrine pancreatic insufficiency to 1.25 m/s for those with portal hypertension and 1.63 m/s for those with esophageal varices from end-stage cirrhosis; this study used 2.5–4-MHz transducers [27]. Furthermore, both of these studies defined patients with splenomegaly (but not necessarily documented portal hypertension) as having CF liver disease. While splenomegaly and portal hypertension can occur in concert, fibrosis-independent hypersplenism and non-cirrhotic portal hypertension also occur in children with CF [4]. It is unclear whether the difference between our SWE values and those in prior studies is from the use of transducers with different frequencies (which might result in different shear-wave speeds because it is frequency- and thus transducer-dependent) or how liver involvement in each of these studies was classified.
We established US criteria to distinguish mild to moderate from severe liver stiffness using MR elastography as our standard, supporting the use of SWE as a means to monitor fibrosis progression over time. However, our findings highlight the heterogeneity of liver fibrosis in children with CF, in contrast to the homogeneous fibrosis pattern seen in other hepatopathies such as hepatitis C virus-mediated cirrhosis [28]. We observed a higher degree of SWE variability in children with abnormal MRI, which might reflect the more limited sampling windows in US in contrast to MRI, which captures the entire organ. Some of this variability, however, likely stems from intrinsic liver heterogeneity in CF liver disease, as reflected in the higher MR elastography variability seen in children with more advanced fibrosis. These caveats should be considered when using SWE for diagnostic/prognostic purposes. Utilizing 2-D US mapping with low-frequency probes might minimize SWE variability while providing good correlation with MR elastography. Finally, artificial intelligence is gaining attention for its utility in performing image-recognition tasks through quantitative assessment of complex image characteristics, and it is becoming increasingly popular in liver imaging. Artificial intelligence has been shown to accelerate translation of US texture analysis techniques for diagnosis of liver disease and might prove useful in differentiating the heterogeneous patterns seen in CF liver disease [29].
In interpreting our findings, several considerations should be noted: the relatively small single-center cohort, the use of clinical imaging reports vs. dedicated research imaging analysis, and the use of imaging endpoints rather than liver biopsies. Our pediatric CF center consists of patients with diverse ethnic backgrounds and CFTR gene mutations. As such, while this is a single-center study, our diverse cohort likely renders our findings applicable to other pediatric CF centers. While our use of “real-world” clinical reports increased variability within the data, it provided a realistic evaluation on how ARFI SWE can be used in routine clinical practice. Additionally, we were not able to obtain laboratory data at a standardized time before or after MR elastography, although again this reflects a limitation of routine clinical practice. Finally, as mentioned, because of the poor sensitivity of liver biopsies in CF, liver biopsies are not generally considered the gold standard for diagnosing liver fibrosis/cirrhosis in children with CF [30, 31]. While non-fibrotic causes can increase liver stiffness, the ability of MRI to provide a comprehensive assessment of the entire liver, vascular flow and hepatic fat content makes it a more reasonable standard for assessing liver fibrosis than biopsies. Subsequent validation of our findings with a larger, multicenter study, including the use of additional US probes, should help guide the clinical use of SWE for detecting and monitoring CF-associated liver fibrosis and cirrhosis.
Conclusion
Our study provides meaningful criteria and screening thresholds for SWE that predict liver stiffness detected by MR elastography in children with CF, as well as technical considerations when performing ARFI SWE. The accuracy of SWE is greatly dependent upon the specific US probe used. This information might help radiologists and CF practitioners determine when to pursue further workup, such as MR elastography, for determining liver fibrosis/cirrhosis, and it might be useful in CF-associated liver disease screening algorithms.
Supplementary Material
Online Supplementary Material 1 Scatter plots show the Pearson correlation coefficient of shear-wave elastography (SWE) and magnetic resonance (MR) elastography using the linear 9L4 probe in point SWE (a) and in 2-D SWE (b)
Online Supplementary Material 2 Scatter plots show the median (line) comparing US qualitative patterns with shear-wave elastography (SWE). Significance was determined by comparing nodular to normal, and nodular to echogenic using the Student’s t-test. The dotted line represents optimal cut-off as determined by the Youden index
Online Supplementary Material 3 Scatter plots show the Pearson correlation coefficient of shear-wave elastography (SWE) and magnetic resonance (MR) elastography using the curved 6C1 probe at 6 MHz separated based on body mass index (BMI) percentile (a and b) and age (c and d)
Online Supplementary Material 4 Plots depict each patient’s median (dot) and minimum/maximum (whiskers) reported 9-MHz point shear-wave elastography (SWE) (a) and 9-MHz 2-D SWE (b) values, separated by MR elastography score (vertical dotted lines). c Confidence overlay for the image shown in Fig. 3
Online Supplementary Material 5 Plots show the Pearson correlation coefficient of shear-wave elastography (SWE) and aspartate aminotransferase (AST)-to-platelet ratio index (APRI) (a), fibrosis-4 (FIB-4) (b), and gamma-glutamyl transferase (GGT)-to-platelet ratio (GPR) (c)
Acknowledgments
Funding was provided by the Cystic Fibrosis Foundation (SELLER16L0, SELLER19GE0 to Z.M.S), National Institute of Diabetes and Digestive and Kidney Diseases (K08DK124684 to Z.M.S.) and Stanford University (Z.M.S). Dr. Shreyas Vasanawala (Stanford University, Palo Alto, CA) assisted in generating the MR elastography confidence overlay figure.
Footnotes
Conflicts of interest None
References
- 1.FitzSimmons SC (1993) The changing epidemiology of cystic fibrosis. J Pediatr 122:1–9 [DOI] [PubMed] [Google Scholar]
- 2.Cheng K, Ashby D, Smyth RL (2017) Ursodeoxycholic acid for cystic fibrosis-related liver disease. Cochrane Database Syst Rev 9:CD000222. [DOI] [PMC free article] [PubMed] [Google Scholar]
- 3.Sokol RJ, Durie PR (1999) Recommendations for management of liver and biliary tract disease in cystic fibrosis. Cystic Fibrosis Foundation Hepatobiliary Disease Consensus Group. J Pediatr Gastroenterol Nutr 28:S1–13 [DOI] [PubMed] [Google Scholar]
- 4.Debray D, Kelly D, Houwen R et al. (2011) Best practice guidance for the diagnosis and management of cystic fibrosis-associated liver disease. J Cyst Fibros 10:S29–36 [DOI] [PubMed] [Google Scholar]
- 5.Mueller-Abt PR, Frawley KJ, Greer RM, Lewindon PJ (2008) Comparison of ultrasound and biopsy findings in children with cystic fibrosis related liver disease. J Cyst Fibros 7:215–221 [DOI] [PubMed] [Google Scholar]
- 6.Sellers ZM, Lee LW, Barth RA, Milla C (2019) New algorithm for the integration of ultrasound into cystic fibrosis liver disease screening. J Pediatr Gastroenterol Nutr 69:404–410 [DOI] [PubMed] [Google Scholar]
- 7.Lewindon PJ, Puertolas-Lopez MV, Ramm LE et al. (2019) Accuracy of transient elastography data combined with APRI in detection and staging of liver disease in pediatric patients with cystic fibrosis. Clin Gastroenterol Hepatol 17:2561–2569.e5 [DOI] [PubMed] [Google Scholar]
- 8.Canas T, Macia A, Munoz-Codoceo RA et al. (2015) Hepatic and splenic acoustic radiation force impulse shear wave velocity elastography in children with liver disease associated with cystic fibrosis. Biomed Res Int 2015:517369. [DOI] [PMC free article] [PubMed] [Google Scholar]
- 9.Yin M, Glaser KJ, Talwalkar JA et al. (2016) Hepatic MR elastography: clinical performance in a series of 1377 consecutive examinations. Radiology 278:114–124 [DOI] [PMC free article] [PubMed] [Google Scholar]
- 10.Trout AT, Sheridan RM, Serai SD et al. (2018) Diagnostic performance of MR elastography for liver fibrosis in children and young adults with a spectrum of liver diseases. Radiology 287:824–832 [DOI] [PubMed] [Google Scholar]
- 11.Leung DH, Narkewicz MR (2017) Cystic fibrosis-related cirrhosis. J Cyst Fibros 16:S50–S61 [DOI] [PubMed] [Google Scholar]
- 12.Bedossa P, Poynard T (1996) An algorithm for the grading of activity in chronic hepatitis C. The METAVIR Cooperative Study Group. Hepatology 24:289–293 [DOI] [PubMed] [Google Scholar]
- 13.Yin M, Talwalkar JA, Glaser KJ et al. (2007) Assessment of hepatic fibrosis with magnetic resonance elastography. Clin Gastroenterol Hepatol 5:1207–1213 [DOI] [PMC free article] [PubMed] [Google Scholar]
- 14.Barr RG, Ferraioli G, Palmeri ML et al. (2015) Elastography assessment of liver fibrosis: Society of Radiologists in Ultrasound consensus conference statement. Radiology 276:845–861 [DOI] [PubMed] [Google Scholar]
- 15.Colantonio DA, Kyriakopoulou L, Chan MK et al. (2012) Closing the gaps in pediatric laboratory reference intervals: a CALIPER database of 40 biochemical markers in a healthy and multiethnic population of children. Clin Chem 58:854–868 [DOI] [PubMed] [Google Scholar]
- 16.Estey MP, Cohen AH, Colantonio DA et al. (2013) CLSI-based transference of the CALIPER database of pediatric reference intervals from Abbott to Beckman, Ortho, Roche and Siemens clinical chemistry assays: direct validation using reference samples from the CALIPER cohort. Clin Biochem 46:1197–1219 [DOI] [PubMed] [Google Scholar]
- 17.Sterling RK, Lissen E, Clumeck N et al. (2006) Development of a simple noninvasive index to predict significant fibrosis in patients with HIV/HCV coinfection. Hepatology 43:1317–1325 [DOI] [PubMed] [Google Scholar]
- 18.Chou R, Wasson N (2013) Blood tests to diagnose fibrosis or cirrhosis in patients with chronic hepatitis C virus infection: a systematic review. Ann Intern Med 158:807–820 [DOI] [PubMed] [Google Scholar]
- 19.Lemoine M, Thursz M, Mallet V, Shimakawa Y (2017) Diagnostic accuracy of the gamma-glutamyl transpeptidase to platelet ratio (GPR) using transient elastography as a reference. Gut 66:195–196 [DOI] [PubMed] [Google Scholar]
- 20.Goksuluk D, Korkmaz S, Zarasiz G, Karaagaoglu AE (2016) easyROC: an interactive web-tool for ROC curve analysis using R language environment. R J 8:213–230 [Google Scholar]
- 21.Diedenhofen B, Musch J (2015) Cocor: a comprehensive solution for the statistical comparison of correlations. PLoS One 10:e0121945. [DOI] [PMC free article] [PubMed] [Google Scholar]
- 22.Colombo C, Battezzati PM, Crosignani A et al. (2002) Liver disease in cystic fibrosis: a prospective study on incidence, risk factors, and outcome. Hepatology 36:1374–1382 [DOI] [PubMed] [Google Scholar]
- 23.Stonebraker JR, Ooi CY, Pace RG et al. (2016) Features of severe liver disease with portal hypertension in patients with cystic fibrosis. Clin Gastroenterol Hepatol 14:1207–1215 e1203 [DOI] [PMC free article] [PubMed] [Google Scholar]
- 24.Boëlle PY, Debray D, Guillot L et al. (2019) Cystic fibrosis liver disease: outcomes and risk factors in a large cohort of French patients. Hepatology 69:1648–1656 [DOI] [PMC free article] [PubMed] [Google Scholar]
- 25.Bodewes FA, van der Doef HP, Houwen RH, Verkade HJ (2015) Increase of serum gamma-glutamyltransferase associated with development of cirrhotic cystic fibrosis liver disease. J Pediatr Gastroenterol Nutr 61:113–118 [DOI] [PubMed] [Google Scholar]
- 26.Ling SC, Ye W, Leung DH et al. (2019) Liver ultrasound patterns in children with cystic fibrosis correlate with non-invasive tests of liver disease. J Pediatr Gastroenterol Nutr 69:351–357 [DOI] [PMC free article] [PubMed] [Google Scholar]
- 27.Manco M, Zupone CL, Alghisi F et al. (2012) Pilot study on the use of acoustic radiation force impulse imaging in the staging of cystic fibrosis associated liver disease. J Cyst Fibros 11:427–432 [DOI] [PubMed] [Google Scholar]
- 28.Friedrich-Rust M, Wunder K, Kriener S et al. (2009) Liver fibrosis in viral hepatitis: noninvasive assessment with acoustic radiation force impulse imaging versus transient elastography. Radiology 252:595–604 [DOI] [PubMed] [Google Scholar]
- 29.Gao S, Peng Y, Guo H et al. (2014) Texture analysis and classification of ultrasound liver images. Biomed Mater Eng 24:1209–1216 [DOI] [PubMed] [Google Scholar]
- 30.Poetter-Lang S, Staufer K, Baltzer P et al. (2019) The efficacy of MRI in the diagnostic workup of cystic fibrosis-associated liver disease: a clinical observational cohort study. Eur Radiol 29:1048–1058 [DOI] [PMC free article] [PubMed] [Google Scholar]
- 31.Hayes D Jr., Krishnamurthy R, Hu HH (2018) Magnetic resonance elastography demonstrates elevated liver stiffness in cystic fibrosis patients. J Cyst Fibros 17:e54–e56 [DOI] [PubMed] [Google Scholar]
Associated Data
This section collects any data citations, data availability statements, or supplementary materials included in this article.
Supplementary Materials
Online Supplementary Material 1 Scatter plots show the Pearson correlation coefficient of shear-wave elastography (SWE) and magnetic resonance (MR) elastography using the linear 9L4 probe in point SWE (a) and in 2-D SWE (b)
Online Supplementary Material 2 Scatter plots show the median (line) comparing US qualitative patterns with shear-wave elastography (SWE). Significance was determined by comparing nodular to normal, and nodular to echogenic using the Student’s t-test. The dotted line represents optimal cut-off as determined by the Youden index
Online Supplementary Material 3 Scatter plots show the Pearson correlation coefficient of shear-wave elastography (SWE) and magnetic resonance (MR) elastography using the curved 6C1 probe at 6 MHz separated based on body mass index (BMI) percentile (a and b) and age (c and d)
Online Supplementary Material 4 Plots depict each patient’s median (dot) and minimum/maximum (whiskers) reported 9-MHz point shear-wave elastography (SWE) (a) and 9-MHz 2-D SWE (b) values, separated by MR elastography score (vertical dotted lines). c Confidence overlay for the image shown in Fig. 3
Online Supplementary Material 5 Plots show the Pearson correlation coefficient of shear-wave elastography (SWE) and aspartate aminotransferase (AST)-to-platelet ratio index (APRI) (a), fibrosis-4 (FIB-4) (b), and gamma-glutamyl transferase (GGT)-to-platelet ratio (GPR) (c)