Abstract
Body composition on chest CT scans encompasses a set of important imaging biomarkers. This study developed and validated a fully automated analysis pipeline for multi–vertebral level assessment of muscle and adipose tissue on routine chest CT scans. This study retrospectively trained two convolutional neural networks on 629 chest CT scans from 629 patients (55% women; mean age, 67 years ± 10 [standard deviation]) obtained between 2014 and 2017 prior to lobectomy for primary lung cancer at three institutions. A slice-selection network was developed to identify an axial image at the level of the fifth, eighth, and 10th thoracic vertebral bodies. A segmentation network (U-Net) was trained to segment muscle and adipose tissue on an axial image. Radiologist-guided manual-level selection and segmentation generated ground truth. The authors then assessed the predictive performance of their approach for cross-sectional area (CSA) (in centimeters squared) and attenuation (in Hounsfield units) on an independent test set. For the pipeline, median absolute error and intraclass correlation coefficients for both tissues were 3.6% (interquartile range, 1.3%–7.0%) and 0.959–0.998 for the CSA and 1.0 HU (interquartile range, 0.0–2.0 HU) and 0.95–0.99 for median attenuation. This study demonstrates accurate and reliable fully automated multi–vertebral level quantification and characterization of muscle and adipose tissue on routine chest CT scans.
Keywords: Skeletal Muscle, Adipose Tissue, CT, Chest, Body Composition Analysis, Convolutional Neural Network (CNN), Supervised Learning
Supplemental material is available for this article.
© RSNA, 2022
Keywords: Skeletal Muscle, Adipose Tissue, CT, Chest, Body Composition Analysis, Convolutional Neural Network (CNN), Supervised Learning
Summary
We report the development and validation of a fully automated deep learning pipeline for body composition analysis at multiple thoracic vertebral bodies; the results are not affected by intravenous administration of contrast material and demonstrate a level of accuracy very similar to that of human analysts.
Key Points
■ For the cross-sectional area, the median absolute percentage error for muscle and adipose tissue compared with manual segmentations were 3.8% and 3.4%, respectively.
■ For median attenuation, the median absolute error for both tissues compared with manual segmentations was 1.0 HU.
■ Our pipeline matches the performance of human analysts, with intraclass correlation coefficients ranging from 0.95 to 0.99.
Introduction
Muscle seen on CT images is an important biomarker in patients with cancer (1–3). Although the muscle cross-sectional area (CSA) is a surrogate of muscle quantity, muscle quality can be characterized based on attenuation (radiodensity, radio attenuation) (4). Adipose tissue can be equally quantified and characterized (5).
Machine learning algorithms enable the automated analysis of muscle and adipose tissue (6,7). Automated body composition analysis pipelines at the level of the T12 and L3 vertebral bodies have been described, but pipelines for multi–vertebral level quantification and characterization of thoracic muscle and adipose tissue have not been reported (7–10).
A recent multicenter study showed that the muscle CSA measured at multiple vertebral levels on chest CT images prior to lobectomy refines morbidity risk prediction in patients with lung cancer (11). The purpose of this study was to report the development and validation of a pipeline to fully automate the quantification and characterization of thoracic muscle and adipose tissue.
Materials and Methods
Our institutional review board approved this Health Insurance Portability and Accountability Act–compliant, retrospective prespecified secondary analysis. The need for informed consent was waived.
Patient Selection
We used routine chest CT scans obtained between 2014 and 2017 for staging and surgical planning within 90 days prior to lobectomy in patients with lung cancer (one scan per patient) at three institutions, as previously described (11). Patients were retained from the previously reported cohort if muscle and adipose tissue were completely imaged at one or more of the T5, T8, or T10 vertebral body levels (11). Reasons for exclusion are detailed in Figure E1 (supplement).
Ground Truth
Two trained research assistants (T.D.B., M.M.W.) supervised by a board-certified radiologist (F.J.F.) generated the ground truth–level selection and segmentation. Threshold-based manual segmentation (−29 to +150 HU for muscle, −190 to −30 HU for adipose tissue) was performed on a graphic tablet by using 3D Slicer (https://www.slicer.org/) (2–4,12). Subcutaneous and intermuscular adipose tissue were considered one class (Fig E2 [supplement]). Additional details are described in Appendix E1 (supplement).
Convolutional Neural Networks
We adapted a previously described body composition analysis pipeline to quantify muscle and adipose tissue at the T5, T8, and T10 vertebral body levels (6,8). The first stage is a slice-selection convolutional neural network (DenseNet) that analyzes each two-dimensional axial image in the input series to select individual images representative of each of the three vertebral levels of interest (13). The second stage is a segmentation convolutional neural network (U-Net) that segments muscle and adipose tissue on each selected image (Fig E3 [supplement]) (14).
The included 629 CT scans were randomly divided into a training set (75%), a validation set (10%) used during initial experiments to choose network hyperparameters and monitor overfitting, and a test set (15%) held out for performance evaluation at the end of the study. Details of the network architecture, preprocessing, augmentation, weight initialization, hyperparameters, and training are described in Appendix E1 (supplement).
Statistical Analysis including Network Performance Assessment and Outlier Analysis
We performed inter- and intrareader analysis of manual segmentations on 100 randomly selected cases to assess the reliability of the ground truth (manual segmentation) expressed as interclass correlation coefficients. Error was defined as deviation from the ground truth. We assessed the overall performance of our pipeline by comparing predicted CSA, median attenuation, and mean attenuation values of muscle and adipose tissue for each level with the ground truth. Additionally, we assessed the performance of the slice-selection and segmentation networks individually (Appendix E1 [supplement]). We investigated whether intravenous contrast material affected our results by comparing model errors and raw predicted values (slice selection, CSA, and median attenuation) within the test set by using the Wilcoxon rank sum test (stratified by algorithm, tissue, vertebral body level, and sex) and adjusting for multiple testing by using the Šidák correction method.
We quantified the performance for each of the 18 test case scenarios resulting from the combination of tissue (muscle, adipose), vertebral body level (T5, T8, or T10), and measurements (CSA, median attenuation, and mean attenuation). We calculated absolute errors, signed errors, intraclass correlation coefficients, and the Dice similarity coefficient. We investigated agreement with Bland-Altman plots, calculated limits of agreement (1.96 standard deviations) for each of the 18 scenarios independently, and defined outliers as measurements outside the limits of agreement. An analyst (T.D.B.), a data scientist (C.P.B.), and a board-certified radiologist (F.J.F.) jointly reviewed all test cases and performed root-cause analysis of each outlier.
Descriptive statistics are reported as the frequency, mean ± standard deviation, or median and interquartile range, as appropriate. Statistical analyses were performed with Python 3.6.8 by using the open-source SciPy 1.4.1 and Pingouin 0.3.8 packages (15). The source code for model training and evaluation is available online (https://github.com/CPBridge/ct_body_composition [commit 0321e02dcb6e4fc763c2054d49b0a544707b5270]).
Results
Patient and CT Characteristics
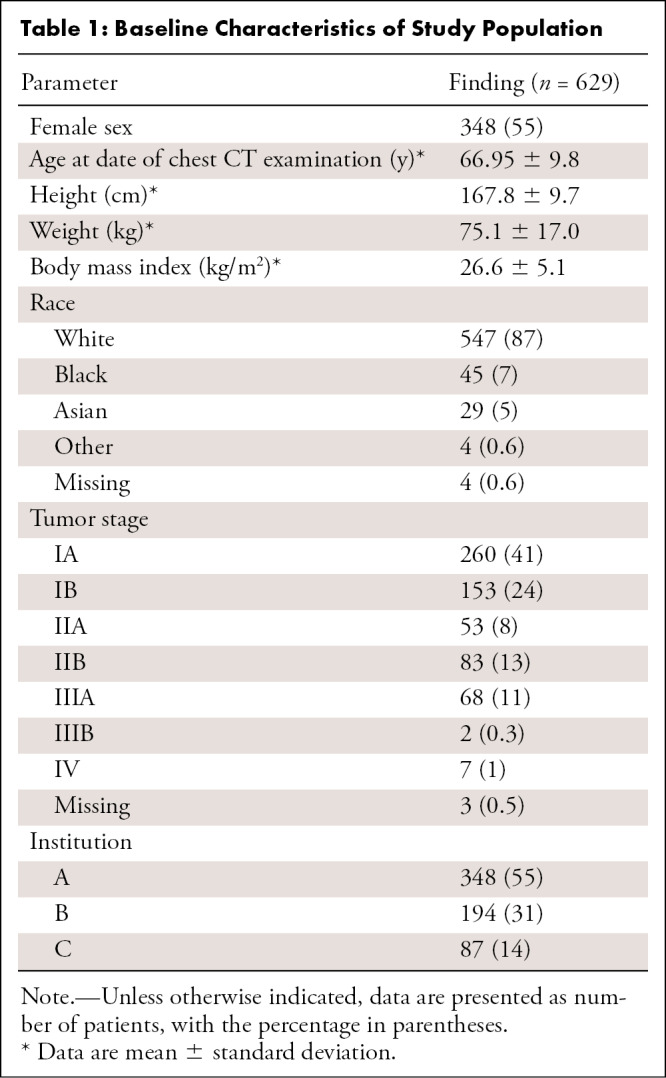
The 629 included patients were predominantly female (n = 348, 55%) and White (n = 547, 87%), predominantly had early stage lung cancer (n = 549 [87%]), had a mean age of 67 years ± 10 [standard deviation], and had a mean body mass index of 27 kg/m2 ± 5 (Table 1). Patient characteristics did not differ significantly among the training, validation, and test sets (Table E1 [supplement]).
Table 1:
Baseline Characteristics of Study Population

CT scans were acquired with 37 scanner models from four manufacturers (Table E2 [supplement]). Intravenous contrast material was used for 353 of 629 scans (56%). Slice thickness ranged from 1.25 to 5.00 mm, 67% of scans had a slice thickness of 2–3 mm, and all scans were obtained using a soft-tissue kernel.
Reliability of Manual Segmentations
The inter- and intraclass correlation coefficients of manual segmentations were excellent (≥0.999; 95% CI: ≥0.999, <1.000), as previously reported (11).
Pipeline Performance
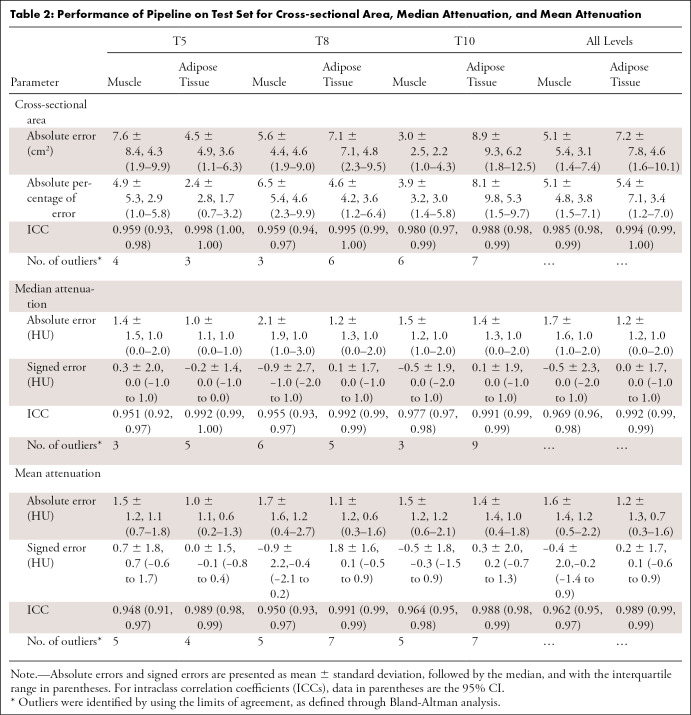
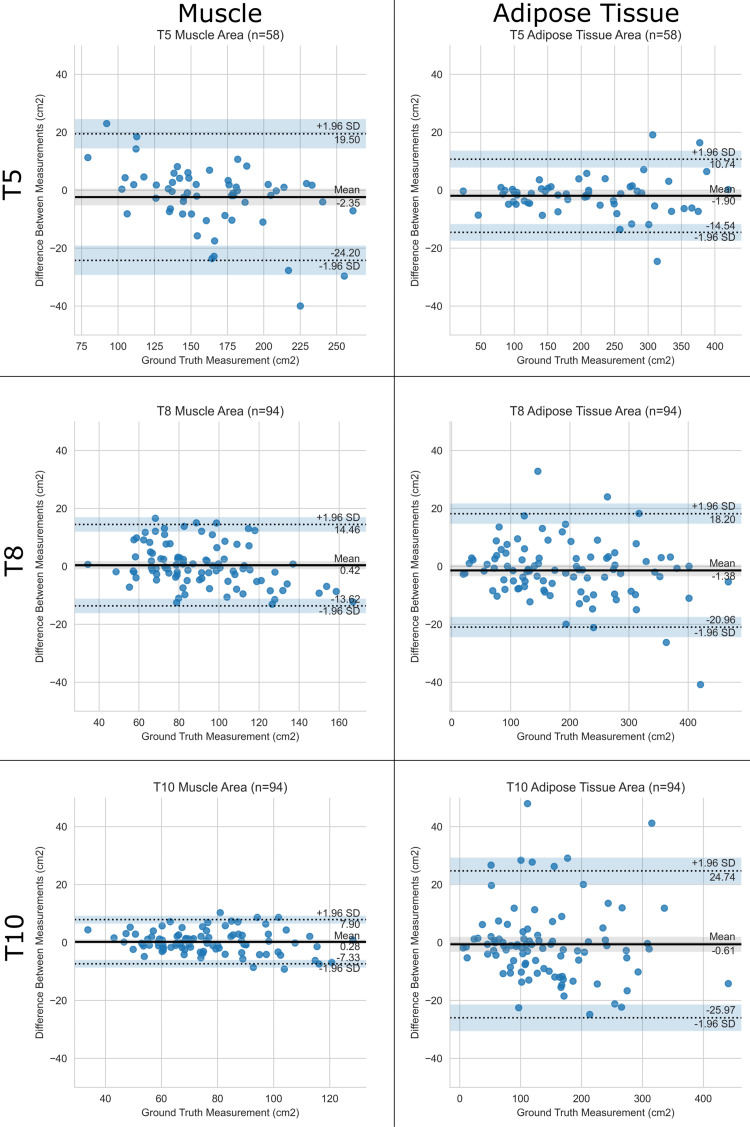
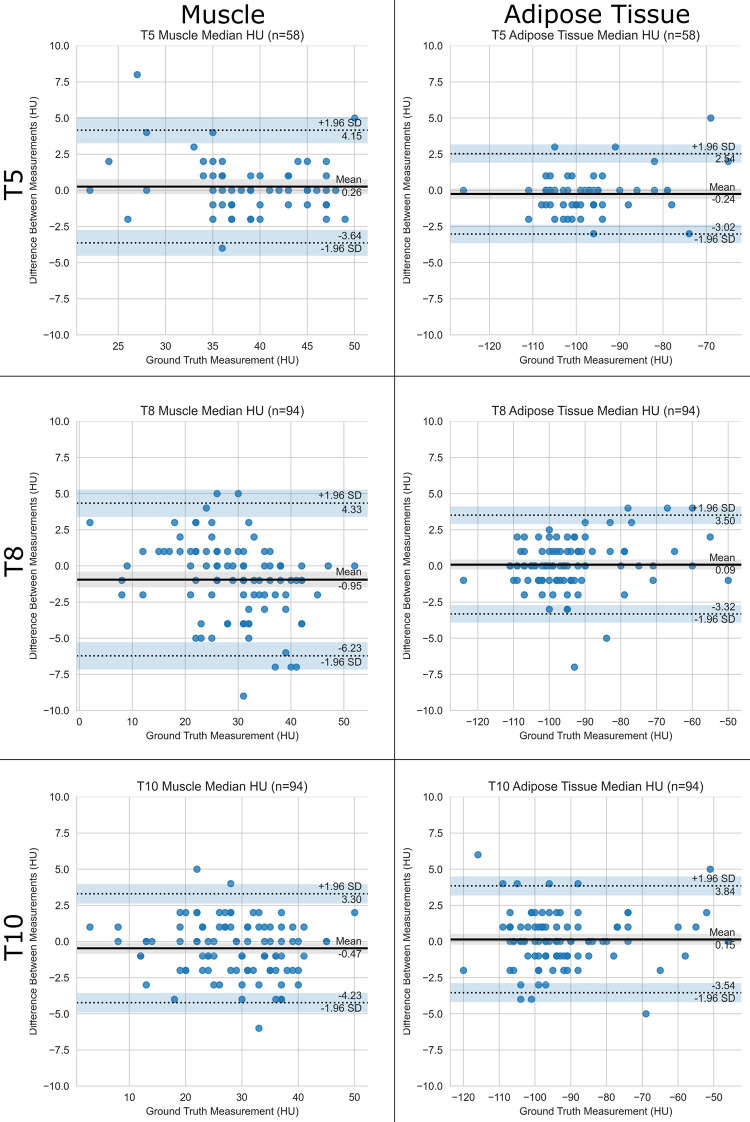
For the CSA, median absolute errors were 3.1 cm2 (3.8%) for muscle and 4.6 cm2 (3.4%) for adipose tissue (Table 2, Fig 1). For median attenuation, the median absolute error was 1.0 HU for both muscle and adipose tissue (Table 2, Fig 2) across all levels. Intraclass correlation with ground truth was excellent in all cases, ranging from 0.951 to 0.998. Results for mean attenuation, the slice-selection network, and the segmentation network individually are presented in Appendix E1 (supplement). There was no significant difference between scans with and those without intravenous contrast material with respect to slice selection (all P values ≥ .08), CSA (all P values ≥ .23), and median attenuation (all P values ≥ .56) errors and predictions, which were corrected for multiple testing.
Table 2:
Performance of Pipeline on Test Set for Cross-sectional Area, Median Attenuation, and Mean Attenuation
Figure 1:
Performance of the pipeline for cross-sectional area. Bland-Altman plots show agreement between the predicted and ground truth muscle and adipose tissue cross-sectional areas at T5, T8, and T10 vertebral bodies. The pipeline is compared with human analysts. SD = standard deviation.
Figure 2:
Performance of the pipeline for median attenuation. Bland-Altman plots show agreement between predicted and ground truth muscle and adipose tissue median attenuation at T5, T8, and T10 vertebral bodies. The pipeline is compared with human analysts. SD = standard deviation.
Outlier Analysis
Bland-Altman analysis identified 93 outliers on 57 scans (Appendix E1 [supplement]) out of a total of 1476 (6%) measurements obtained in the 18 test case scenarios (Table 2). For the 29 CSA outliers, the median absolute percentage error was 13% (interquartile range, 4%–20%). For the 31 median attenuation outliers, the median absolute error was 5.0 HU (interquartile range, 4.0–5.5 HU). We attributed 84 of 93 (90%) outliers to the selection of a slice that differed from the ground truth, as segmentations were anatomically correct on review. Additional details are presented in Table E4 (supplement). The pipeline did not erroneously segment the pleura, lung, or mediastinum, even if pleural effusions and parenchymal abnormalities, such as masses, were present (Fig E2 [supplement]).
Discussion
We developed and validated a fully automated pipeline on a large dataset of routine chest CT scans obtained with multiple scanner models from four vendors at three institutions. Our pipeline can accurately and reliably analyze muscle and adipose tissue at three thoracic vertebral levels, demonstrating an accuracy matching that of radiologist-guided human analysts on scans with and without intravenous contrast material. Ninety percent of outliers identified by using the limits of agreement could be attributed to slice selection differences.
Previously reported automated body composition analysis pipelines were focused on lumbar vertebral levels (6–8,10,16) or were limited to paraspinous muscle at the level of the T12 vertebral body (9). Although the muscle CSA at the L3 vertebral body level has been shown to correlate best with overall body composition of all single slices, no single-slice analysis captures the entire body composition perfectly (17,18).
We developed this method by retraining a pipeline designed for body composition analysis at the L3 vertebral body level and making only minor changes to the network output layers to reflect the number of levels and tissue classes. This suggests the possibility of scaling this approach to more vertebral levels. Furthermore, segmentation is achieved with one U-Net network at all three levels, suggesting that it may be capable of analyzing additional thoracic levels.
With our pipeline, slice selection and segmentation occur in a matter of seconds, which facilitates large-scale analyses of chest CT scans, similar to recent work by Magudia et al (6) and Pickhardt et al (7). On the basis of our formal outlier analysis, we believe that the output of all automated body composition analysis pipelines should undergo rigorous quality assurance and expert review to generate the feedback necessary for model improvement (3,19).
Our pipeline had limitations. First, patients in the cohort used for training had lung cancer and were older than the general population, which may limit generalizability. Second, our sample had limited racial diversity, with only 7% of patients being Black and 5% being Asian, despite pooling data from three institutions. Last, our dataset consisted of outpatients and was manually curated. Even though the outlier analysis suggested that our pipeline could be used to analyze CT scans of patients with conditions affecting the lung parenchyma and pleura, the application to inpatients with soft-tissue edema or the presence of compression fractures may have resulted in a higher error rate (20).
In conclusion, we developed and validated a fully automated analysis pipeline for the multi–vertebral level quantification and characterization of thoracic muscle and adipose tissue, which demonstrated a level of accuracy very similar to that of human analysts and thus enabled large-scale biomarker collection.
C.P.B. and T.D.B. contributed equally to this work.
F.J.F. supported by American Roentgen Ray Society scholarship grant.
Disclosures of conflicts of interest: C.P.B. Support from the MGH and BWH Center for Clinical Data Science (CCDS) for travel to conferences. The CCDS in turn receives support from GE Healthcare, Nuance Communications, Nvidia, Diagnóstico da América S.A., and Fujifilm Sonosite; US Patent applications pending for: Computed Tomography Medical Imaging Intracranial Hemorrhage Model (US Patent Application 16/587,828). In collaboration with GE Healthcare and Medical Imaging Stroke Model (US Patent Application 16/588,080). In collaboration with GE Healthcare. T.D.B. No relevant relationships. M.M.W. No relevant relationships. J.P.M. No relevant relationships. K.M. Former trainee editorial board member for Radiology: Artificial Intelligence. C.J. No relevant relationships. J.H.C. Editorial board member of Radiology: Cardiothoracic Imaging. J.K.C. Deputy editor of Radiology: Artificial Intelligence. K.P.A. A Mobile Health Diagnostic Device for HIV Self-Testing NIH 1R61 AI140489-01A1 PI: Shafiee, Andriole, Co-Investigator, Study goals are to develop a hand-held device for HIV self-testing using artificial intelligence algorithms for data analysis. 8/2019-7/2022; associate editor of Radiology: Artificial Intelligence. F.J.F. American Roentgen Ray Society scholarship grant (related to this work); grant from William M. Wood Foundation (not related to this work); grant form Society of Interventional Oncology (unrelated to this work); research support from Boston Scientific (unrelated to this work); patents related to body composition analysis.
Abbreviation:
- CSA
- cross-sectional area
References
- 1. Fearon K, Strasser F, Anker SD, et al. Definition and classification of cancer cachexia: an international consensus. Lancet Oncol 2011;12(5):489–495. [DOI] [PubMed] [Google Scholar]
- 2. Martin L, Birdsell L, Macdonald N, et al. Cancer cachexia in the age of obesity: skeletal muscle depletion is a powerful prognostic factor, independent of body mass index. J Clin Oncol 2013;31(12):1539–1547. [DOI] [PubMed] [Google Scholar]
- 3. Troschel AS, Troschel FM, Best TD, et al. Computed tomography-based body composition analysis and its role in lung cancer care. J Thorac Imaging 2020;35(2):91–100. [DOI] [PubMed] [Google Scholar]
- 4. Cruz-Jentoft AJ, Bahat G, Bauer J, et al. Sarcopenia: revised European consensus on definition and diagnosis. Age Ageing 2019;48(1):16–31. [DOI] [PMC free article] [PubMed] [Google Scholar]
- 5. Troschel AS, Troschel FM, Fuchs G, et al. Significance of acquisition parameters for adipose tissue segmentation on CT images. AJR Am J Roentgenol 2021;217(1):177–185. [DOI] [PubMed] [Google Scholar]
- 6. Magudia K, Bridge CP, Bay CP, et al. Population-scale CT-based body composition analysis of a large outpatient population using deep learning to derive age-, sex-, and race-specific reference curves. Radiology 2021;298(2):319–329. [DOI] [PMC free article] [PubMed] [Google Scholar]
- 7. Pickhardt PJ, Graffy PM, Zea R, et al. Automated CT biomarkers for opportunistic prediction of future cardiovascular events and mortality in an asymptomatic screening population: a retrospective cohort study. Lancet Digit Health 2020;2(4):e192–e200. [DOI] [PMC free article] [PubMed] [Google Scholar]
- 8. Bridge CP, Rosenthal M, Wright B, et al. Fully-automated analysis of body composition from CT in cancer patients using convolutional neural networks. In: Stoyanov D et al. (eds) OR 2.0 Context-Aware Operating Theaters, Computer Assisted Robotic Endoscopy, Clinical Image-Based Procedures, and Skin Image Analysis. CARE 2018, CLIP 2018, OR 2.0 2018, ISIC 2018. Lecture Notes in Computer Science, vol 11041. Springer, Cham. 10.1007/978-3-030-01201-4_22. [DOI] [Google Scholar]
- 9. Lenchik L, Barnard R, Boutin RD, et al. Automated muscle measurement on chest CT predicts all-cause mortality in older adults from the national lung screening trial. J Gerontol A Biol Sci Med Sci 2021;76(2):277–285. [DOI] [PMC free article] [PubMed] [Google Scholar]
- 10. Weston AD, Korfiatis P, Kline TL, et al. Automated abdominal segmentation of CT scans for body composition analysis using deep learning. Radiology 2019;290(3):669–679. [DOI] [PubMed] [Google Scholar]
- 11. Best TD, Mercaldo SF, Bryan DS, et al. Multilevel body composition analysis on chest computed tomography predicts hospital length of stay and complications after lobectomy for lung cancer: a multicenter study. Ann Surg doi: 10.1097/SLA.0000000000004040. Published online July 8, 2020. [DOI] [PubMed] [Google Scholar]
- 12. Fedorov A, Beichel R, Kalpathy-Cramer J, et al. 3D slicer as an image computing platform for the quantitative imaging network. Magn Reson Imaging 2012;30(9):1323–1341. [DOI] [PMC free article] [PubMed] [Google Scholar]
- 13. Huang G, Liu Z, Van Der Maaten L, Weinberger KQ. Densely connected convolutional networks. In: 2017 Institute of Electrical and Electronics Engineers Conference on Computer Vision and Pattern Recognition. Piscataway, NJ: IEEE, 2017; 2261–2269. [Google Scholar]
- 14. Ronneberger O, Fischer P, Brox T. U-Net: convolutional networks for biomedical image segmentation. In: Navab N, Hornegger J, Wells WM, Frangi AF, eds. Medical image computing and computer-assisted intervention – MICCAI 2015. MICCAI 2015. Vol 9351, Lecture notes in computer science. Cham, Switzerland: Springer, 2015; 234–241. [Google Scholar]
- 15. Vallat R. Pingouin: statistics in Python. J Open Source Softw 2018;3(31):1026. [Google Scholar]
- 16. Castiglione J, Somasundaram E, Gilligan LA, Trout AT, Brady S. Automated segmentation of abdominal skeletal muscle on pediatric CT scans using deep learning. Radiol Artif Intell 2021;3(2):e200130. [DOI] [PMC free article] [PubMed] [Google Scholar]
- 17. Shen W, Punyanitya M, Wang Z, et al. Total body skeletal muscle and adipose tissue volumes: estimation from a single abdominal cross-sectional image. J Appl Physiol (1985) 2004;97(6):2333–2338. [DOI] [PubMed] [Google Scholar]
- 18. Shen W, Punyanitya M, Wang Z, et al. Visceral adipose tissue: relations between single-slice areas and total volume. Am J Clin Nutr 2004;80(2):271–278. [DOI] [PMC free article] [PubMed] [Google Scholar]
- 19. van Seventer E, Marquardt JP, Troschel AS, et al. Associations of skeletal muscle with symptom burden and clinical outcomes in hospitalized patients with advanced cancer. J Natl Compr Cancer Netw 2021;19(3):319–327. [DOI] [PubMed] [Google Scholar]
- 20. Fuchs G, Thevathasan T, Chretien YR, et al. Lumbar skeletal muscle index derived from routine computed tomography exams predict adverse post-extubation outcomes in critically ill patients. J Crit Care 2018;44:117–123. [DOI] [PubMed] [Google Scholar]


