ABSTRACT
In this paper, a simple numerical procedure is presented to monitor the growth of Streptococcus sanguinis over time in the absence and presence of propolis, a natural antimicrobial. In particular, it is shown that the real-time decomposition of growth curves obtained through optical density measurements into growth rate and acceleration can be a powerful tool to precisely assess a large range of key parameters (i.e., lag time [t0], starting growth rate [γ0], initial acceleration of the growth [a0], maximum growth rate [γmax], maximum acceleration [amax], and deceleration [amin] of the growth and the total number of cells at the beginning of the saturation phase [Ns]) that can be readily used to fully describe growth over time. Consequently, the procedure presented provides precise data of the time course of the different growth phases and features, which is expected to be relevant, for instance, to thoroughly evaluate the effect of new antimicrobial agents. It further provides insight into predictive microbiology, likely having important implications for assumptions adopted in mathematical models to predict the progress of bacterial growth.
IMPORTANCE The new and simple numerical procedure presented in this paper to analyze bacterial growth will possibly allow the identification of true differences in efficacy among antimicrobial drugs for their applications in human health, food security, and the environment, among others. It further provides insight into predictive microbiology, likely helping in the development of proper mathematical models to predict the course of bacterial growth under diverse circumstances.
KEYWORDS: bacterial growth, growth rate, growth acceleration, antimicrobials
INTRODUCTION
In recent years, there has been a growing interest in exploring and developing new effective antimicrobial agents to fight against microbial resistance to antibiotics, a growing public health concern worldwide. To this end, a significant amount of research has been primarily focused on the investigation of natural sources, i.e., plant and microbial extracts, essential oils, and pure secondary metabolites, which has provided a large range of complex and structurally natural compounds as potential antimicrobials (1–4).
The in vitro antimicrobial activity of these new compounds, however, is still nowadays mostly evaluated following standard laboratory procedures, such as the disk diffusion and broth or agar dilutions methods (5). In particular, MIC and minimal bactericidal concentration (MBC), defined, respectively, as the lowest concentration of drug that prevents visible growth and kills 99.9% of the inoculated organisms after an incubation time of 18 to 24 h, are routinely assessed through these methods and reported as key indicators of antibiotic susceptibility testing. The endpoint growth determination of these parameters, however, do not reveal potential effects of sub-MICs, which may have an initial inhibitory or bactericidal activity not maintained during the total incubation time (i.e., 18 to 24 h), the rate of microbial killing, or whether the latter is affected by increasing concentrations. Addressing the analysis of growth time-dependent antibiotic susceptibility constitutes a necessary first step toward the development of reliable medical treatments based on the use of these new antimicrobial agents.
In food microbiology, on the other hand, microbial growth patterns (i.e., growth as a function of time) under diverse circumstances have been extensively studied. The literature reports a large number of empirical and phenomenological equations called primary and secondary models that can be applied to describe the growth or inactivation of microorganisms in food from optical density data (6–9). Most of these models allow for the determination of three key growth parameters that can be obtained by curve-fitting procedures, i.e., lag time, maximum specific growth rate, and asymptotic growth level, which depend on external conditions and/or the presence of antimicrobials. But these studies also revealed that, almost invariably, several models can be used to fit the same set of experimental data, yielding very different values and contradictory conclusions (7). Indeed, there is no theoretical reason that growth parameters should always rise and fall in unison in response to changes in external conditions, as predicted by the mathematical relations that the equations employed established between them. External factors might affect growth characteristics in a manner that can only be revealed experimentally.
In this paper, an easy-to-use algorithm that can be readily applied in commonly used spreadsheets is presented to study the effect of antimicrobials on the growth of microorganisms focusing on the growth pattern in its entirety. Contrary to the growth models mentioned above, it is assumed that growth everywhere along the curve depends on ambient conditions in a manner that need not follow any mathematically established relationship, and thus, complete curves of the rate and acceleration of the growth are presented. By examining, as described, the entire time progress of antimicrobial activity, different effective exposure times and concentration-dependent effects on microbial growth could become evident. Importantly, this knowledge will potentially allow identification of true differences in efficacy among antimicrobial drugs for their applications in human health, food security, and the environment.
RESULTS AND DISCUSSION
Cell growth, growth rate, and acceleration profiles.
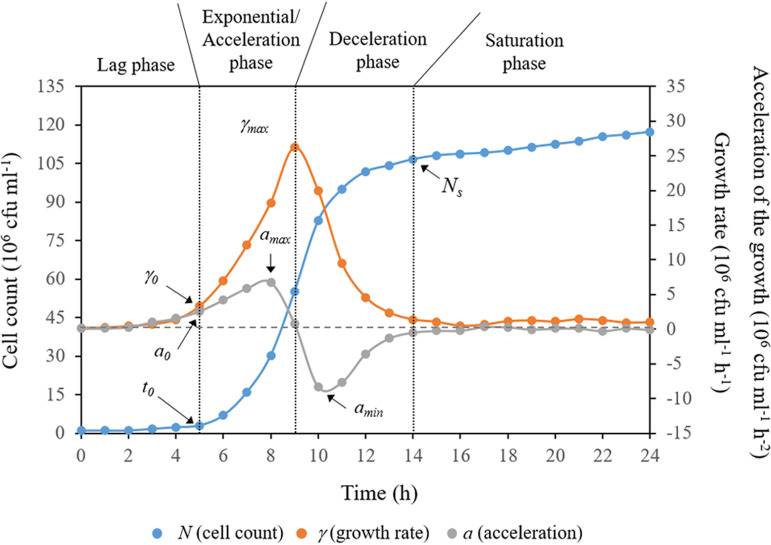
As an example, Fig. 1 displays typical cell count data as a function of time, growth rate, and acceleration of the growth for Streptococcus sanguinis in the absence of propolis. These curves, regardless of the condition investigated, could be easily partitioned into four distinguishable phases, (i) the lag phase, which provides a marker of the onset of the accelerated growth regime, (ii) the exponential phase, when growth starts accelerating and the total number of cells increases rapidly with time, (iii) the deceleration phase, when the total number of the cells tends to asymptote, and (iv) the saturation or stationary phase, where growth ceases due to resource exhaustion and/or waste accumulation. As can be further observed, the growth rate curve is approximately bell-shaped, with its peak corresponding to the inflection point of growth during the exponential phase. This inflection point signals the beginning of a decline in the growth rate. On the other hand, the growth acceleration graph displays a combination of two bell-shaped curves, the first one characterized by a peak and the second one by a valley. The peak designates the point where the acceleration starts descending toward a zero value. The point at which the acceleration is exactly zero coincides with the inflection of the exponential growth, which marks the onset of the growth deceleration (i.e., negative acceleration). The latter corresponds to the entire concave section of the acceleration curve, with the very bottom of the valley indicating that growth is moving toward stagnation.
FIG 1.
Typical example of cell count data as a function of time, growth rate, and acceleration of the growth for S. sanguinis in the absence of propolis. Growth rate and acceleration represent the first- and second-order derivatives of the cell count data (i.e., the growth curve) as a function of time. The four distinguishable phases into which these curves were partitioned, and the main growth parameters obtained from them are displayed.
It is immediately evident from these curves that conventional endpoint antimicrobial susceptibility testing is likely insufficient for tracking potential changes in microbial growth profiles. In such cases, the determination of MIC, MBC, or maximum specific growth rates alone might be of very limited value if differences in other growth characteristics become much more important in practice. Thus, accurate quantification of the antimicrobial effect of an extract or pure compound would require that the entire growth pattern is fully addressed.
Monitoring microbial growth in the presence of SEEP.
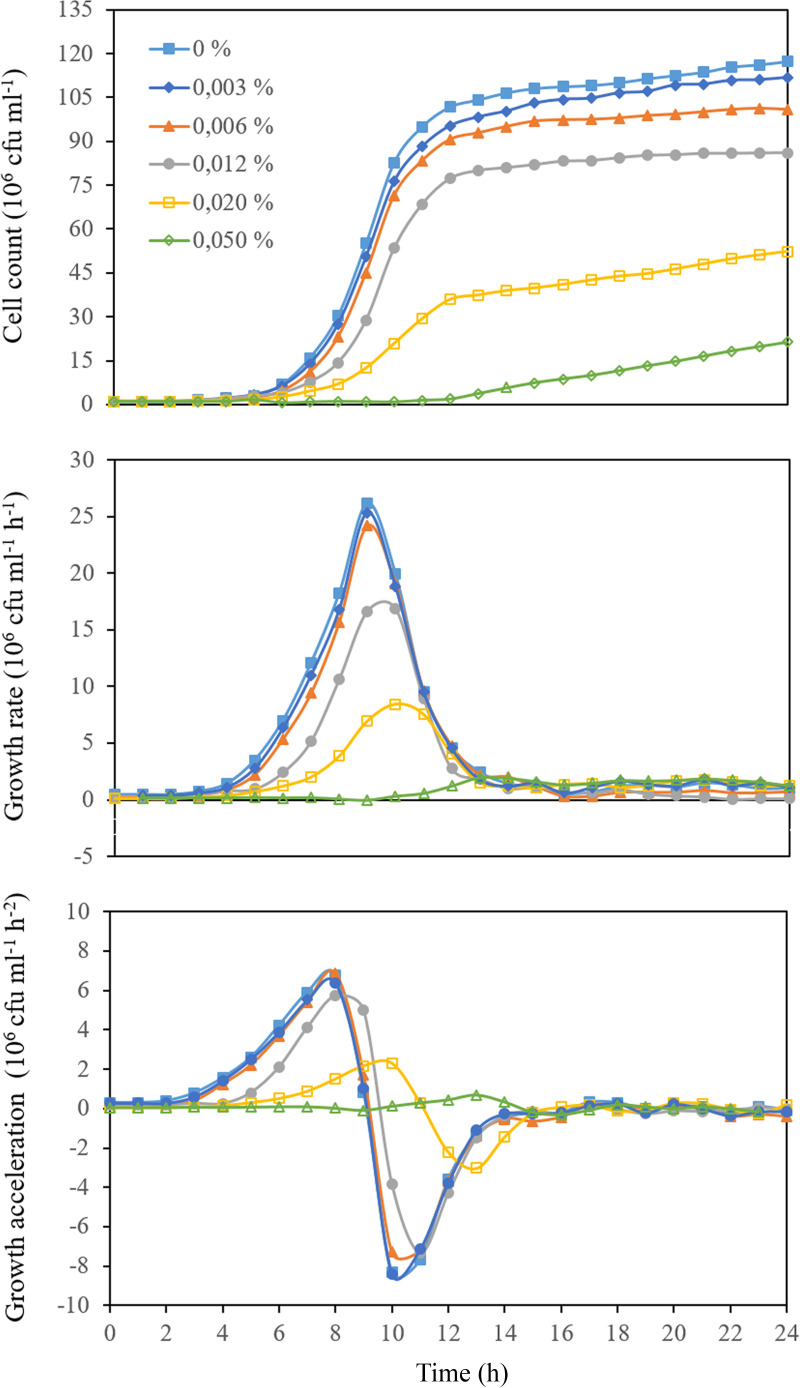
Figure 2 illustrates the growth, growth rate, and acceleration of the growth of S. sanguinis exposed to different sub-MICs of Spanish ethanolic extracts of propolis (SEEP) (the MIC and MBC values of SEEP estimated in the current study for the selected strain were 60 μg/mL [0.1%] and 120 μg/mL [0.2%], respectively). The shape of these curves is a reflection of cellular events, regulated by biochemical and biophysical processes, occurring upon dynamic interaction of the cells with the test antimicrobial agent. Therefore, to better compare the curves, these were decomposed into usable metrics by determining the following key parameters (see Fig. 1): lag time (t0), starting growth rate (γ0), initial acceleration of the growth (a0), maximum growth rate (γmax), and maximum acceleration (amax) and deceleration (amin) of the growth and the total number of cells at the beginning of the saturation phase (Ns) (i.e., at near-zero acceleration). The time points at which these parameters occurred were also recorded. The values obtained are compiled in Table S1 in the supplemental material for each of the conditions investigated and discussed below.
FIG 2.
Representative examples of growth, growth rate, and acceleration curves for S. sanguinis exposed to different sub-MICs of SEEP.
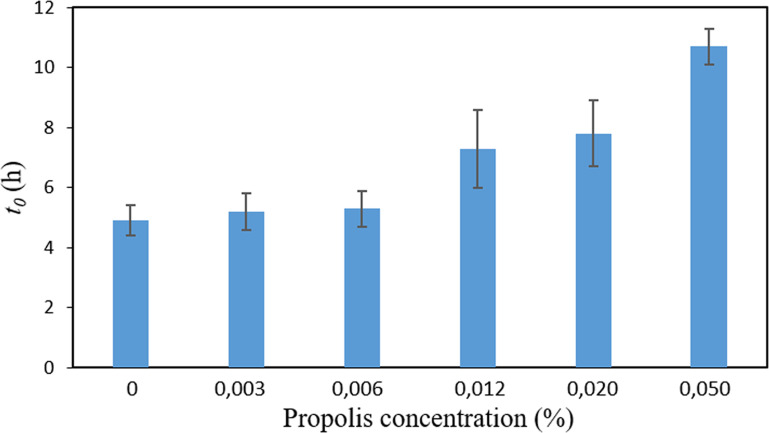
Figure 3 shows the lag-phase duration (t0) for cultures containing the different sub-MICs of SEEP studied. At this point, it is important to recall that the lag time has been traditionally defined as the point of intersection of the tangent to the growth curve at the exponential phase with the time axis (9–12). This “geometric” definition does not necessarily correspond with the “physiological” lag time, which is determined by the onset of the accelerated growth regime (Fig. S1). Thus, the second-order derivative of the growth curve (Fig. 1) allows us to properly determine the physiological lag time. Figure 3 indicates that the growth of S. sanguinis was delayed up to ∼7 to 11 h in the presence of 0.012 to 0.05% (one-eighth to one-half the MIC) of SEEP (i.e., ∼ 2 to 6 h longer than the lag period associated with the untreated cells). A previous study on the adaptation of bacterial cells to propolis revealed that the selection of resistant forms, most typically induced by bacteriostatic rather than bactericidal agents, did not occur upon repeated exposure of the cells to the relevant concentration of this antimicrobial agent (13). It was further shown that propolis has a bactericidal rather than bacteriostatic action through the combination of time-kill and growth curve assays. It has also been previously proven, through a combination of physicochemical techniques, that SEEP provoked at least localized cell wall damage and/or perturbation at sub-MICs, disrupting the physical integrity of the wall of the cells investigated (14). Moreover, it is worth noting that the MIC and MBC values here obtained for SEEP are very close to each other, an observation typically attributed to bactericidal agents (15). Therefore, based on these observations, it is hypothesized that extended lag times here detected could be explained by the suggested bactericidal effect of propolis, with the consequent growth of the remaining (surviving) cells after the destruction and/or inactivation of some of the propolis-active molecules. The culture thus would spend more time in reaching a concentration where the optical density (OD) value increases above the lag level. Moreover, it is here observed that the delayed onset of growth induced by the presence of SEEP concentrations of 0.012% or higher correlates with a subsequent delay of the time points at which the resting growth parameters occur, i.e., γmax, amax, amin, and Ns (see Table S1 and Fig. S2).
FIG 3.
Lag-phase duration (t0) for cultures of S. sanguinis containing the different sub-MICs of SEEP studied. Data shown as mean ± SD.
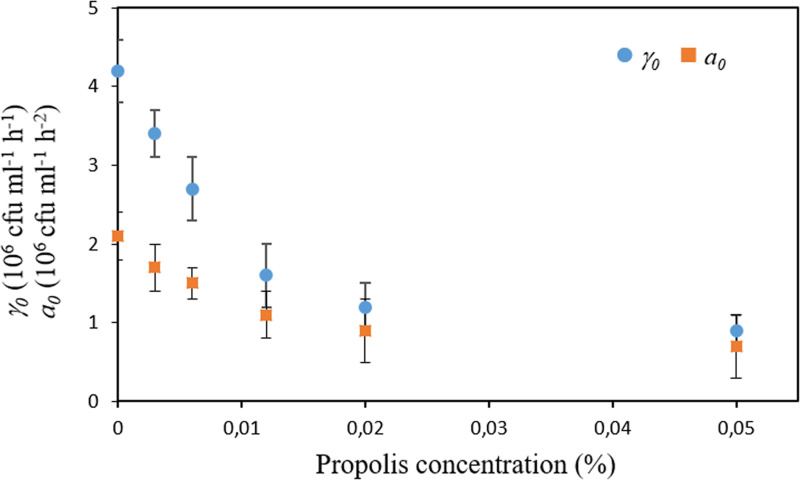
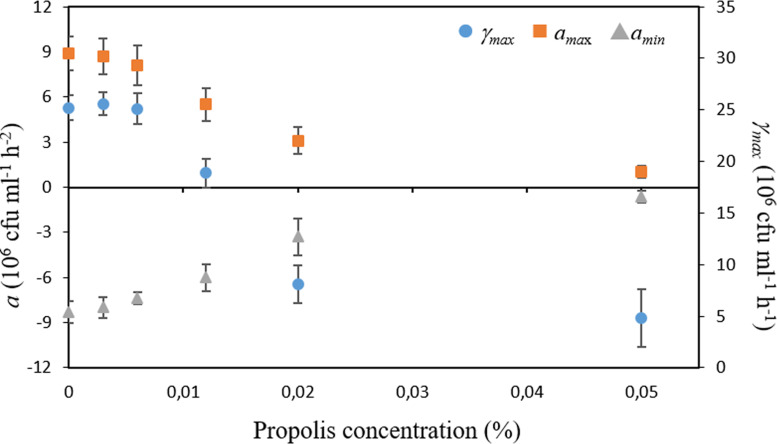
Interestingly, after the adaptation lag period, where cells are adjusting to their new environmental conditions, they resume growth at an initial rate (γ0) and acceleration (a0) that were affected by all the sub-MICs concentrations studied (Fig. 4). In particular, both parameters were found to decay exponentially with the increase of the SEEP concentration. Despite the decline in both the initial growth rate and acceleration in the presence of the lowest SEEP concentrations of 0 to 0.006% (0 to 1/16 MIC), similar γmax and amax/amin values were determined for cultures treated with these lower concentrations of propolis (Fig. 5). Therefore, mild exposure to this antimicrobial seems to have an impact on the initial rate and acceleration with which cultures resume growth after the adaptation/selection period but not on the maximum growth rate itself or the maximum/minimum acceleration reached during the entire process of growth. Once the SEEP concentration of 0.012% (one-eighth the MIC) is attained, these parameters, i.e., γmax, amax, and amin, were found to decay exponentially with the increase of the SEEP concentration (Fig. 5).
FIG 4.
Initial rate (γ0) and acceleration (a0) with which S. sanguinis resumed growth after the adaptation lag period as a function of the SEEP concentration. Data shown as mean ± SD.
FIG 5.
Maximum growth rate (γmax) and maximum growth acceleration (amax) and deceleration (amin) experienced by S. sanguinis as a function of the SEEP concentration at which it was exposed during growth. Data shown as mean ± SD.
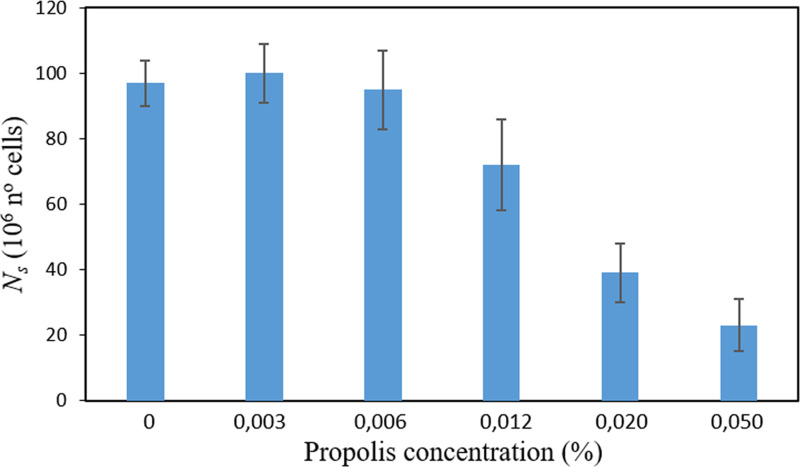
Moreover, it is observed that a near-zero acceleration data point is intimately related to the stationary state (Fig. 1). At this point, it is important to remind that the estimation of the asymptotic growth level, i.e., the total number of cells when growth has entirely ceased, is typically tricky if a clearly discernible “stationary/saturation phase” has not been reached during experimentation. The regression procedures commonly used for its determination as an extrapolated value might be unstable or yield different results if different statistical fit criteria are employed (7). To circumvent this problem, the Ns is here defined at the point at which the deceleration phase ends (i.e., for a, it is ∼0, occurring after the inflection point). Interestingly, it was found the effect of propolis on Ns is similar to that found for γmax, amax, and amin, i.e., cells reached similar values of Ns for low SEEP concentrations (0 to 0.006%) but decay exponentially as the concentration of SEEP surpasses 0.012% (Fig. 6). This finding thus suggests, for the particular conditions here studied, a direct relation between Ns and the just-mentioned parameters (see Fig. S3 as an example).
FIG 6.
Total number of S. sanguinis cells at the beginning of the saturation phase (Ns) in the presence of SEEP at different sub-MICs. Data shown as mean ± SD.
Therefore, decomposition of growth curves into growth rate and acceleration seems to be a powerful tool to monitor bacterial growth and the impact of antimicrobial agents. In particular, it provides direct data of the kinetics of growth, both in the absence and presence of antimicrobials, throughout all the phases that typically characterize bacterial growth (i.e., lag, exponential, deceleration, and saturation phases), thus avoiding the uncertainty associated with the selection of mathematical models and data-fitting procedures. This information is expected to be relevant, for instance, to assess whether or not cell multiplication might result in an infection level at a certain state in time (for instance, in food processing systems or when a small number of bacteria enter the human body, a fact that greatly depends on the kinetic of the contaminated cells as well as whether they are able to grow in the presence of some antimicrobial). Moreover, it is well-known that current dosing regimens for antimicrobial agents are typically designed to maintain serum drug levels above the MIC of the pathogens for the greatest possible proportion of the dosing interval. The results here presented showed, however, that drug concentrations below the MIC (in particular, one-eighth to one-half the MIC of SEEP) delayed growth up to ∼7 to 11 h with respect to the control, thus having an initial inhibitory or bactericidal activity not maintained during the 24-h incubation. Intermittent dosing of these concentrations, for instance, could likely prevent regrowth after serum concentrations fall below the MIC for this particular antimicrobial. In this regard, it becomes evident that the novel numerical procedure here presented provides improved knowledge of the time course of antimicrobial activity that could potentially be useful for the designing of, for example, optimal dosage regimes.
Conclusions. In this paper, a simple numerical procedure is presented to monitor the growth of S. sanguinis over time using a cost- and time-effective measurement method (i.e., the measurement of optical density) in the absence and presence of propolis, a natural antimicrobial. In particular, it is shown that decomposing growth curves into growth rate and acceleration can be applied to directly assess important growth parameters and the time course of antimicrobial activity. The results obtained reveal, for instance, that sub-MICs of propolis display a substantial initial inhibitory or bactericidal activity that would have gone entirely undetected by the sole determination of MIC. It is likely that by examining growth over time, using this method for different effective exposure times, concentration-dependent effects, or true differences in efficacy among antimicrobial compounds might be easily identified. Moreover, this type of result further provides insight into predictive microbiology and will likely help the food microbiologist to reformulate or validate the existing mathematical models, which comes from their ability to correctly predict experimental results. The numerical methodology here presented allows experimental determination of all the growth parameters typically involved in these mathematical models, thus becoming an important source of experimental data for their validation.
MATERIALS AND METHODS
Test organism and cultivation conditions.
Streptococcus sanguinis, a normal inhabitant of the human oral cavity, was used as a test organism. In particular, the strain employed, i.e., S. sanguinis ATCC 10556 (American Type Culture Collection [ATCC], Manassas, VA, USA), was directly obtained from the Spanish Type Culture Collection (CECT, Burjassot, Valencia). This strain was initially inoculated in blood agar plates (Oxoid Ltd., Basingstoke, Hampshire, UK) and incubated for 24 to 48 h in an incubator (New Brunswick Galaxy 170S; Eppendorf AG, Hamburg, Germany) conditioned with 5% CO2 at 37°C to obtain isolated colonies. Subsequently, under the same environmental conditions, it was cultivated in brain heart infusion agar (Oxoid Ltd., Basingstoke, Hampshire, UK) to refresh colonies. A single colony was then transferred into 5 mL of trypticase soy broth (BBL TSB; Becton, Dickinson and Company, Spark, NV, USA) supplemented with 1% sucrose (TSBS) to obtain pure cultures, where cells were again incubated overnight in the presence of a 5% CO2 atmosphere at 37°C. Bacterial suspensions were finally adjusted to 82% of transmittance at 492 nm in TSBS using a horizontal light spectrophotometer (Helios Epsilon; Thermo Scientific, Waltham, MA, USA) and cuvettes with a fixed light path of 1.0 cm. Subsequently, they were diluted 1:100 in TSBS to obtain ∼106 CFU/mL for experimentation. This final concentration was confirmed using the viable plate count method.
Test antimicrobial compound and antimicrobial assay.
Propolis, a natural antibacterial substance produced by honeybees, was chosen as a test antimicrobial agent. Specifically, the samples employed were Spanish ethanolic extracts of propolis (SEEP), for which chemical composition and antimicrobial capacity have been recently reported (4, 14, 16). In particular, it was found that this new SEEP contains large amounts of polyphenols, more than half of the flavonoid class, and newly identified antioxidant and antimicrobial compounds also present in olive oil (i.e., vanillic acid, 1-acetoxypinoresinol, p-HPEA-EA, and 3,4-DHPEA-EA) never detected before in propolis samples. The extracts were filtered as received with a 0.45-μm syringe filter (Merck Millipore, Darmstadt, Germany) and stored at 4°C until use. Final concentrations of SEEP ranging from 30 to 7,688 μg/mL (0.05% [vol/vol] to 12.5% [vol/vol]) were employed during experiments.
The antibacterial activity of SEEP was determined according to guidelines of Clinical and Laboratory Standards Institute (CLSI) (17, 18) but utilizing a different culture medium for the strains selected, i.e., TSBS. In particular, the MIC was obtained by serial dilutions of propolis in TSBS containing ∼106 CFU/mL, which were incubated in the presence of a 5% CO2 atmosphere for 24 h at 37°C. The MIC value was reported as the lowest concentration of SEEP that inhibited the visible growth of the tested microorganism. The minimal bactericidal concentration (MBC) was determined on agar (brain heart infusion agar; Oxoid Ltd.) under the same environmental conditions and represents the lowest concentration of SEEP that precluded bacterial growth after an incubation time of 24 h. Based on these results, proper sub-MICs of SEEP were selected to be used in the resting experiments.
Optical density growth curves.
The growth of S. sanguinis was assessed by measuring the increase in optical density (OD) as a function of time at 492 nm using a microplate spectrophotometer reader (ELx800; Bio-Tek Instruments, Inc. Winooski, VT, USA). The measurement of optical density, which remains a central technique to monitor bacterial growth in microbiology, has the advantage of being an inexpensive, fast, and nondestructive technique to obtain the total number of cells in a solution, but it is important to note, however, that it does not provide any information regarding the metabolic activity or viability of the cells. For these experiments, the propolis-filtered solution was diluted in TSBS at different sub-MICs and preincubated at 37°C. Each dilution (100 μL) was dispensed into a polystyrene 96-well microtiter plate (Greiner Bio-One, Frickenhausen, Germany) already containing 100 μL of the prepared bacterial inoculums (∼106 CFU/mL) under the environmental conditions described above. Positive and negative controls, containing TSBS instead of propolis and propolis instead of bacteria, respectively, were also included. The plates were incubated in a humidified atmosphere containing 5% CO2 at 37°C, and the OD of the samples was recorded at 1-h intervals during a 24-h period. The suspensions were homogenized with a slight orbital shaking for 10 s prior to each OD reading. OD data were transformed into cell counts (i.e., CFU/mL) via calibration curves as previously described (19). Please note that the total number of cells per unit volume (i.e., CFU/mL), and not the log of the total number of cells per unit volume, was used for further data analysis.
Data analysis.
Growth curves, i.e., the cell count data as a function of time, were subjected to the first- and second-order derivatives using the data analysis tool implemented in Origin 8.0 (OriginLab Corporation, USA). In practice, Origin treats discrete data by the transform of the centered difference formula (https://www.originlab.com/doc/Origin-Help/Math-Differentiate) and calculates the numerical derivative at each point of the curve by taking the average of the slopes between the point and its two closest neighbors. The first derivate, i.e., the slope of the tangent line to the cell count curve at each point, represents thus the rate of growth. On the other hand, the second derivative, i.e., the derivative of the derivative, displays the acceleration of the growth. From these curves, describing the entire time course of antimicrobial activity under the conditions investigated, the following parameters were obtained and compared: lag time (t0), starting growth rate (γ0), initial acceleration of the growth (a0), maximum growth rate (γmax), and maximum acceleration (amax) and deceleration (amin) of the growth and the total number of cells at the beginning of the saturation phase (Ns) (i.e., at near-zero acceleration). In particular, all curves were inspected visually to obtain the values of these parameters (Fig. 1). The t0 was determined by the first point that statistically deviated from zero in the acceleration curves. This particular time point further defined the γ0 and a0 as obtained from the growth rate and acceleration curves, respectively. The γmax, amax, and amin of the growth were provided by the inflections points of the growth rate and acceleration curves. Finally, Ns was inferred by the total number of cells per unit volume measured at the time point at which the deceleration phase ended. The time at which these parameters occurred was also recorded. The data presented represent the average ± standard deviation (SD) resulting from the analysis of at least three curves obtained from independent cultures.
Data availability.
Materials and data generated in this study will be made available upon reasonable request to the corresponding author.
ACKNOWLEDGMENTS
We gratefully acknowledge financial support from the Consejería de Economía e Infraestructuras, Junta de Extremadura, and European Regional Development Fund (European FEDER; IB16154, GR18096, and GR18153).
We also thank Artesanos Virgen de Extremadura S.L., Badajoz, Spain, for kindly providing the samples of propolis.
Footnotes
Supplemental material is available online only.
Contributor Information
Virginia Vadillo-Rodríguez, Email: vvadillo@unex.es.
Arpita Bose, Washington University in St. Louis.
REFERENCES
- 1.Runyoro DKB, Matee MIN, Ngassapa OD, Joseph CC, Mbwambo ZH. 2006. Screening of Tanzanian medicinal plants for anti-Candida activity. BMC Complement Altern Med 6:11. 10.1186/1472-6882-6-11. [DOI] [PMC free article] [PubMed] [Google Scholar]
- 2.Mabona U, Viljoen A, Shikanga E, Marston A, Van Vuuren S. 2013. Antimicrobial activity of southern African medicinal plants with dermatological relevance: from an ethnopharmacological screening approach, to combination studies and the isolation of a bioactive compound. J Ethnopharmacol 148:45–55. 10.1016/j.jep.2013.03.056. [DOI] [PubMed] [Google Scholar]
- 3.Nazzaro F, Fratianni F, De Martino L, Coppola R, De Feo V. 2013. Effect of essential oils on pathogenic bacteria. Pharmaceuticals (Basel) 6:1451–1474. 10.3390/ph6121451. [DOI] [PMC free article] [PubMed] [Google Scholar]
- 4.Fernández-Calderón MC, Navarro-Pérez ML, Blanco-Roca MT, Gómez-Navia C, Pérez-Giraldo C, Vadillo-Rodríguez V. 2020. Chemical profile and antibacterial activity of a novel Spanish propolis with new polyphenols also found in olive oil and high amounts of flavonoids. Molecules 25:3318. 10.3390/molecules25153318. [DOI] [PMC free article] [PubMed] [Google Scholar]
- 5.Reller LB, Weinstein M. 2009. Antimicrobial susceptibility testing: a review of general principles and contemporary practices. Clin Infect Dis 49:1749–1755. 10.1086/647952. [DOI] [PubMed] [Google Scholar]
- 6.Valero A, Pérez-Rodríguez F, Carrasco E, García-Gimeno RM, Zurera G. 2006. Modeling the growth rate of Listeria monocytogenes using absorbance measurements and calibration curves. J Food Science 71:M257–M264. 10.1111/j.1750-3841.2006.00139.x. [DOI] [Google Scholar]
- 7.Peleg M, Corradini MG. 2011. Microbial growth curves: what the models tell us and what they cannot. Crit Rev Food Sci Nutr 51:917–945. 10.1080/10408398.2011.570463. [DOI] [PubMed] [Google Scholar]
- 8.Pla ML, Oltra S, Esteban MD, Andreu S, Palop A. 2015. Comparison of primary models to predict microbial growth by the plate count and absorbance methods. Biomed Res Int 2015:365025. 10.1155/2015/365025. [DOI] [PMC free article] [PubMed] [Google Scholar]
- 9.Longhi DA, Dalcanton F, de Aragão GMF, Carciofi BAM, Laurindo JB. 2017. Microbial growth models: a general mathematical approach to obtain μmax and λ parameters from sigmoidal empirical primary models. Braz J Chem Eng 34:369–375. 10.1590/0104-6632.20170342s20150533. [DOI] [Google Scholar]
- 10.Pirt SJ. 1975. Principles of microbe and cell cultivation. Blackwell, London, UK. [Google Scholar]
- 11.Smelt JPPM, Otten GD, Bos AP. 2002. Modelling the effect of sublethal injury on the distribution of the lag times of individual cells of Lactobacillus plantarum. Int J Food Microbiol 73:207–212. 10.1016/S0168-1605(01)00651-1. [DOI] [PubMed] [Google Scholar]
- 12.Metris A, George SM, Baranyi J. 2006. Use of optical density detection times to assess the effect of acetic acid on single-cell kinetics. Appl Environ Microbiol 72:6674–6679. 10.1128/AEM.00914-06. [DOI] [PMC free article] [PubMed] [Google Scholar]
- 13.Mirzoeva OK, Grishanin RN, Calder PC. 1997. Antimicrobial action of propolis and some of its components: the effects on growth, membrane potential and motility of bacteria. Microbiol Res 152:239–246. 10.1016/S0944-5013(97)80034-1. [DOI] [PubMed] [Google Scholar]
- 14.Vadillo-Rodríguez V, Cavagnola MA, Pérez-Giraldo C, Fernández-Calderón MC. 2021. A physico-chemical study of the interaction of ethanolic extracts of propolis with bacterial cells. Colloids Surf B Biointerfaces 200:111571. 10.1016/j.colsurfb.2021.111571. [DOI] [PubMed] [Google Scholar]
- 15.Lara HH, Ayala-Núñez LV, Turrent LCI, Padilla CR. 2010. Bactericidal effect of silver nanoparticles against multidrug-resistant bacteria. World J Microbiol Biotechnol 26:615–621. 10.1007/s11274-009-0211-3. [DOI] [Google Scholar]
- 16.Fernández-Calderón MC, Hernández-González L, Gómez-Navia C, Blanco-Blanco MT, Sánchez-Silos R, Lucio L, Pérez-Giraldo C. 2021. Antifungal and anti-biofilm activity of a new Spanish extract of propolis against Candida glabrata. BMC Complement Med Ther 21:147. 10.1186/s12906-021-03323-0. [DOI] [PMC free article] [PubMed] [Google Scholar]
- 17.Clinical and Laboratory Standards Institute. 2018. Methods for dilution antimicrobial susceptibility test for bacteria that grow aerobically. 11th ed. CLSI standard M07. Clinical and Laboratory Standards Institute, Wayne, PA. [Google Scholar]
- 18.Clinical and Laboratory Standards Institute. 2020. Performance standards for antimicrobial susceptibility testing, 30th ed. CLSI supplement M100. Clinical and Laboratory Standards Institute, Wayne, PA. [Google Scholar]
- 19.Francois K, Devlieghere F, Standaert AR, Geeraerd AH, Cools I, Van Impe JF, Debevere J. 2005. Environmental factors influencing the relationship between optical density and cell count for Listeria monocytogenes. J Appl Microbiol 99:1503–1515. 10.1111/j.1365-2672.2005.02727.x. [DOI] [PubMed] [Google Scholar]
Associated Data
This section collects any data citations, data availability statements, or supplementary materials included in this article.
Supplementary Materials
Table S1, Fig. S1 to S3. Download aem.01849-21-s0001.pdf, PDF file, 0.2 MB (171.2KB, pdf)
Data Availability Statement
Materials and data generated in this study will be made available upon reasonable request to the corresponding author.


