Figure 8. The time course and amplitude of INaR are recapitulated during repetitive brief depolarizing steps.
To determine if two competing inactivation states underlie the observed differences in INaT and INaR recovery from inactivation (illustrated in Figure 5), a protocol was developed to allow direct comparison of INaR recorded during a single (80 ms) hyperpolarizing voltage step to –45 mV (red), presented following a brief (5 ms) depolarization to 0 mV, with INaR recorded (in the same cell) at –45 mV during successive brief (2 ms) hyperpolarizing voltage steps interspersed with brief (5 ms) depolarizations to 0 mV (black). Representative records are shown in (A); the voltage-clamp paradigms are illustrated below the current records. Similar results were obtained in four additional Purkinje neurons. As is evident (A), the envelope of the currents generated using these two protocols superimpose, suggesting that the inactivation pathway responsible for INaR decay does not compete with fast inactivation. (B) Simulated current waveforms, generated using the same two voltage-clamp protocols illustrated in (A) with the novel kinetic state model presented in Figure 3A, are shown. (C) Gating state occupancies for simulated current traces are shown with black representing the closed state, blue representing the open state, green representing the IC1+ IC2 states, aqua representing the IF2 state, orange representing the IF1 state, and purple representing the IS state. For direct comparison of the results of the simulations using the voltage-clamp protocols illustrated in (A) with the Raman-Bean gating model (2001), see Figure 8—figure supplement 1.
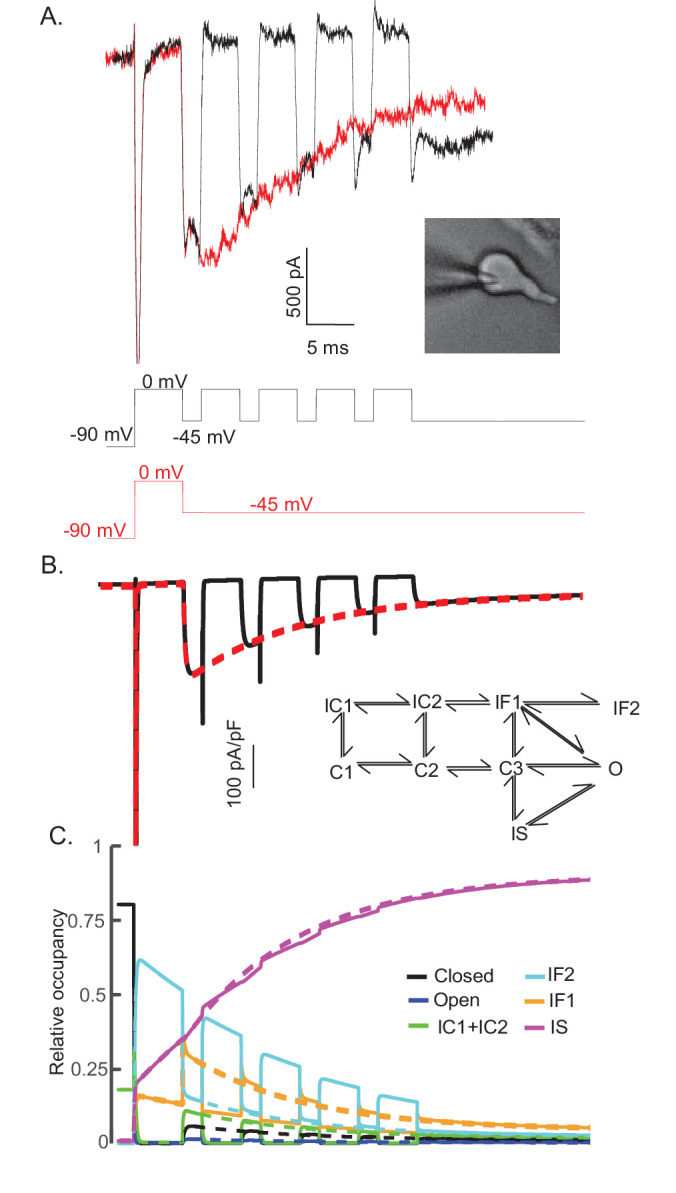
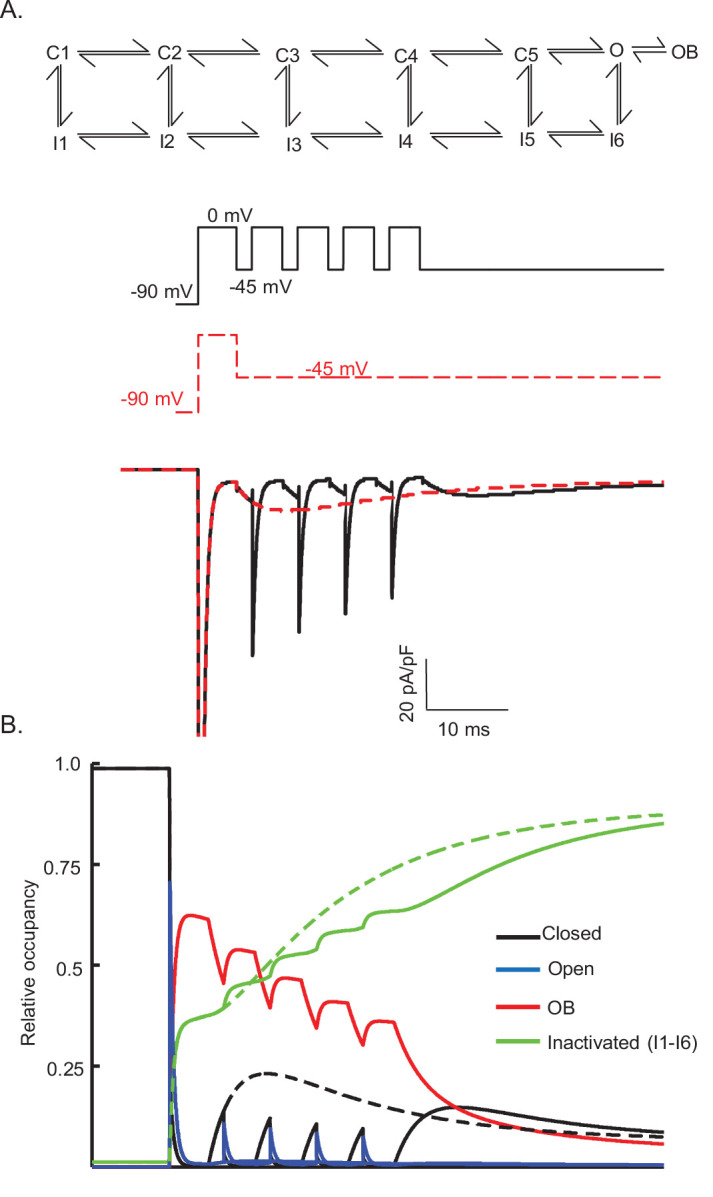
Figure 8—figure supplement 1. Gating state occupancies/transitions produced in the Raman-Bean model (with the voltage-clamp protocols used in Figure 8).