

Abstract
Using postsynaptically tethered calcium sensor GCaMP, we investigated spontaneous synaptic transmission at individual active zones (AZs) at the Drosophila (both sexes) neuromuscular junction. Optical monitoring of GCaMP events coupled with focal electrical recordings of synaptic currents revealed “hot spots” of spontaneous transmission, which corresponded to transient states of elevated activity at selected AZs. The elevated spontaneous activity had two temporal components, one at a timescale of minutes and the other at a subsecond timescale. We developed a three-state model of AZ preparedness for spontaneous transmission and performed Monte Carlo simulations of the release process, which produced an accurate quantitative description of the variability and time course of spontaneous transmission at individual AZs. To investigate the mechanisms of elevated activity, we first focused on the protein complexin, which binds the SNARE protein complex and serves to clamp spontaneous fusion. Overexpression of Drosophila complexin largely abolished the high-activity states of AZs, while complexin deletion drastically promoted it. A mutation in the SNARE protein Syntaxin-1A had an effect similar to complexin deficiency, promoting the high-activity state. We next tested how presynaptic Ca2+ transients affect the states of elevated activity at individual AZs. We either blocked or promoted Ca2+ influx pharmacologically, and also promoted Ca2+ release from internal stores. These experiments coupled with computations revealed that Ca2+ transients can trigger bursts of spontaneous events from individual AZs or AZ clusters at a subsecond timescale. Together, our results demonstrated that spontaneous transmission is highly heterogeneous, with transient hot spots being regulated by the SNARE machinery and Ca2+.
SIGNIFICANCE STATEMENT Spontaneous synaptic transmission is a vital component of neuronal communication, since it regulates the neuronal development and plasticity. Our study demonstrated that spontaneous transmission is highly heterogeneous and that nerve terminals create transient “hot spots” of spontaneous release of neuronal transmitters. We show that these hot spots are regulated by the protein machinery mediating the release process and by calcium ions. These results contribute to our understanding of spontaneous synaptic transmission as a dynamic, plastic, and tightly regulated signaling mechanism and unravel fundamental biophysical properties of neuronal communication.
Keywords: calcium, complexin, GCaMP, mEPSP, Monte Carlo, SNARE
Introduction
Synaptic transmission is a probabilistic process, and its stochastic properties are fundamental for the neuronal information transfer (Burnod and Korn, 1989; Stevens and Wang, 1994; Faure and Korn, 1997; Goda and Sudhof, 1997; Zador, 1998; Tarr et al., 2013a). Neuronal transmitters are released at morphologic specializations termed active zones (AZs), which represent clusters of VGCCs (Dolphin and Lee, 2020) surrounded by synaptic vesicles (SVs) and organized by scaffolding proteins (Ghelani and Sigrist, 2018; Gramlich and Klyachko, 2019). An action potential triggers Ca2+ influx, which drives the fusion and release of neuronal transmitters into the synaptic cleft. In addition, SV fusion can occur in a spontaneous mode, which is not directly coupled to the Ca2+ influx but may depend on local Ca2+ transients (Llano et al., 2000; Simkus and Stricker, 2002; Collin et al., 2005; Lefkowitz et al., 2009; Williams et al., 2012; Reese and Kavalali, 2015; Kavalali, 2020). Spontaneous transmission involves a segregated pool of SVs and dedicated molecular machinery (Crawford and Kavalali, 2015), thus representing a distinct form of neuronal communication (Kavalali, 2018), which regulates neuronal and behavioral plasticity, neuronal development, and homeostasis (McKinney et al., 1999; Sutton et al., 2006; Choi et al., 2014; Kavalali, 2015).
SVs are attached to the presynaptic membrane by a specialized protein complex, SNARE (Karatekin, 2018; Neher and Brose, 2018; Rizo, 2018; Brunger et al., 2019; Holz and Zimmerberg, 2019), and zippering of the SNARE complex drives the fusion of SVs with the presynaptic membrane. This process is regulated by the cytosolic protein complexin (Cpx), which binds the SNARE complex (Chen et al., 2002). Cpx regulates both evoked and spontaneous release components (Mohrmann et al., 2015) and serves as a fusion clamp for spontaneous transmission (Giraudo et al., 2006; Xue et al., 2009; Yang et al., 2013), with the latter function being more pronounced in invertebrates (Huntwork and Littleton, 2007; Xue et al., 2009; Jorquera et al., 2012; Wragg et al., 2013; Radoff et al., 2014).
Although molecular mechanisms regulating the spontaneous release of neuronal transmitters have been studied extensively (Crawford and Kavalali, 2015; Kavalali, 2015, 2020; P. Liu et al., 2018), the biophysical rules governing this form of neuronal communication remain obscure. Electrophysiology studies showed that the timings of spontaneous release events are not random (Cohen et al., 1974, 1981; Abenavoli et al., 2002; Leao et al., 2005), suggesting some unknown mechanisms for the temporal heterogeneity in spontaneous transmission. Furthermore, structural and optical studies demonstrated that the probabilities of action potential-evoked release are highly nonuniform across AZs (Wojtowicz et al., 1994; Peled and Isacoff, 2011; Ehmann et al., 2014), suggesting that this may also be the case for spontaneous transmission. Together, these studies raise the question of whether spontaneous transmission involves spatial and temporal heterogeneity, and if so, what mechanisms define the probabilities and timings of spontaneous release events at individual AZs.
Genetic encoding of the fluorescent Ca2+ sensor GCaMP enabled the visualization of postsynaptic Ca2+ influx in response to synaptic activity at individual release sites at the Drosophila larval neuromuscular junction (NMJ) (Peled and Isacoff, 2011). Subsequently, this method was modified to generate Drosophila lines that encoded membrane-tethered GCaMP variants that allow robust detection of all individual spontaneous exocytic events (Melom et al., 2013; Peled et al., 2014; Newman et al., 2017). This powerful approach unraveled the mechanisms underlying heterogeneity of action potential-evoked transmission (Akbergenova et al., 2018; Gratz et al., 2019) but also revealed that the evoked and spontaneous synaptic transmission at individual AZs is not correlated (Melom et al., 2013; Peled et al., 2014). We coupled the optical detection with electrophysiology and computer simulations to investigate the mechanisms controlling the spatial and temporal heterogeneity in spontaneous transmission across the ensemble of AZs.
Materials and Methods
Drosophila
Drosophila melanogaster colonies were cultured on standard medium at 25°C. The lines expressing myrCCaMP5 (Melom et al., 2013) or SynapGCaMP6f (Newman et al., 2017) were used for optical detection of spontaneous events. UAS-myrCCaMP5 was driven postsynaptically by the muscle driver mef2-Gal4. Cpx null cpx −/− (cpxSH1) (Huntwork and Littleton, 2007) and syx3-69 (Littleton et al., 1998) lines were crossed onto UAS-myrCCaMP5 background and recombined with mef2-Gal4. Cpx overexpression (OE) was performed using elav-Gal4 neuronal driver on the SynapGCaMP6f background. The UAS-myrCCaMP5, cpxSH1, UAS-cpx, and syx3-69 lines were kindly provided by J.T. Littleton. All the other lines, including the balancer TM3/TM6Tb and CyO strains used in the crosses, were obtained from Bloomington Drosophila Stock Center (Indiana University).
Third instar larvae of either sex were dissected in the modified HL3 solution containing the following (in mm): 70 NaCl, 5 KCl, 20 MgCl2, 10 NaHCO3, 5 trehalose, 115 sucrose, 2.5 HEPES acid, 2.5 HEPES salt, and 1 CaCl2) (Melom et al., 2013). All the experiments were performed on the 1b-type boutons of the muscles 6 and 7 at abdominal segments 2-4.
GCaMP imaging
Video recordings of GCaMP-expressing NMJs were performed continuously at 25 frames per second. Unless otherwise specified, the experiments were performed at GGaMP5-expressing preparations. The recording setup was built around Nikon Eclipse FN-1 upright microscope equipped with epifluorescence (Omega Optical XF115-2 FITC longpass filter set), 60× water immersion objective (2.8 mm working distance, 1.0 NA), X-CITE 120 LED lamp, and sCMOS PCO edge camera. The experiments, which showed a muscle contraction or fluorescence rundown over the recording period, were discarded. Unless otherwise specified, all the recordings were performed for 5 min, with the exception of the cpx−/− line. The cpx−/− line showed fast rundown because of the massive activity; therefore, the recordings at this line were performed for 2 min.
Image analysis
The in-house software package was developed for the analysis of video recording (stacks of images in tiff format). The code is written in MATLAB and available through GitHub (https://github.com/mabvmabv/CaMP-Image-analysis). The analysis is performed in the semiautomated mode at three levels. At the first level, we select the NMJ area, which is situated entirely in a single focal plane. The average background is computed over 300-800 frames (a parameter chosen by the experimenter) and subtracted from each frame. Then the histogram of fluorescence per pixel intensities is constructed, and the experimenter chooses the amplitude threshold (half of the maximal amplitude by default) for puncta detection. The puncta <5 pixels are classified as noise and eliminated. The experimenter selects the number of frames to visually examine the detection stages and then examines the following images for each selected frame: (1) original; (2) background subtracted; (3) pixels with the fluorescence values exceeding the threshold; and (4) detected puncta. Once the threshold is adjusted to yield the detection of all the puncta discriminated visually, the analysis proceeds to the second level, detecting puncta in the automated mode through the selected group of frames. The process then continues through the entire recording. The output from this level (https://github.com/mabvmabv/CaMP-Image-analysis/tree/Initial-image-analysis) represents a table listing the parameter of all the detected puncta, including the frame, coordinates of the weighted centroid, area, and mean and maximal fluorescence values.
At the next level (https://github.com/mabvmabv/CaMP-Image-analysis/tree/AZ-classification), hierarchical analysis is performed in an automated mode. All the detected puncta are grouped according to their positions and assigned to individual AZs. First, all the puncta detected at subsequent frames and having a distance below a cutoff value (3 pixels in our recordings) between their weighted centroids are grouped together as a single synaptic event. Only the puncta detected at two or more subsequent frames are classified as synaptic events. The puncta detected in a single frame are classified as noise and discarded. Subsequently, all the events are sorted according to their brightness, and the assignment proceeds to group all the events separated by less than the cutoff value as those produced by a single AZ. At this level, several output tables are generated, including the list of AZs and their coordinates (averaged from all the weighted centroids of the detected puncta), as well as the list of all the detected events at each AZ, including the event onset, the area, and the fluorescence.
Following the automated detection and classification, each recording was thoroughly examined visually. To construct fluorescent profiles of selected events and to measure the area of the imaged region of the NMJ, we used ImageJ software (National Institute of Health).
Electrophysiology
To record mEPSPs from GCaMP puncta, we modified the focal macropatch recordings technique (Vasin et al., 2016; Vasin and Bykhovskaia, 2017) to optimize the precision of electrode positioning. Patch electrodes (1-2 µm internal diameter, 2.5-3 mΩ resistance) were slightly fire polished and bent to enable recordings under the 60× water immersion objective (2.8 mm WD). The signal was acquired with Axoclamp 2-A amplifier and digitized with Digidata 1320A and PClamp software (Molecular Devices). The electrical recordings of the postsynaptic signals were performed in a gap-free mode and started simultaneously with video recordings of GCaMP activity.
In addition, we used the standard macropatch recording technique with a 5 µm electrode tip diameter as described by Vasin and Bykhovskaia (2017) to evaluate the effect of pharmacological manipulations on the mEPSP parameters. In-house software Quantan (Bykhovskaia, 2008) was used for the analysis of all the electrical recordings and measuring the mEPSP frequency and area.
Immunohistochemistry
Following the video recordings of GCaMP activity, the preparations were fixed for 45 min in the HL3 solution containing 4% PFA, then washed 6 times (for 15 min) in PBT (5 ml 10× PBS and 0.1% Triton X-100), incubated overnight with the primary anti-Brp antibody (mouse nc82, 1:12.5) in the blocking solution (10 ml of PBT with 200 mg BSA and 200 mg normal goat serum) at 4°C, then incubated in the secondary antibody (goat anti-mouse AlexaFluor-546, 1:50) for 2 h at room temperature, washed 6 times in PBT, mounted on a glass slide, and covered with Vectashield medium.
The images were taken with Carl Zeiss LSM-800 confocal microscope with Airyscan super-resolution (63 × 1.4 N/A oil immersion objective). Confocal images were acquired and processed with Airyscan ZEN software, which combines point-source excitation and array detection (maximum resolution XY of 140 nm, Z: 400 nm at 488 nm)
Statistical analysis
The activity and latency distributions were constructed using custom-made software written in MATLAB (https://github.com/mabvmabv/CaMP-Image-analysis/tree/GCaMP-Stats-Analysis), which processed the output files generated by the image analysis package. This package constructed the activity, and latency histograms and heatmaps performed the Poissonian fit for the activity distributions and evaluated the goodness-of-fit using χ2 statistics. Multiple comparisons were performed using one-way ANOVA followed by the Tukey's post hoc test, ANCOVA, or Kolmogorov–Smirnov test. The goodness of fit was evaluated using χ2 statistics. Comparison of the parameters derived from Monte Carlo (MC) simulations was performed using the magnitude of effect statistics.
MC simulations
MC simulations of spontaneous activity were performed using custom-made software (https://github.com/mabvmabv/CaMP-Image-analysis/tree/GCaMP-Monte-Carlo). Each step of the simulation corresponded to a single imaging time frame (40 ms). At each step, each AZ could transition to a different state or generate a release event. The probabilities of each transition or event corresponded to the rate constants described in Table 1. The outputs of the simulation included the timings of all the release events at each AZ. The detection resolution was set to 3 frames based on the analysis of the experimental data, and the pairs of events separated by <3 frames were counted as a single event. The histograms of the activity and latency distributions were constructed for each simulated dataset, and the fit between the simulated and experimental datasets (the distributions of activities and latencies) was performed using the χ2 statistics. To optimize the fit, the parameters of the simulation were adjusted sequentially. Ten MC runs were performed for each parameter set, and three cycles of the parameter adjustments were performed for each experimental condition.
Table 1.
Parameters describing the transitions between the functional states of AZsa
| NAZ/µm2b | rLA | k + HA | k - HA | rHA | k + SB | k - SB | rSB | |
|---|---|---|---|---|---|---|---|---|
| WT | 1.19 ± 0.08 | 0.176 ± 0.017 | 0.077 ± 0.008 | 3.0 ± 0.3 | 0.50 ± 0.07 | 15.7 ± 0.9 | 187.5 ± 12.1 | 65.2 ± 2.7 |
| Cpx OE | 0.69 ± 0.05 | — | 0.005 ± 0.004 | 7.5 ± 1.4 | 0.40 ± 0.03 | — | — | — |
| cpx +/− | 2.24 ± 0.09 | — | 0.091 ± 0.009 | 2.0 ± 0.3 | 0.94 ± 0.10 | — | — | — |
| cpx –/– | 3.85 ± 0.13 | — | 0.469 ± 0.021 | 1.2 ± 0.2 | 18.8 ± 1.4 | — | — | — |
| Syx3-69 | 2.24 ± 0.08 | — | 0.170 ± 0.016 | 0.65 ± 0.1 | 4.05 ± 0.45 | — | — | — |
| GV-58 | 1.56 ± 0.09 | — | — | — | — | 23.7 ± 1.2 | — | — |
| Cd2+ | 0.58 ± 0.06 | 0.154 ± 0.015 | — | — | — | 7.9 ± 0.4 | — | — |
aAll the rate constants (illustrated in Fig. 5A) are expressed in min−1. Only the parameters modified from WT control (GCaMP5-expressing) values are listed. —, Parameter has not been changed from WT.
bDensity of AZs was derived from the total number of AZs required to fit the pooled experimental data, divided by the total summated area of all the imaged NMJs.
Results
Spatial and temporal heterogeneity of spontaneous transmission at individual AZs
We took advantage of the Drosophila lines expressing myrGCaMP5 (Melom et al., 2013) or SynapGCaMP6f (Newman et al., 2017) and performed optical detection of spontaneous events at the larval NMJ. The individual spontaneous events were reliably detected in 1b boutons (Fig. 1A; Movie 1). To test whether the detected fusion events colocalize with morphologically defined AZs, we performed subsequent immunostaining for the AZ marker Bruchpilot (Brp) and imaged the preparations with super-resolution microscopy. The detected optical events largely colocalized with Brp puncta (Fig. 1B), although some Brp puncta (29.8 ± 3.7%, n = 9) did not show any GCaMP events over the recording period. To evaluate the resolution of the event detection, we constructed the histogram of the distances between closest neighbors for the detected GCaMP puncta versus Brp spots (Fig. 1C). Overall, the distributions were similar, and only a slight shift toward smaller values was observed for the Brp histogram for the spots separated by 200-250 nm (Fig. 1C, red). Since earlier ultrastructural analysis showed that the distances between neighboring AZs in 1b boutons range from 0.4 to 1.4 μm (Meinertzhagen et al., 1998), our result suggests that spontaneous events from individual AZs are largely discriminated.
Figure 1.

Detection of spontaneous events at individual AZs. A, A spontaneous GCaMP5 event is shown through successive time frames. Right, The fluorescent profile. B, The detected GCaMP5 events largely colocalize with Brp puncta, although some Brp puncta did not show GCaMP5 events over the recording time. Three examples of synaptic boutons are shown. C, The distribution of distances between neighboring GCaMP5 events (green) versus Brp puncta (red). Data collected from five different preparations. Scale bars, 1 µm.
Spontaneous activity at GCaMP5-expressing preparations shown in real-time.
Next, we quantified spontaneous activities at individual AZs and investigated variability across the AZ ensemble. In agreement with earlier studies (Melom et al., 2013; Peled et al., 2014), we found that the majority of AZs produced only a single event over the 5 min recording time period; however, some AZs generated several events per minute (Fig. 2A). These results were identical for the myrGCaMP5 and SynapGCaMP6f lines (Fig. 2B).
Figure 2.
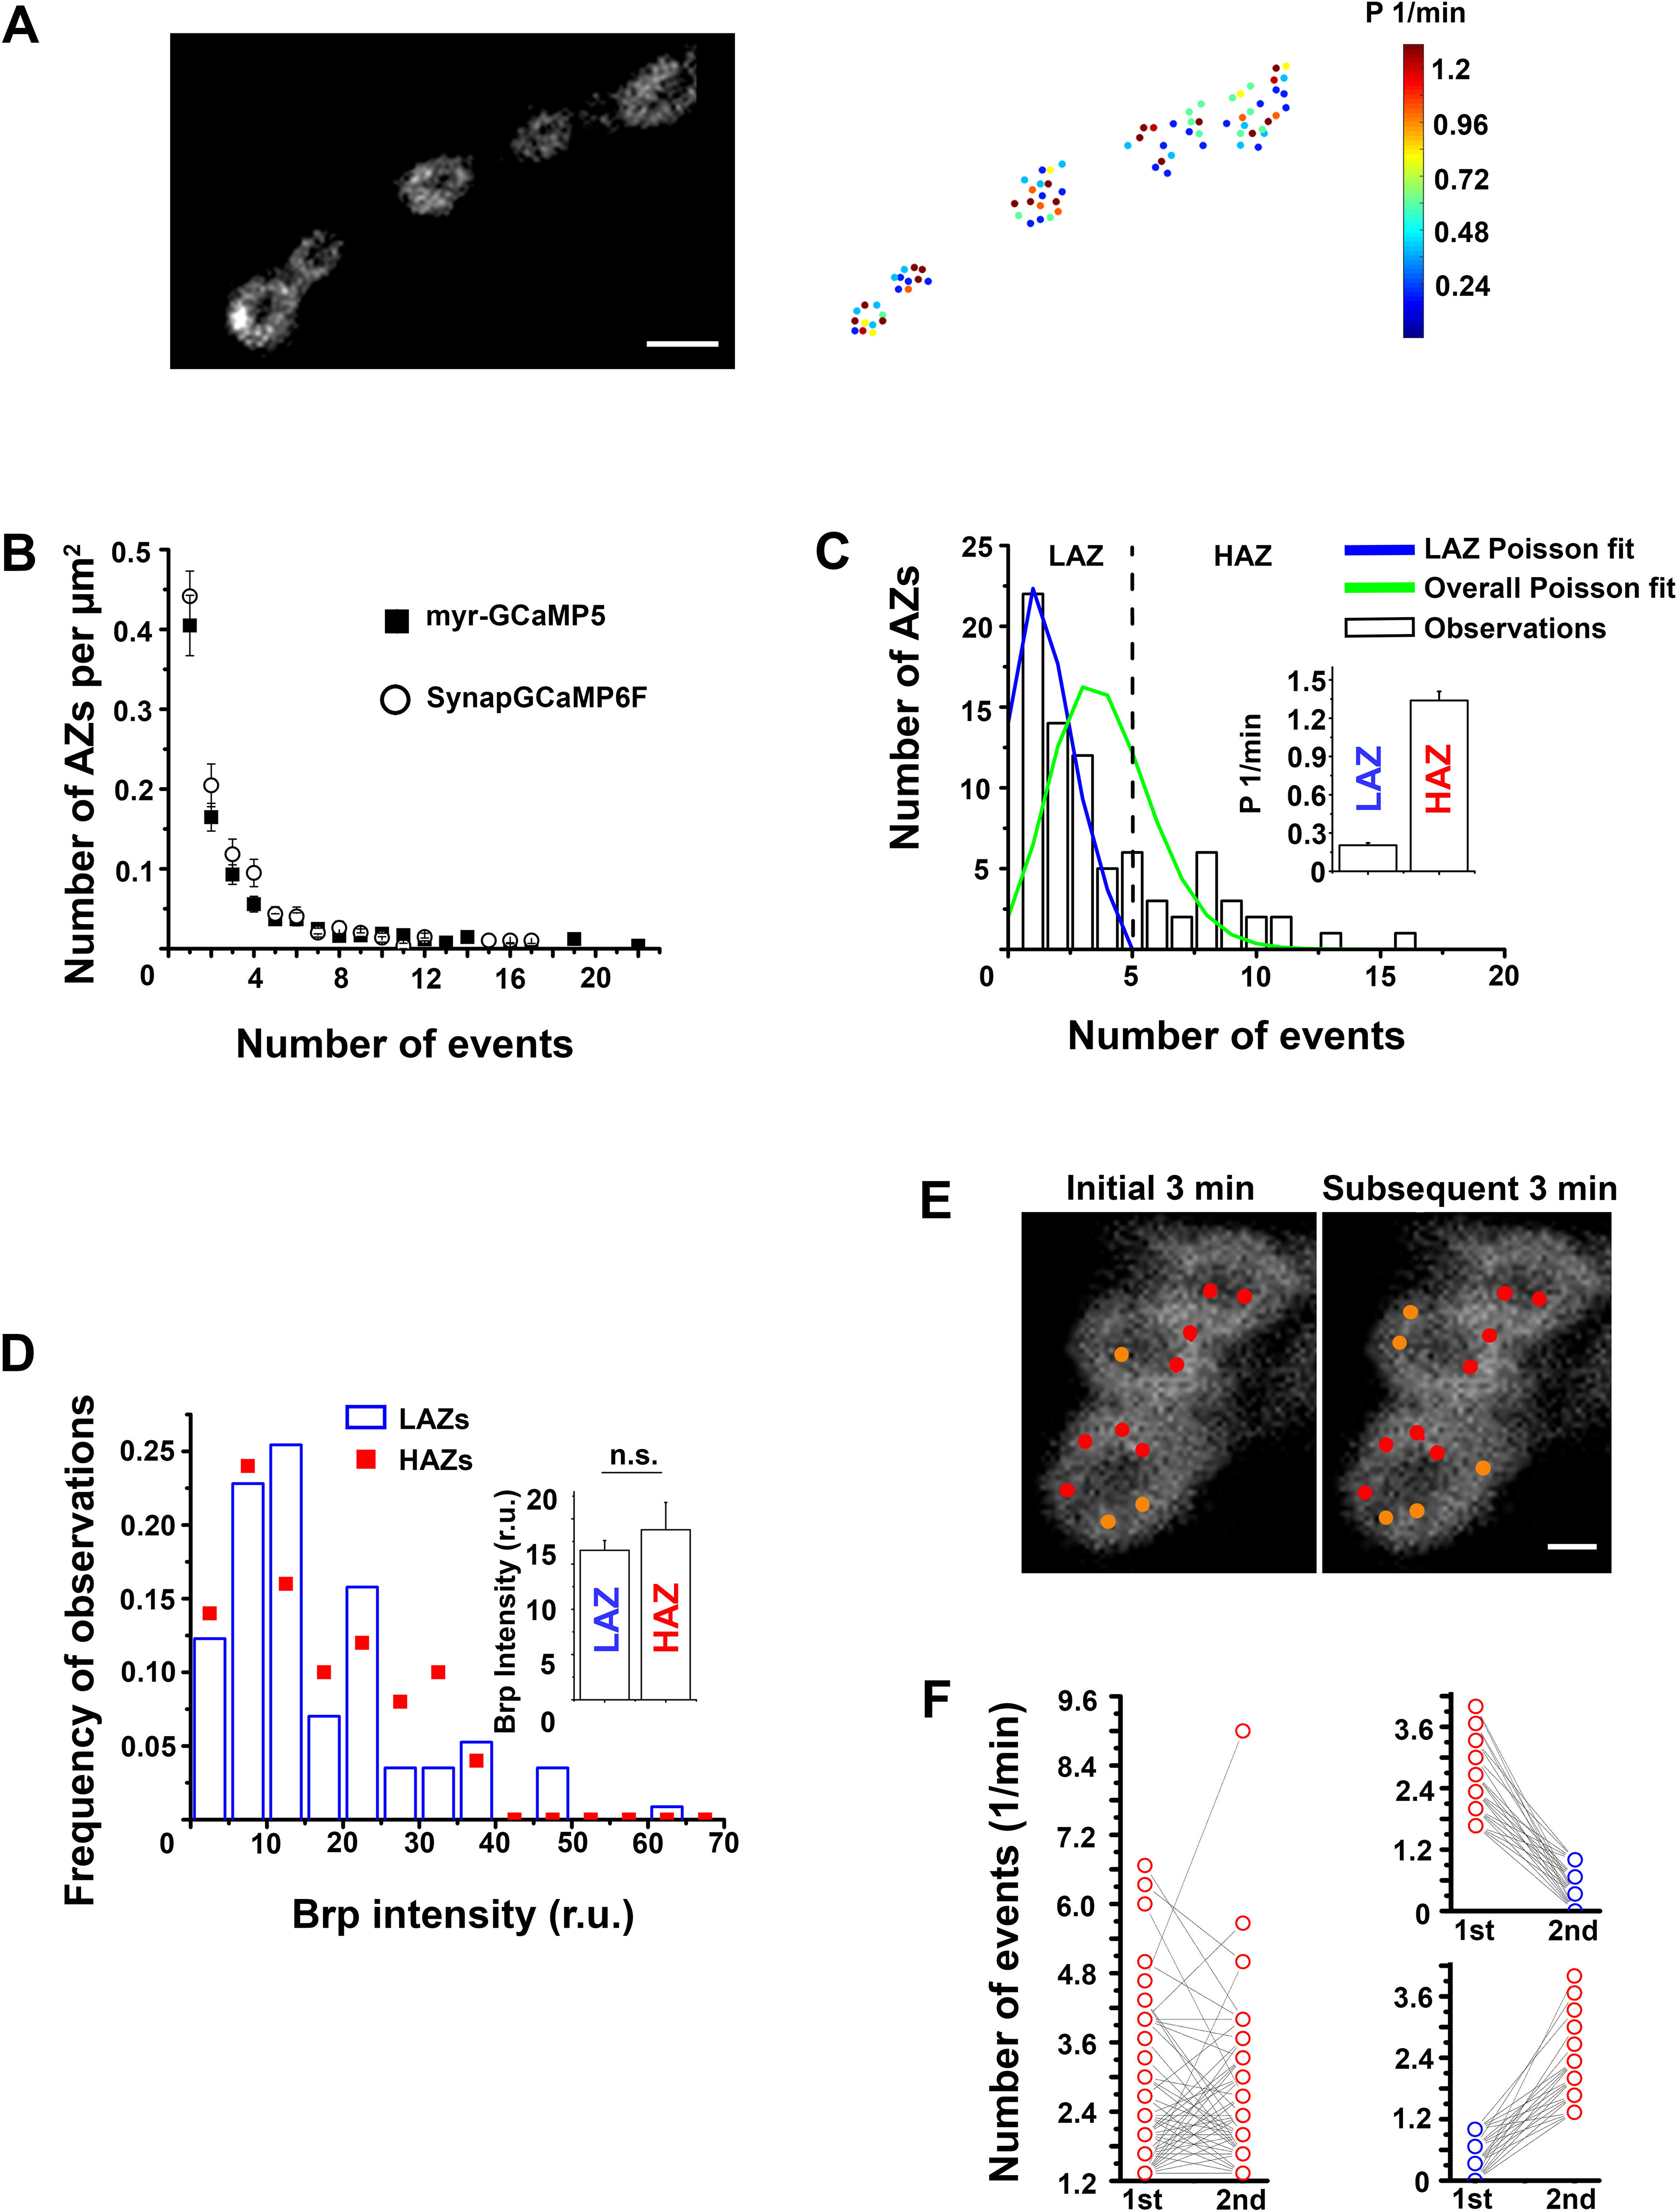
A subpopulation of AZs adopts a state of elevated spontaneous activity. A, The variability in AZ activities: the GCaMP5-expressing NMJ (left) and the heatmap for individual AZs (right). Scale bar, 3 µm. B, The distributions of AZ activities are similar for the two genetic markers, myr-GCaMP5 and SynapGCaMP6F. Data collected from 21 GCaMP5-expressing and 19 GCaMP6-expressing preparations. C, A representative experiment showing that the distribution of AZ activities (bars) does not fit the Poissonian distribution (green). However, a subpopulation of AZs with lower activities can be well fit by the Poissonian law (blue; χ2 = 0.99; p > 0.9). Inset, The average release rates for the two groups of AZs: the LA Poissonian population (LAZ) and the HA population, which does not belong to the Poissonian ensemble (HAZs). Data collected from 21 preparations. D, The Brp intensities for the LAZ and HAZ groups do not differ. Data collected from five preparations. E, A representative example showing HA AZs (red dots) that retained elevated activity during both recordings: the initial 3 min period and the subsequent 3 min period. The remaining AZs (orange dots) possessed HA either during the initial or during the subsequent recording periods, but not both. F, Although the majority of HAZs retained their HA during both recording periods (left), numerous AZs were only active either during the initial or during the subsequent recording period (right). Data collected from nine preparations (134 HA AZs), which showed no rundown over the 6 min recording time.
We next questioned whether the high probability of spontaneous events at selected AZs (Fig. 2A, red and yellow puncta) could be explained by a random variation. If all the AZs are equivalent, the event frequencies should obey the Poisson law because of the large number of AZs (100-200) per recording site and relatively low overall activity (Fig. 2B). However, we found that this was not the case (Fig. 2C, green line vs bars), suggesting that individual AZs are not equivalent. To investigate the extent of the deviation of the observed distribution of activities from a random variation, we used a computational algorithm, which sequentially eliminated high-activity (HA) AZs one by one; and after each elimination, the remaining ensemble was tested for the Poissonian fit. We found that only a small subpopulation of AZs (12.7 ± 2.4%, n = 21 larvae) had to be eliminated from the entire AZ ensemble to produce an excellent Poissonian fit (Fig. 2C, blue line vs bars). Notably, this small subpopulation of HA AZs produced a substantial proportion (∼40%) of all the spontaneous release events. These results suggest that spontaneous activity represents a mixture of two probabilistic processes. One of these processes appears to be purely random and is produced by an ensemble of low-activity (LA) AZs, which are numerous and more or less equivalent. This Poissonian ensemble of AZs generates ∼60% of all the spontaneous activity, whereas the other 40% are generated by AZs which are, on average, 6-7 times more active (Fig. 2C, inset).
We next questioned whether the HA AZs have structural correlates. First, we quantified the Brp fluorescence of the puncta, matching the AZs with high activities versus the LA “Poissonian” AZs. We found that the intensities of Brp fluorescence were similar in the two groups (Fig. 2D), suggesting that the size of AZ does not affect its spontaneous activity. Next, we questioned whether the HA was a permanent AZ feature. To address this question, we performed video recordings of spontaneous activity over 6 min, constructed the distributions of AZ activities for the initial and subsequent 3 min intervals, and compared the ensembles of the AZs obtained from the initial and subsequent recordings. Notably, we found both matches and mismatches between these two AZ populations showing the high activities (Fig. 2E). Although ∼50% of all the AZs retained HA during both recording periods, the remaining AZs showed HA only during one of the periods (Fig. 2F). These results suggest that AZs can adopt HA states, which can last for minutes or possibly longer, but which are not defined by their structural features.
These findings contrast the results obtained for evoked transmission (Akbergenova et al., 2018), which demonstrated that the elevated evoked activity is associated with AZ structural markers, including Brp and VGCC. We tested, therefore, whether the HA AZs detected in our experiments would show any correlation, positive or negative, with sites of elevated evoked transmission. To address this question, we recorded spontaneous and evoked activity from the same site. Spontaneous events were recorded for 4 min, and then the nerve was stimulated electrically at a 3 Hz frequency for 30 s. Following the recordings, preparations were processed for Brp immunostaining. The two recording intervals (4 min for spontaneous activity and 30 s for evoked activity) were analyzed separately, and then the maps of the detected AZs were superimposed with the Brp images and overlayed (Fig. 3A). In agreement with earlier studies (Melom et al., 2013; Peled et al., 2014), some of the AZs showed only evoked transmission (Fig. 3A, right, green), some only showed spontaneous transmission (Fig. 3A, right, magenta), and some produced both components (Fig. 3A, right, cyan). We then compared the probability of evoked release for the three groups of AZs: the Poissonian LA AZs, the HA outliers, and the AZs that remained silent for spontaneous transmission over the recording period (Fig. 3B). No significant difference between these groups was detected, although the evoked activity of the HAZ group was slightly reduced (Fig. 3B, red). We then computed the correlation coefficient for the probability of evoked versus spontaneous release (Fig. 3C) and did not detect any significant correlation (R2 = −0.109), although the data showed a trend for a weak negative correlation, in agreement with Peled et al. (2014).
Figure 3.

The probabilities of spontaneous and evoked transmission do not correlate. A, The maps of AZs that produced spontaneous (left) and evoked (middle) events overlayed with the super-resolution confocal image showing Brp puncta. Right, The overlay of spontaneous and evoked AZs. Magenta represents AZs that generated only spontaneous events; green represents AZs that generated only evoked events; cyan represents AZs that generated both spontaneous and evoked events. Scale bar, 1 µm. B, The probability to generate an evoked event is similar in the three groups of AZs: those showing no spontaneous events over the recording period (white), those falling into the Poissonian ensemble of AZ with low activities in spontaneous transmission (LAZ, blue), and the outliers with high spontaneous activities (HAZ, red). C, The probability of evoked release (per action potential) does not correlate with the frequency of spontaneous events at individual AZs. Each data point represents a single AZ. Data collected from five preparations (152 AZs). Line indicates the linear regression (R2 = 0.0094, b = −1.63 ± 2.20E-5).
Together, our findings suggest that an AZ can adopt a state that is favorable for elevated spontaneous transmission and that this state does not correlate with either AZ structure or its capability for evoked release. We next investigated the time course for the elevated spontaneous activity by constructing the histograms of temporal intervals between subsequent events at individual AZs (Fig. 4A). Strikingly, we found an unexpectedly high proportion of the events that followed each other within 1 s (Fig. 4A, arrow, and inset). In addition, the distribution showed a high population of events following each other within 1 min.
Figure 4.
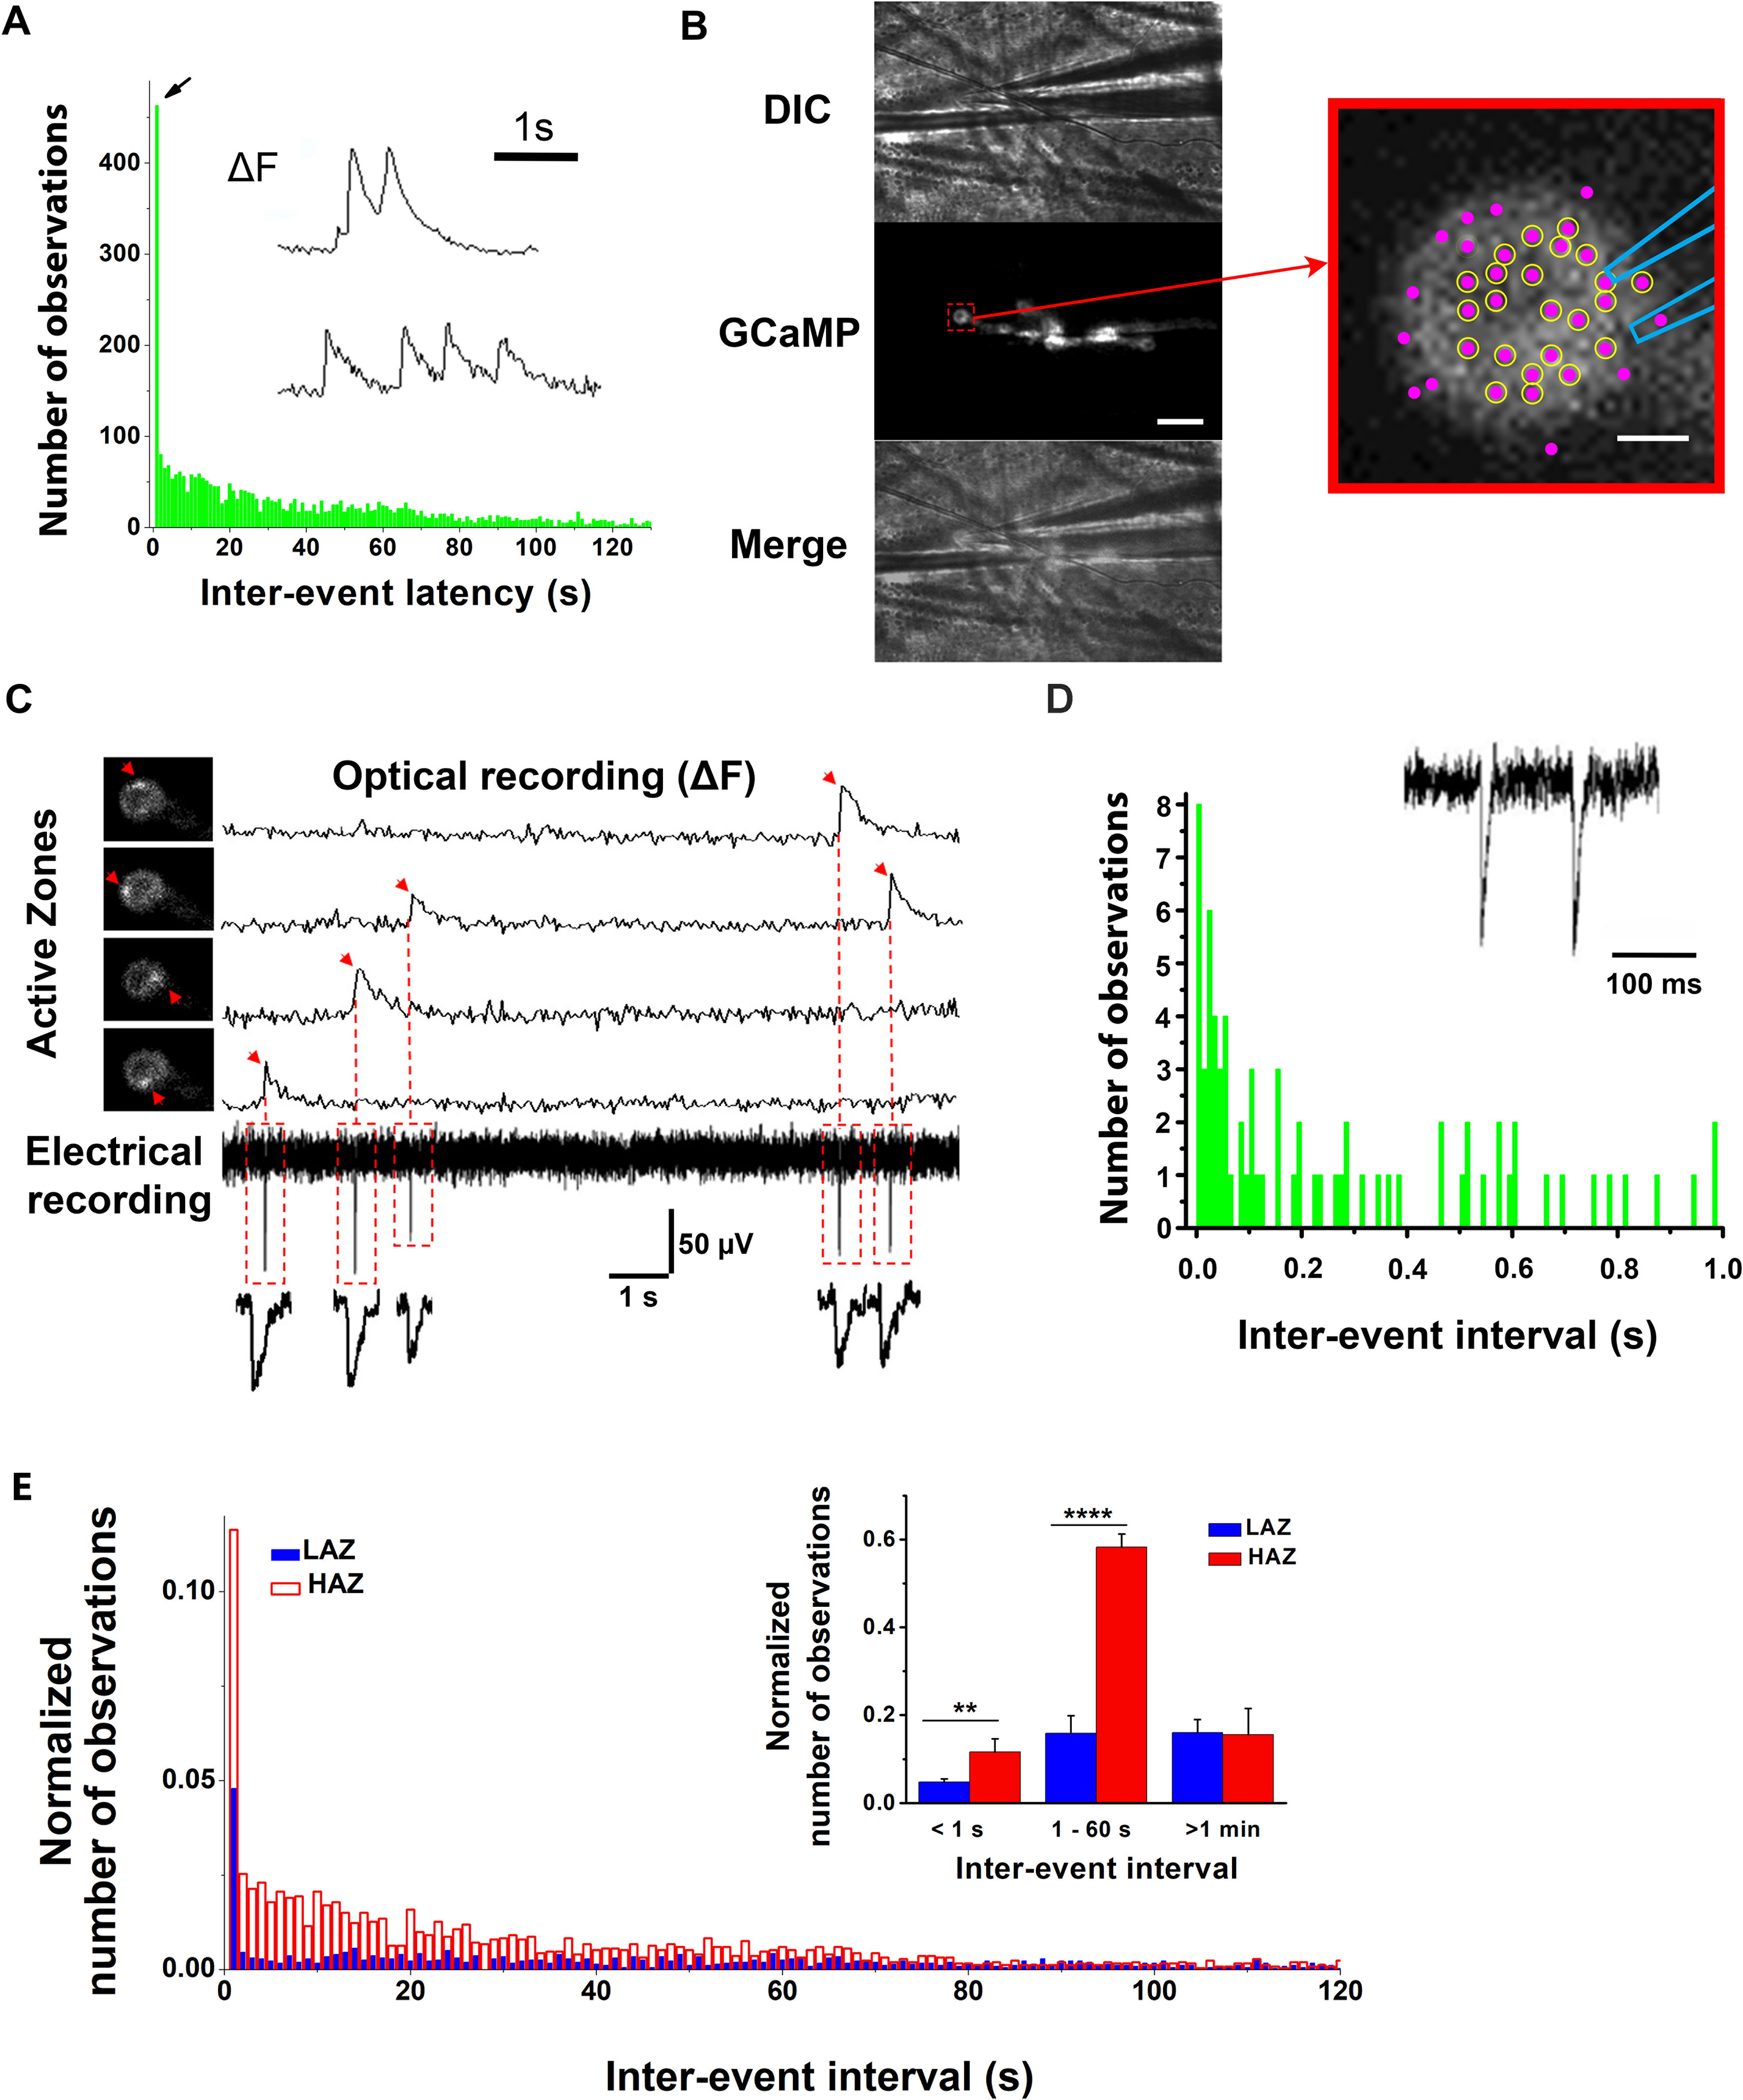
The probability of spontaneous events following each other within subsecond intervals is elevated. A, The latency histogram constructed from the pooled data (21 larvae) shows a large peak (arrow) for the interevent latencies of ≤1 s. Inset, Examples of fluorescent profiles of subsequent optical events at individual AZs. B, The configuration of VER. The 1 µm tip diameter patch electrode is positioned over the top of the bouton. Scale bar, 10 µm. Right, The enlarged bouton shows the electrode position and detected AZs (magenta puncta). Circles represent the AZs in which all the recorded GCaMP events had matching mEPSPs (as shown in C). Scale bar, 1 µm. C, Examples of VER. Four GCaMP events produced by four different AZs (left, arrows). Right, The fluorescent profiles corresponding to each event. Bottom, The continuous recording of electrical activity with the recorded mEPSPs precisely matching the onsets of the recorded GCaMP events. D, Interevent latency histogram constructed from mEPSPs assigned to individual AZs using VER. There is a pronounced peak for the shortest interval (10 ms). Only the AZs with a 100% match between the recorded GCaMP events and mEPSPs were included in the analysis. Data collected from 12 preparations. For clarity, the histogram only shows the latencies of <1 s. Inset, An example of subsequent mEPSPs recorded at a single AZ. E, Interevent latency histogram for the Poissonian LAZ (blue) versus non-Poissonian HAZ (red) subpopulations of AZs normalized by the total number of events in each group. Inset, The pooled data for three interevent intervals: <1 s, between 1 s and 1 min, and >1 min. **p < 0.01. ****p< 0.0001.
To determine how closely the events produced by a single AZ could follow each other, we enhanced the temporal resolution of event detection by combining GCaMP imaging with focal electrical recordings of mEPSPs. We modified the focal macropatch recordings technique (Vasin and Bykhovskaia, 2017) to precisely position the electrode over the selected puncta (Fig. 4B). We then performed simultaneous video and electrical recordings (VERs; Fig. 4C). For the majority of AZs positioned near the recording electrode (Fig. 4B, circled AZs at the enlarged bouton), we observed a 100% match between mEPSPs and optical events (as illustrated in Fig. 4C). Thus, the VER technique (Fig. 4B,C) enabled us to combine the temporal resolution of focal electrical recordings with the spatial resolution of optical detection. We next examined release timings in those AZs where all the optical events had matching mEPSPs (Fig. 4B,C). Notably, we found that the highest proportion of mEPSPs at individual AZs had interevent intervals of tens of milliseconds (Fig. 4D). These findings show that release timings at individual AZs are not random and that the probability of bursts of release events following each other within milliseconds to seconds is elevated.
The three-state model
Together, our results suggest that at least two biophysical mechanisms act at different time scales to elevate spontaneous activity at a subset of AZs: the mechanism acting at a subsecond scale, promoting subsequent events (Fig. 4); and the mechanism acting at a scale of minutes, creating a subpopulation of AZs with elevated activities (Fig. 2). Based on these findings, we sought to develop a biophysical model that would incorporate different states of an AZ and would account quantitatively for the time course of spontaneous transmission. Our data suggest that an AZ can occupy one of the three states: (1) the LA state generating random infrequent Poissonian events; (2) the HA state generating spontaneous events more consistently; and (3) the state enabling subsecond bursts (SB) of events. We next asked how the transitions between these states would occur. Three scenarios are possible: (1) the LA state can transition into either HA or SB state, but transitions between the HA and SB states do not occur; (2) each of the states can transition into a different state; and (3) the LA state can transition into the HA state, which in turn can transition into the SB state. For a preliminary evaluation of these scenarios, we separated the Poissonian LAZs and non-Poissonian HAZs (as illustrated in Fig. 2C) and analyzed the latency histograms for both groups. We found that, although both groups showed the events with subsecond latencies, the proportion of such events was significantly higher within the HAZ population (Fig. 4E). In addition, the HAZ population had a drastically increased proportion of the events that occurred within 1 min from each other (Fig. 4E, inset), while the proportion of the events with latencies of ≥1 min was similar in both groups. These results suggest that the activity of the ensemble of non-Poissonian AZs is governed by both HA and SB states, which rules out the first scenario. However, these results do not allow to unambiguously distinguish between the second and the third scenarios since the sequences of events with subsecond latencies (SB type) were observed predominantly but not exclusively within the non-Poissonian HAZ ensemble.
Therefore, we performed MC simulations of spontaneous transmission based on the three-state model (LA, HA, and SB states, Fig. 5A) using two different scenarios: (1) transitions to the SB state can occur from either LA or HA state (all-transition model, Fig. 5B-E), or (2) transitions to the SB state can only occur from the HA state (succession model, Fig. 5F–I). The simulations relied on the following parameters (Fig. 5): the total number of AZs (NAZ); the conversion rate to the HA state (k+HA) and the rate of the reverse process corresponding to the deconversion (k-HA); the rates of the conversion and deconversion to and from the SB state, k+SB and k-SB, respectively; and the release rates for each of the states: rLA, rHA, and rSB. The MC simulation step was set to 40 ms, matching the imaging frame rate, and the event resolution detection was set to 120 ms (3 time frames). To fit the outputs of MC simulations to the experimental data, we adjusted the parameters while performing χ2 minimization. Pooled data from all the experiments were used for the comparisons with the outputs of MC simulations. Three statistical distributions were constructed to perform the fit: (1) the number of events generated by an AZ; (2) the latency between subsequent events at a single AZ; and (3) the length of a burst of events. A burst was defined as a sequence of events with interevent intervals <1 s. The χ2 minimization procedure was performed in three sets of iterations so that the parameters of the MC simulation were subsequently adjusted to fit each of the distributions.
Figure 5.
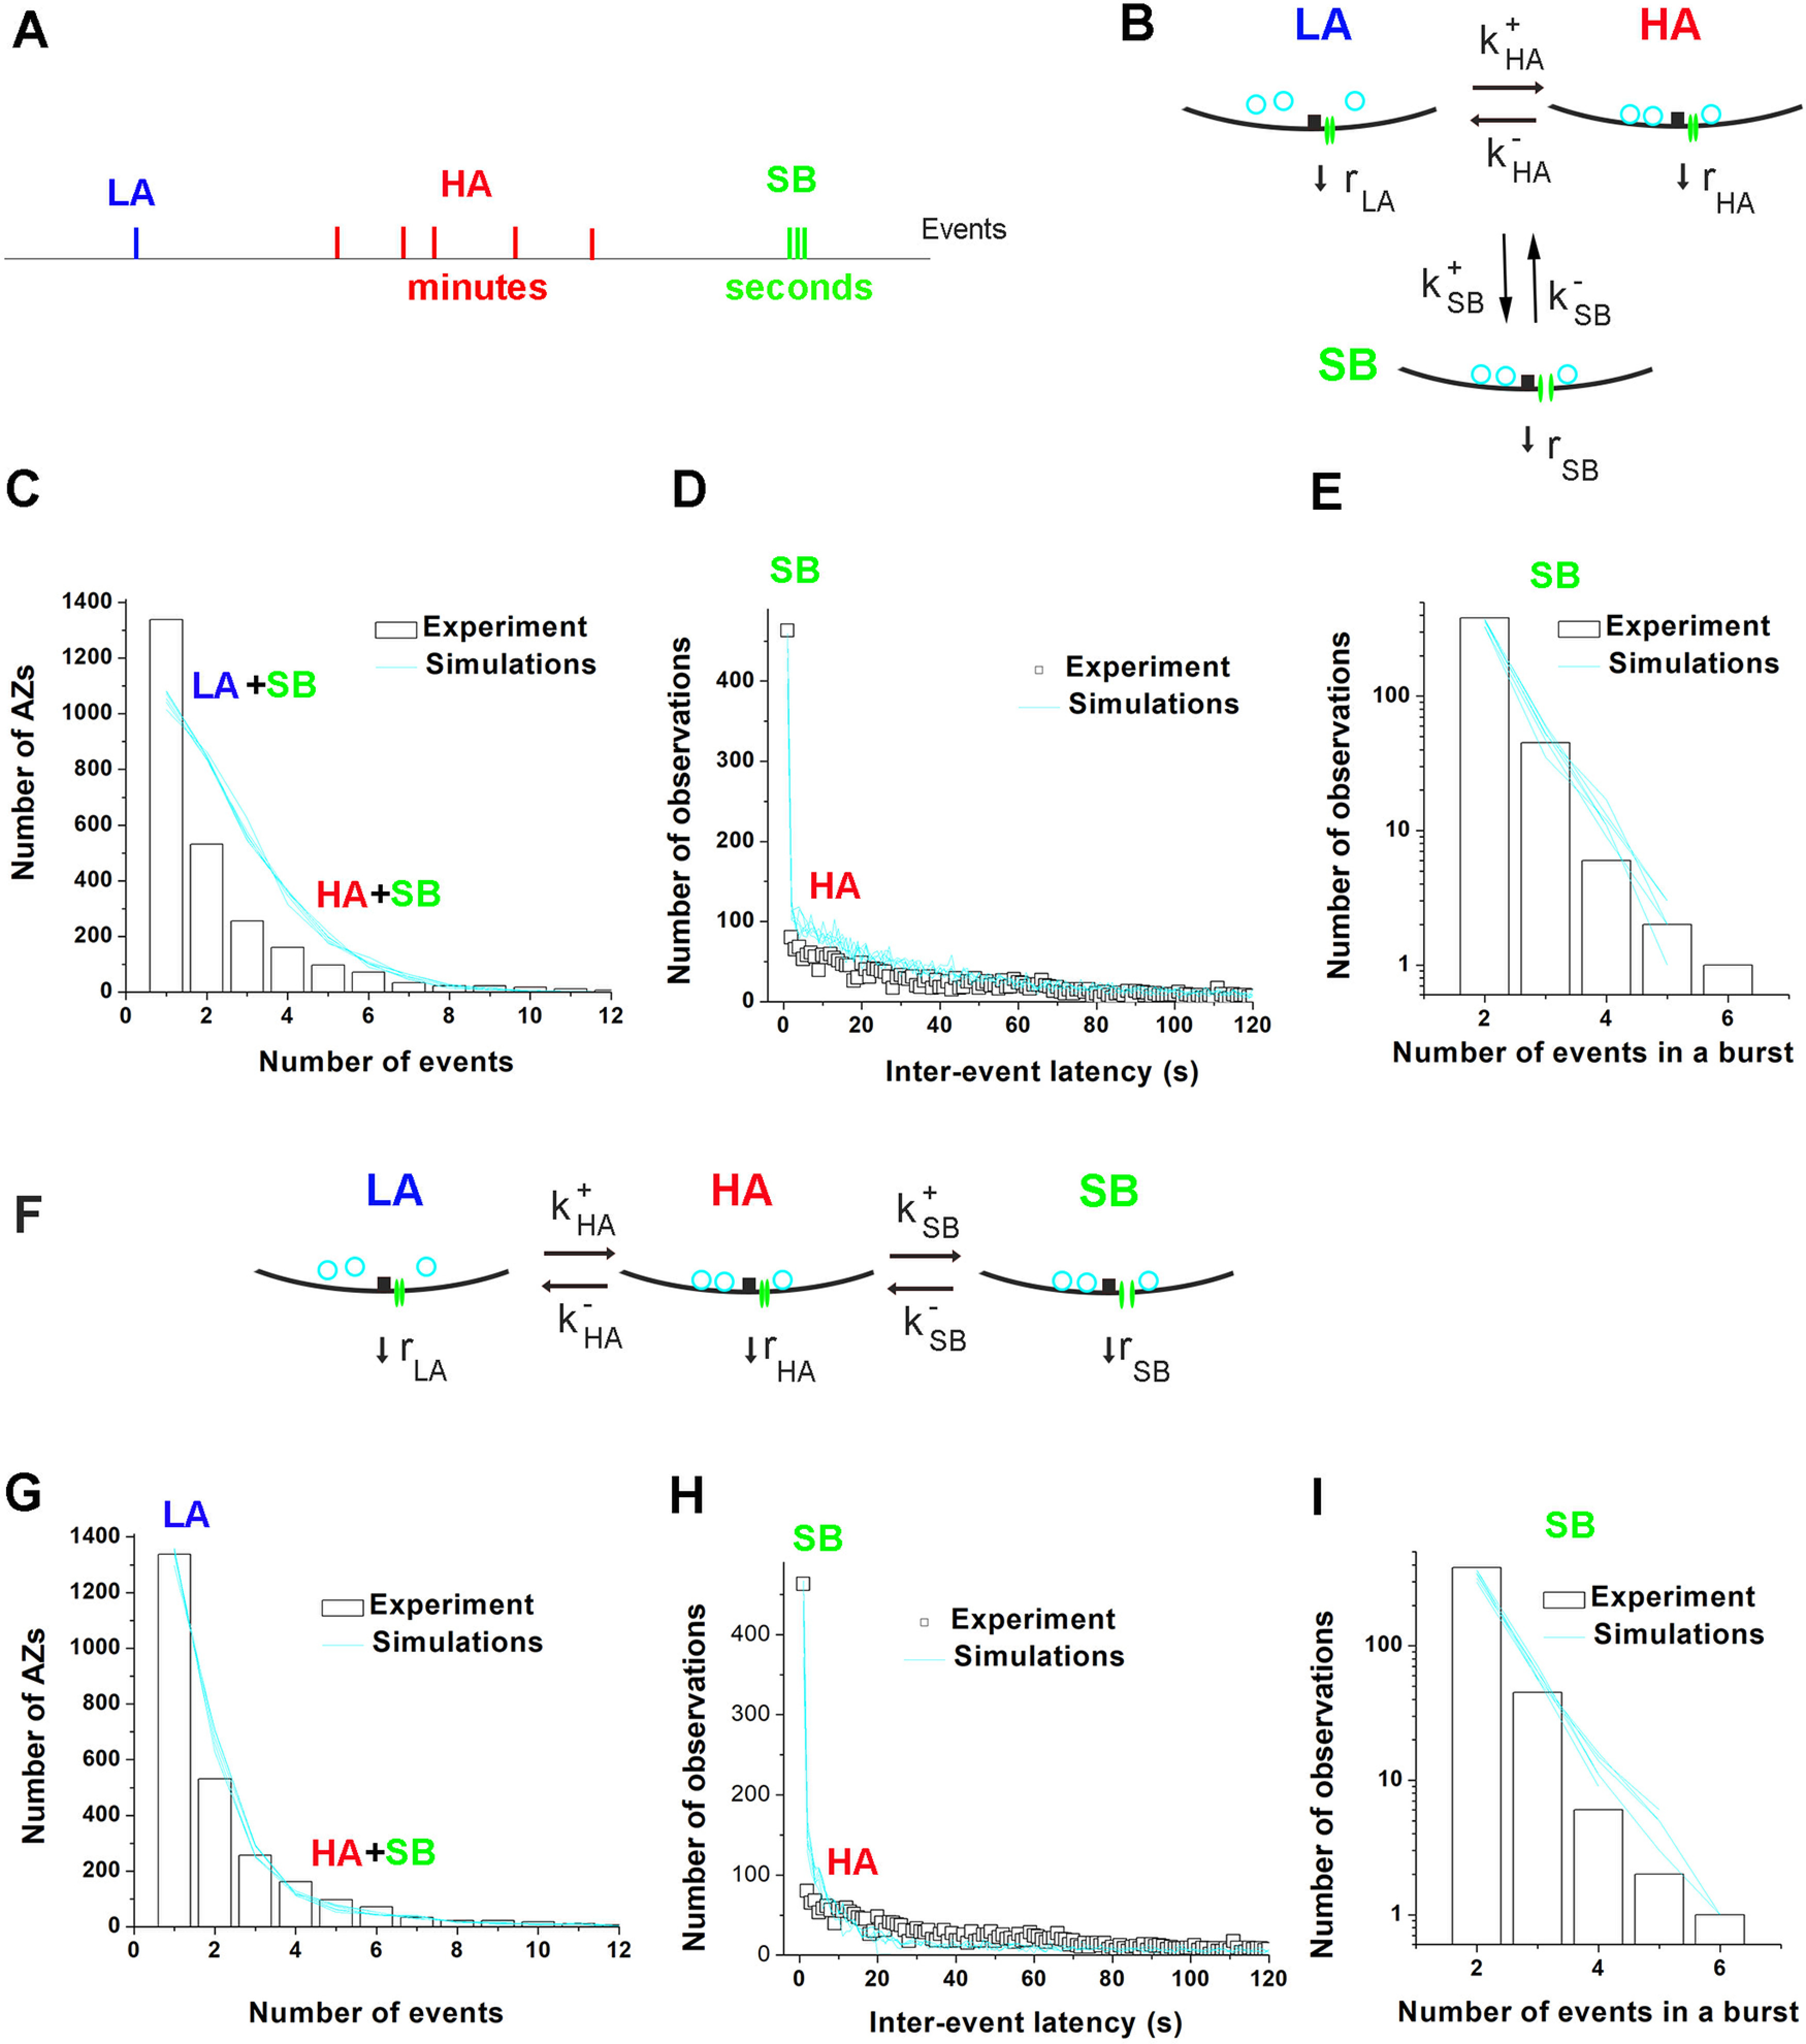
The three-state succession model accounts quantitatively for stochastic properties of spontaneous transmission at individual AZs. A, Three types of spontaneous events produced by the three states of an AZ: LA, infrequent Poissonian events; HA, events produced by the state of HA that lasts for minutes; and SB, bursts of events with subsecond latencies produced by a short-lived state. B, The three-state model of an AZ, which allows transitions between all the three states (all-transition model). Each of the states produces events with a different rate: rLA, rHA, and rSB. C-E, MC simulations (cyan lines) based on the all-transitions model (A) are unable to account quantitatively for the experimentally observed distributions of AZ activities (C, bars), interevent latencies (D, open squares), and the lengths of bursts of SB type events (C, bars). Each line indicates a separate MC run. When the parameters are adjusted to reproduce the shape of the latency distribution (B) and the number of SB events (C), the overall activity distribution of activities (A) produced by MC simulations has the number of LA events (singles) significantly below the experimental observations (χ2/df) = 82.2. F, The three-state model of an AZ, which only allows successive transitions from the LA to the HA and to the SB state (succession model). G-I, The experimentally observed distribution of the overall activity (G) is well fit by MC simulations (χ2/df = 2.16) based on the succession model (F). The shape of the latency distribution (H) is also reproduced by MC simulations, as well as the distribution of the lengths of the SBs of events (I). The histograms are constructed from the pooled data collected from 21 NMJs for 5 min. Six MC runs were performed for each set of parameters. The latencies of ≤1 s are largely produced by AZs in their SB state, while the latencies of ≤1 min are largely produced by AZs in their HA state.
Notably, the all-transition model (Fig. 5A) did not allow to fit the distributions of activities and latencies using the same set of parameters (Fig. 5B–D). Adjusting k+SB, k-SB, and rSB to fit the number of SB events (Fig. 5C,D) produced the distribution of activities with too few single events and too many doubles and triples (Fig. 5B), since the SB type events were often generated by the AZs, which resided in their LA states. No further parameter adjustments could correct the simulated AZ ensemble without drastically reducing the sequences of the SB events.
In contrast, the succession model (Fig. 5F) produced an excellent fit for the distribution of AZ activities (Fig. 5G) and also reproduced the overall shape of the latency distribution (Fig. 5H), with the high proportion of SB type events matching the experimental data (Fig. 5H,I). Since the model only used eight parameters (Table 1), the observed fit for the three distributions (Fig. 5G–I) is highly parsimonious and informative.
We next questioned what molecular mechanisms would correspond to the biophysical processes described by the model (Fig. 5F) and how the manipulations with the release machinery could affect the parameters of the model. First, we explored computationally how the parameters of the model affect the shapes of the distributions of activities and latencies. Notably, altering different parameters shaped the distributions in qualitatively different ways (Fig. 6A–F). For example, the number of AZs, NAZ, broadly affects both distributions (Fig. 6A,B). In contrast, rLA alters the shape of the activity distribution (Fig. 6C) but has little effect on interevent latencies (Fig. 6D) since the latter is predominantly produced by multiple release events from the HA and SB states. The rate of the conversion to the HA state, k+HA, shapes the distribution of activities by balancing LA and HA events (Fig. 6E) and also has a very pronounced effect on the latency distribution (Fig. 6F). The parameters of the model (Fig. 5F) listed in Table 1 produced the best fit for the data (Fig. 5G–I). These results guided us in establishing the links between the components of the release machinery and the transitions between the AZ states.
Figure 6.

The alteration of different parameters of the model differentially affects the shapes of the activity and latency distributions across AZs. A, B, An increase in the number of AZs, NAZ uniformly shifts the distribution of AZ activities (B) and latencies toward higher values. C, D, The release rate from the LA state, rLA, predominantly affects AZs with low activities, thus altering the shape of the activity distribution (A) but having very little effect on interevent latencies (B), which largely depend on multiple events produced by HA AZs. E, F, The rate of conversion to the HA state strongly affects the HA AZs (A) as well as the overall distribution of interevent latencies (B).
SNARE-Cpx complex controls the HA states of AZs
We next investigated the role of Cpx, which is thought to clamp spontaneous fusion by preventing full SNARE assembly (Giraudo et al., 2009; Kummel et al., 2011; Zdanowicz et al., 2017; Brady et al., 2021) (Fig. 7A). First, we monitored spontaneous activity at individual AZs of Cpx OE preparations (Fig. 7B1), which have significantly reduced spontaneous transmission compared with WT controls (Jorquera et al., 2012). Notably, we found that the distribution of activities at individual AZs of Cpx OE preparations is well fit by the Poissonian law (Fig. 7B2). We next tested whether Cpx-deficient lines would have the non-Poissonian ensemble of events increased. We performed optical event detection of spontaneous activity at cpx+/− and cpx−/− lines, both of which have significantly increased spontaneous transmission (Jorquera et al., 2012). The cpx+/− NMJs had multiple AZs producing four events per minute or even more (Fig. 7C), which rarely occurred at WT preparations. At the same time, the number of AZs producing a single event over the recording time (0.2 min−1) at cpx+/− preparations did not differ from controls (0.41 ± 0.017 µm−2 at cpx+/− larvae vs 0.40 ± 0.038 in controls). We next examined the cpx−/− line, which has a drastically increased mEPSP frequency (>100-fold compared with WT controls) (Vasin et al., 2016). Optical recordings showed almost continuous activity at synaptic boutons of cpx−/− preparations (Movie 2). The statistical analysis demonstrated that multiple AZs generated >10 events per minute (Fig. 7D), which never occurred at WT preparations. The activities of such AZs at cpx−/− NMJs were likely underestimated because of the limited resolution of optical detection. Interestingly, the activity distribution at the cpx−/− line remained skewed (Fig. 7D2), with the distribution mode remaining at a single event per an AZ over the observation period. This result suggests that the LA states are still present and abundant within the AZ ensemble of cpx−/− NMJs, although the overall spontaneous activity at this line is drastically enhanced.
Figure 7.
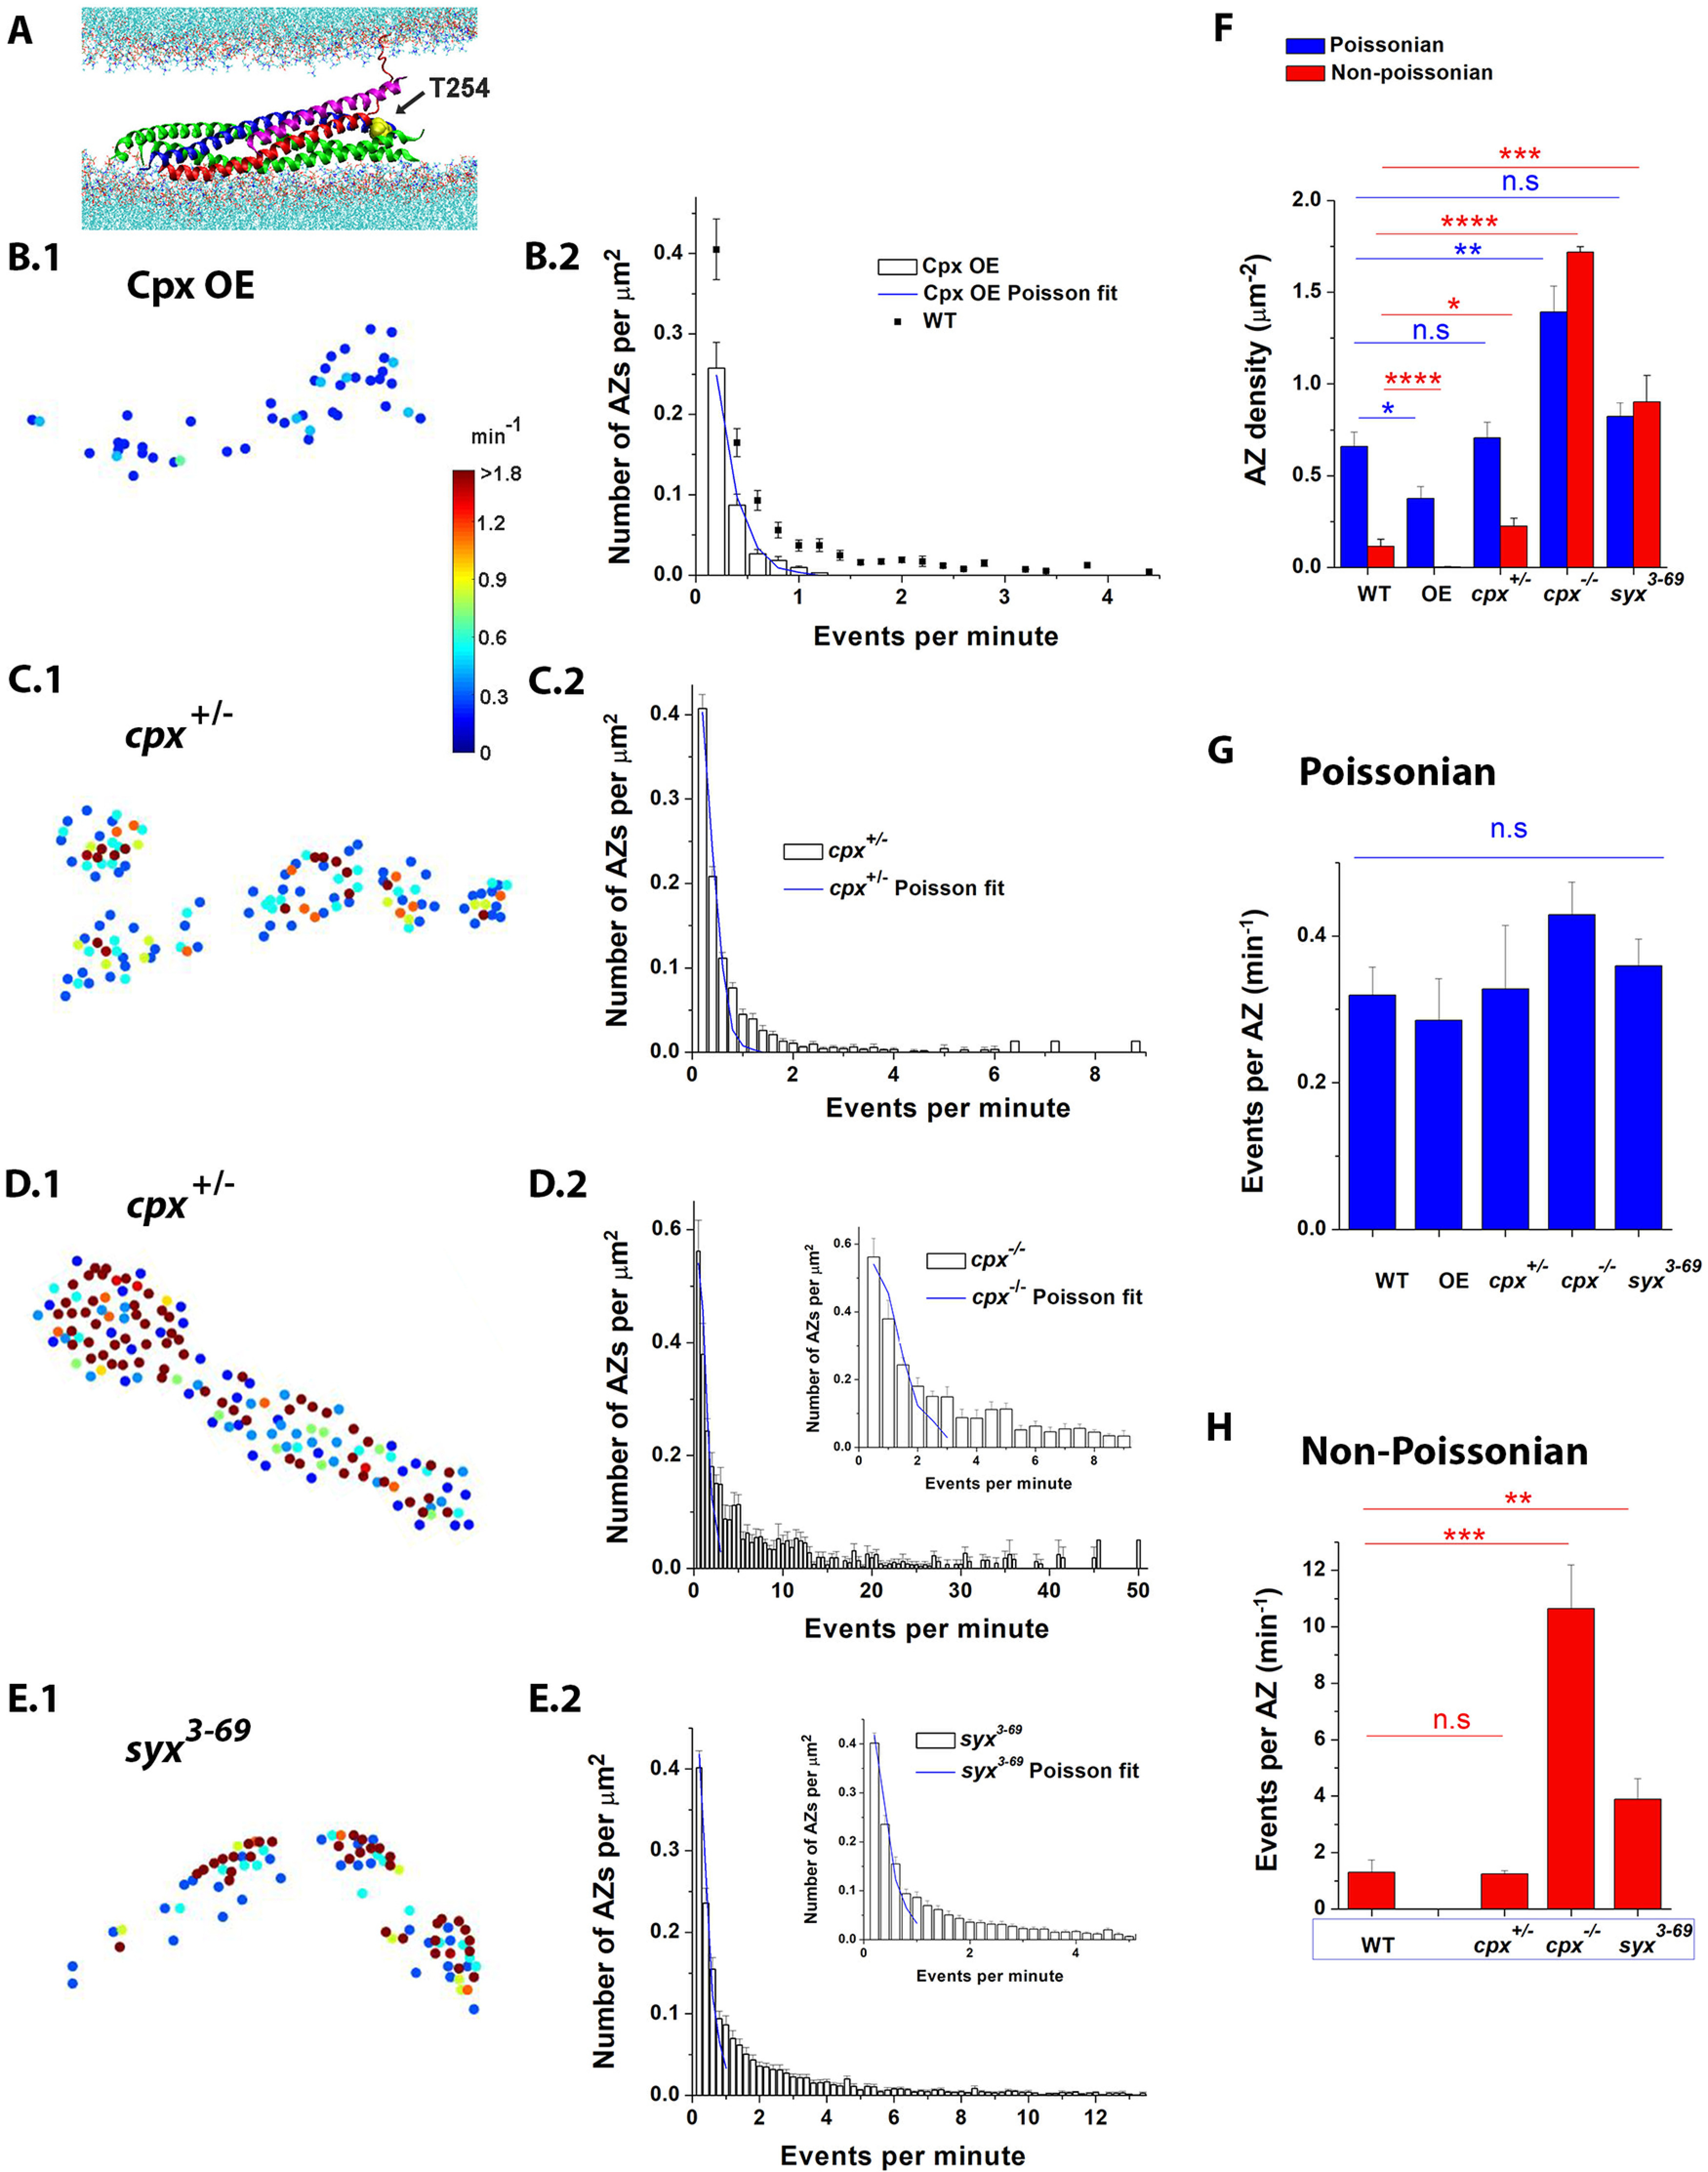
The non-Poissonian ensemble of events depends on Cpx and Sx1A. A, Diagram represents Cpx (magenta) attached to the SNARE bundle positioned between the lipid bilayers representing the presynaptic membrane (bottom) and SV (top). Blue represents Sx1A; red represents synaptobrevin; green represents SNAP25. The mutated Sx1A residue Thr 254 (yellow, VdW representation, mutated by Ile in the syx3-69 line) is positioned at the site critical for full SNARE zippering. B, Cpx OE eliminates the non-Poissonian events. Cpx NMJs lack HA AZs (B1), and the activity distribution at Cpx OE NMJs obeys the Poissonian law (B2). Data collected from 17 Cpx OE larvae. The WT data are replotted from Figure 2 for comparison. C, The cpx+/− NMJs show numerous non-Poissonian events. The NMJs have HA AZs (C1), and the activity distribution at cpx+/− NMJs noticeably deviates from the Poissonian law (C2). Data collected from 19 cpx+/− larvae. D, The cpx−/− NMJs predominantly show non-Poissonian events. The majority of AZs at cpx−/− NMJs show HA (D1) and do not fit the Poissonian distribution (D2; inset shows the expanded distribution for <10 events). Data collected from 9 cpx−/− larvae. E, Non-Poissonian events are very prominent at the syx3-69 NMJs. Numerous HA AZs are present (E1), and most of the events do not fall into the Poissonian ensemble (E2). Data collected from 17 syx3-69 larvae. F, The AZ density is significantly affected by either Cpx levels or by the Sx1A mutation, and this effect is more prominent for non-Poissonian AZs. The non-Poissonian AZs are largely eliminated in the Cpx OE line and increased ∼15-fold in the cpx−/− line compared with WT. G, The activity of Poissonian AZs was not significantly affected by either Cpx levels or the Sx1A mutation. H, The activity of non-Poissonian AZs was significantly increased in the cpx−/− and syx3-69 lines. *p<0.05; **p<0.01; ***p<0.001; ****p<0.0001.
Continuous spontaneous activity at cpx–/– GCaMP5-expressing preparations.
Since Cpx is the SNARE-binding protein, we next investigated whether mutating a SNARE protein would affect the HA state. We took advantage of the syx3-69 mutant (Littleton et al., 1998), which has a single point mutation (T254I) in the t-SNARE protein Syntaxin-1A (Sx1A; Fig. 7A). The spontaneous activity at syx3-69 NMJs is significantly elevated (Lagow et al., 2007; Vasin et al., 2016), possibly because of SNARE zippering being promoted by the mutation (Bykhovskaia et al., 2013; Vasin et al., 2016). Optical analysis of release events at syx3-69 NMJs (Fig. 7E) revealed a phenotype qualitatively similar to Cpx deficiency, with the LA Poissonian AZ ensemble being present but the non-Poissonian ensemble being markedly activated.
The overall analysis of the activity of the Poissonian versus non-Poissonian AZs (Fig. 7F–H) revealed that the non-Poissonian ensemble was drastically affected by either Cpx levels or the syx3-69 mutation, while the Poissonian ensemble was affected to a lesser extent. In particular, the non-Poissonian AZs were largely absent in Cpx OE NMJs (a single AZ of 162 deviated from the Poissonian distribution), while they represented the majority of all the AZs in cpx−/− preparations (Fig. 7F). Notably, the Poissonian ensemble constituted a large proportion of AZs in all the lines. The increased activity in cpx−/− preparations was associated with a significant increase in the overall AZ density, and this increase was especially prominent for non-Poissonian AZs (Fig. 7F, blue vs red). The activities of individual Poissonian AZs were not significantly altered in either of the lines (Fig. 7G), while the activities of individual non-Poissonian AZs were significantly enhanced at cpx−/− and syx3-69 lines (Fig. 7H).
We next examined the latency histograms and evaluated the bursts of events with subsecond latencies, the SB type. The SB peak at the latency histograms corresponding to <1 s interval was prominent for each of the lines (Fig. 8A). We derived the number of SB events by extrapolating the latency histograms (red lines) to the 1 s bin and subtracting the extrapolated values from the actual observations at 1 s bars (Fig. 8A, green portions of the 1 s bars).
Figure 8.

The SB pool of events does not show a selective dependence on Cpx or Sx1A. A, The SB pool of events (green) is present in the lines with altered Cpx levels or the Sx1A mutation. The latency histograms are constructed from the same datasets as in Figure 7. Red lines indicate the extrapolated histograms with the 1 s bar being excluded. B, The overall numbers of the SB events are increased in the lines with HA (cpx+/−, cpx−/−, and syx3-69) and decreased in the line with LA (Cpx OE), ranging within 100-fold (note the logarithmic scale). C, The number of SB events normalized by the total number of successive pairs of events. The normalized SB events are increased at the Cpx OE line compared with the control (*p < 0.05). No significant alterations in the normalized SB events were detected for the cpx+/−, cpx−/−, and Cpx OE lines. Inset, The ratio between the SB events and the number of the detected non-Poissonian events, which was unaltered for the cpx+/−, cpx−/−, and syx3-69 lines. D, The distributions of burst lengths are similar for all the lines, although the absolute event numbers range broadly. The rates of the decay are not significantly different per ANCOVA.
We found that, although the overall number of SB events was correlated with the overall activity, being increased in the Cpx-deficient lines and the syx3-69 line (Fig. 8B), this was not the case for the normalized SB events (Fig. 8C). Indeed, the proportion of the SB latencies (of all the interevent intervals) was the highest for the Cpx OE line, and it significantly exceeded the fraction of the SB intervals observed at control. We also found that the normalized SB events remained unchanged for the Cpx-deficient lines and the syx3-69 line compared with WT controls (Fig. 8C). We next quantified the fraction of the SB events within the non-Poissonian ensemble and found that it also remained unchanged for the cpx+/−, cpx−/−, and the syx3-69 line (Fig. 8C, inset), with the SB events comprising ∼10%-15% of all the non-Poissonian events.
To further investigate the SB state, we quantified the sequences or bursts of SB events. Each line showed an exponential decay for the dependence of the number of observations on the burst length (Fig. 8D; note the logarithmic scale for the number of observations), and the rate of the decay was similar for all the lines. These results indicate that the Cpx deficiency and the state of the SNARE complex do not promote the SB state.
Overall, the most parsimonious interpretation for the results of our statistical analysis is that the rates of the transition from the LA state to the HA state (Fig. 5F) and the activity of the HA state depend on the SNARE-Cpx complex, while the transitions from the HA state to the SB state are controlled by other mechanisms. To test this quantitatively, we performed MC simulations of the spontaneous activity based on the three-state succession model (Fig. 5F). We asked whether the activity and latency distributions in the lines with altered Cpx levels or with the Sx1A mutation can be fit by adjusting the parameters associated with the HA state. To evaluate how meaningful is the adjustment of each parameter, we used the bootstrap method. A parameter was altered systematically, 10 MC runs were performed for each parameter value, and the goodness of fit was computed for each run (Fig. 9A). The MC simulations demonstrated that the activity and latency distributions at Cpx OE preparations (Fig. 9B) could be fit by decreasing k+HA and rHA, and increasing k-HA (Table 1), so that conversions to the HA state become less frequent and less prolonged, and the release rate from the HA state is reduced. Consistently, the activity and latency distributions at the cpx+/−, cpx−/−, and syx3-69 lines (Fig. 9B) were well fit by the MC simulations with the adjusted parameters controlling the HA state: k+HA increased, k-HA decreased, and rAH increased (Table 1). Together, the MC simulations showed that a good fit for the distributions of the overall activity and latency at the preparations with altered Cpx levels or the Sx1A mutation could be produced by selectively adjusting the parameters controlling the HA state (k+HA, k-HA, and rHA; Fig. 9C,D; Table 1), without any alterations in the parameters controlling the LA or SB states.
Figure 9.
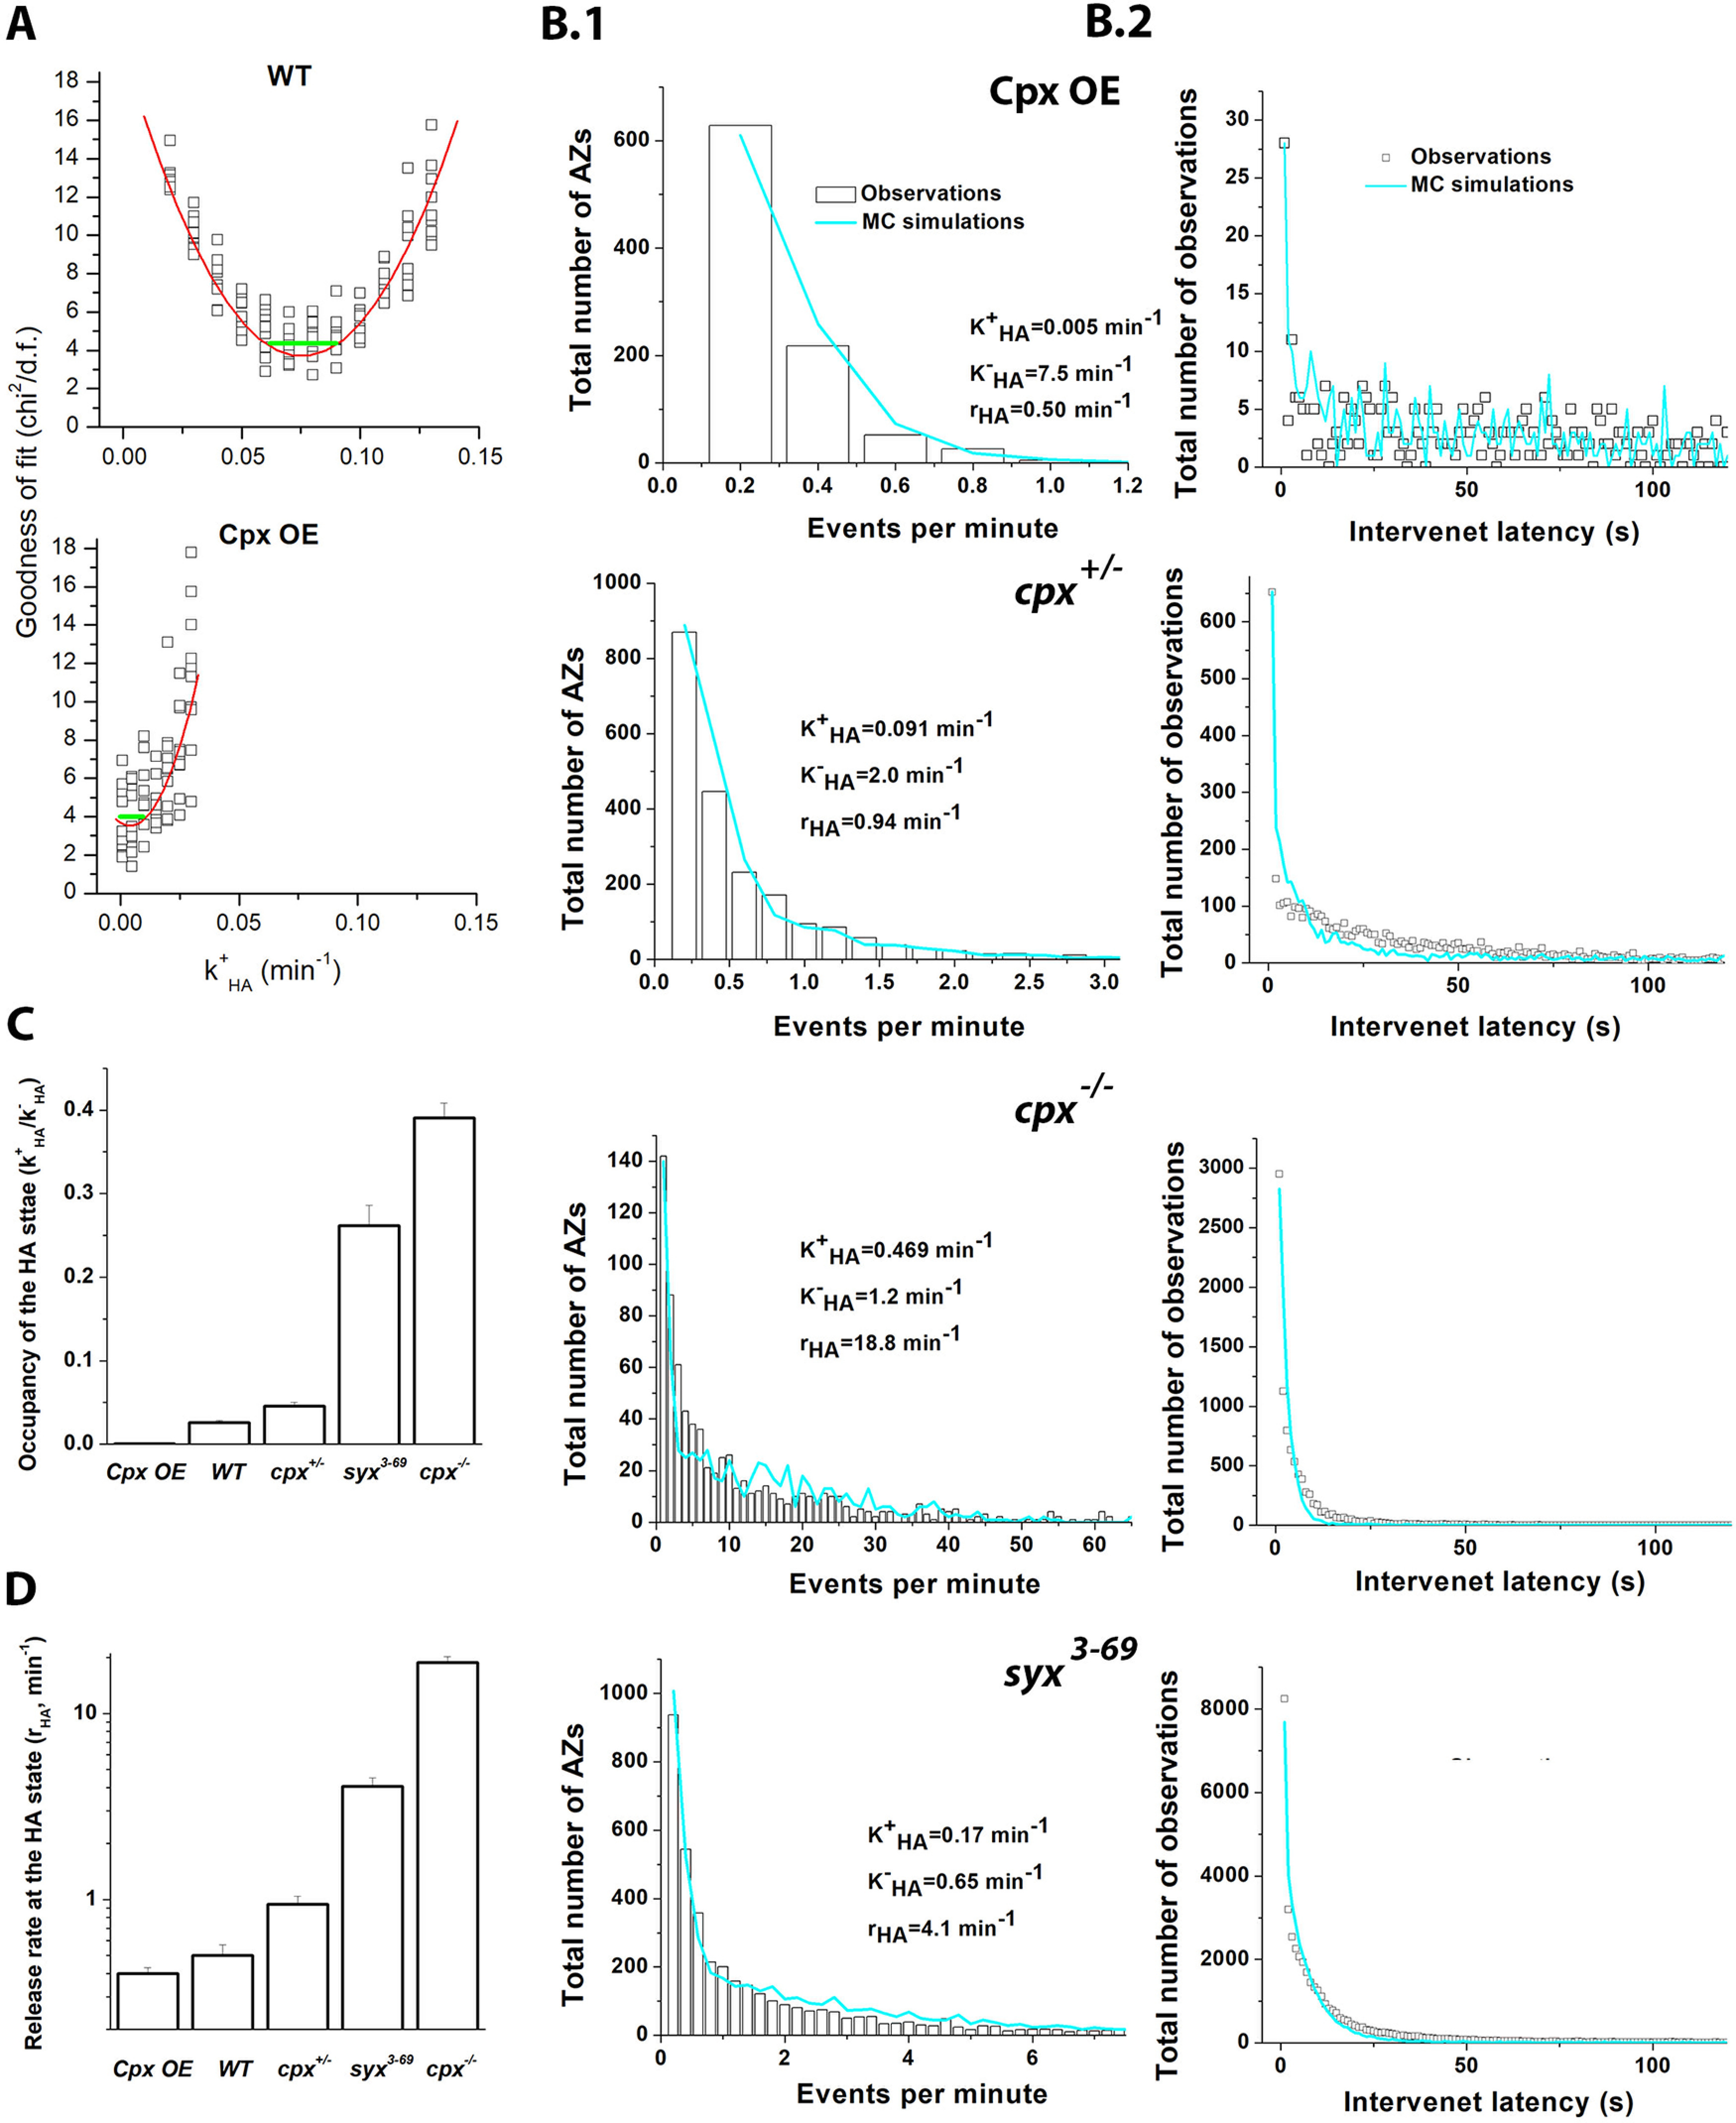
MC simulations based on the three-state succession model suggest that Cpx and Sx1A selectively control the HA state of AZs. A, Adjusting the parameters of the model based on the goodness of fit. Graphs represent the adjustment of the parameter k+HA for the WT (top) and Cpx OE (bottom) datasets. Ten MC runs were performed for a range of the parameter value, and the goodness of fit (χ2/df) was computed (squares). The goodness-of-fit curve was interpolated by the second-order polynomial (red line, ax2 + bx + c), and the likely range of the parameter (Freedman, 2009) (green line) was computed as the width of the parabola (. B, The outputs of MC simulations with the adjusted parameters controlling the HA state fit the activity (B1) and latency (B2) distributions for Cpx OE, cpx+/−, cpx−/−, and syx3-69 preparations. C, D, Cpx levels, as well as the Sx1A mutation, alter the parameters of the model controlling the HA state, including the HA state occupancy (k+HA/k-HA) (C) and the release rate at the HA state (rHA) (D).
Interestingly, our simulations also showed that the number of AZs, NAZ, normalized by the area of the recording site, depended on Cpx and negatively correlated with the Cpx levels (Table 1). This result agrees with the developmental changes in AZ density observed at Cpx-deficient larvae (Cho et al., 2015). Together, our results suggest that the SNARE-Cpx complex selectively controls the HA state, including its occupancy and efficacy, producing the hot spots of activity which may promote synaptic growth.
Ca2+ transients can activate individual AZs or AZ clusters for the high-probability spontaneous release
Notably, the SNARE-Cpx manipulations did not alter any parameters associated with the SB state (Fig. 5F), which enables bursts of events at a subsecond scale. Therefore, we hypothesized that the SB state might depend on Ca2+ transients. We tested then how spontaneous openings of VGCC would affect the release properties at individual AZs. Two treatments were used: promoting Ca2+ influx with GV-58, the agonist of the presynaptic P/Q type VGCC (Tarr et al., 2013b), and or blocking Ca2+ influx with Cd2+.
GV-58 treatment (20 µm) produced 77% increase in the mEPSP frequency (from 0.81 ± 0.16 to 1.43 ± 0.22 Hz), while Cd2+ applications (300 μm CdCl2) produced a 73% reduction in spontaneous transmission (mEPSP frequency of 0.26 ± 0.06 Hz at Cd2+-treated preparations) and a complete blockade of the evoked transmission. The optical analysis demonstrated a broad increase in activities over the entire ensemble of AZs at GV-58-treated preparations (Fig. 10A, orange). At Cd2+-treated preparations, the activities within the AZ ensemble were also affected broadly over the entire distribution, showing an overall reduction (Fig. 10A, ochre). Notably, the Poissonian population of events was not eliminated in the Cd2+-treated preparations (Fig. 10B,C). This finding contrasts the results obtained for Cpx OE preparations, which had a similar overall activity (0.109 ± 0.016 min−1µm−2 events at Cpx OE NMJs vs 0.092 ± 0.015 min−1µm−2 at Cd2+-treated NMJs) and the Poissonian release process (Fig. 7B,F,H). Overall, the Cd2+ and GV-58 treatments produced proportional alterations in the numbers of the detected Poissonian (Fig. 10B, blue) and non-Poissonian (Fig. 10B, red) AZs, and the overall activities of non-Poissonian AZs were not significantly altered by the treatment (Fig. 10C). These results indicate a general dependence of the overall number of AZs producing spontaneous events on Ca2+ levels, without a preferential effect of Ca2+ on the HA state.
Figure 10.
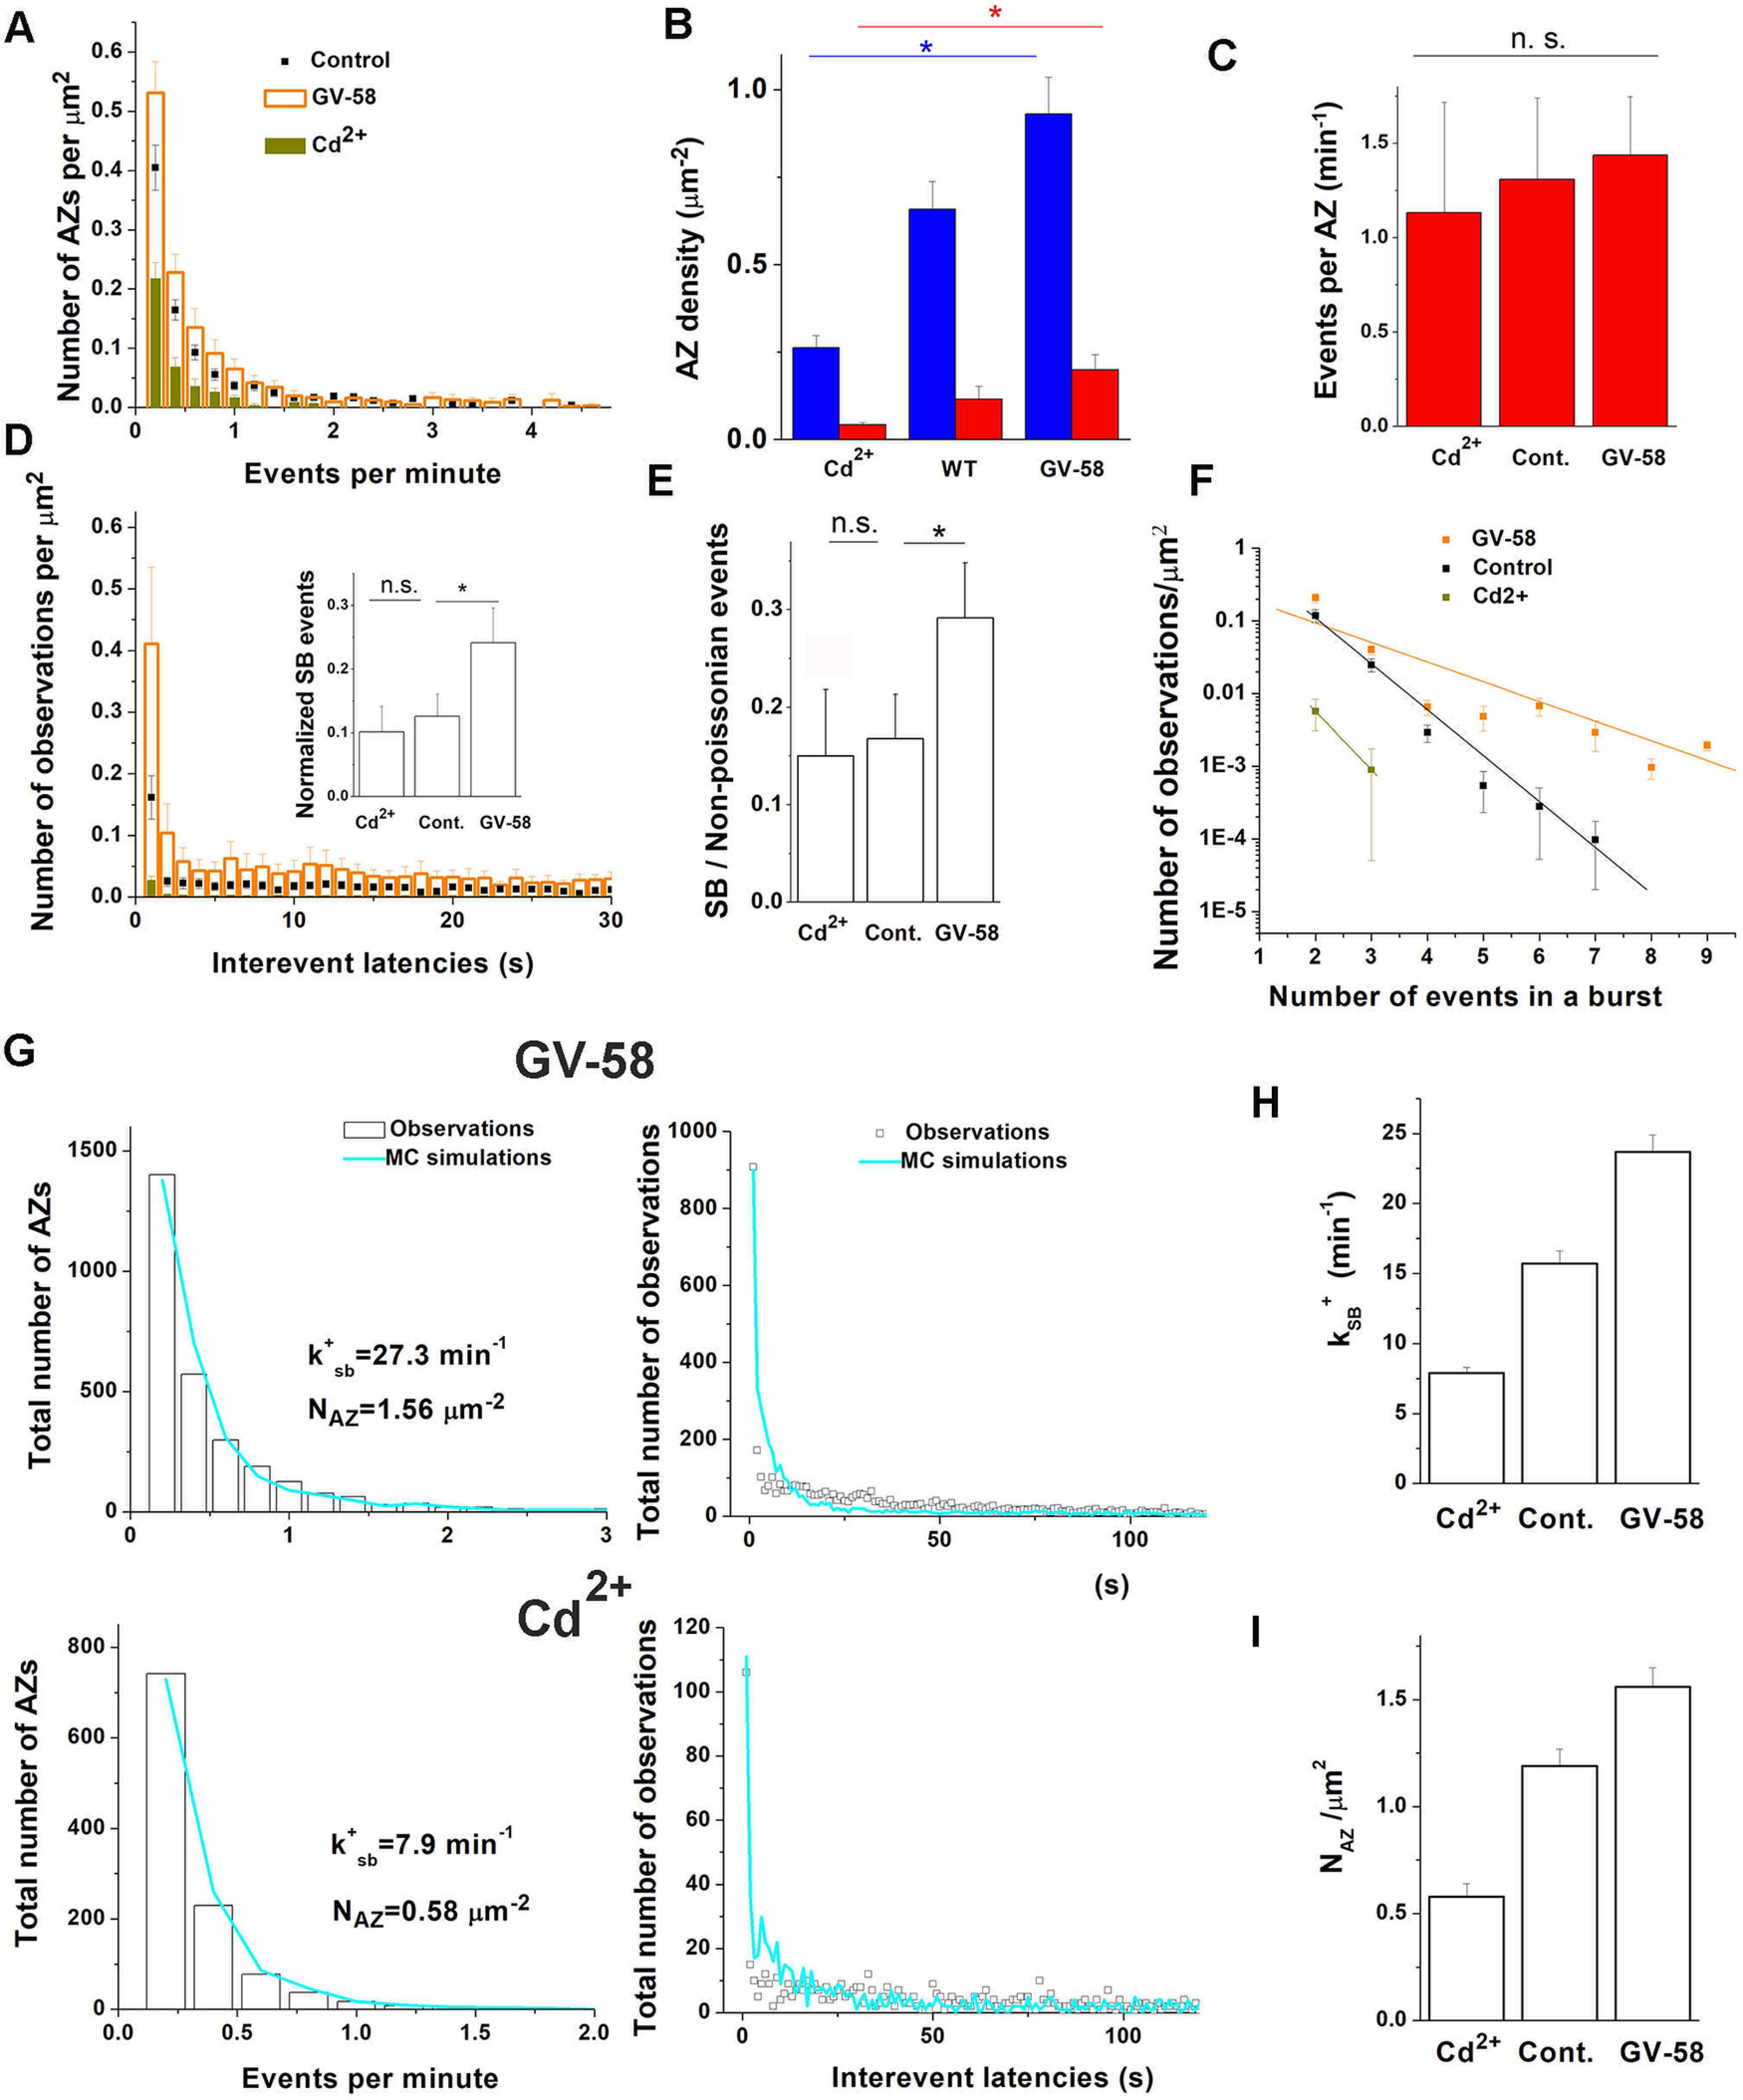
Ca2+-dependent alterations in spontaneous transmission at individual AZs. A, Both GV-58 and Cd2+ treatments broadly affect the activity distribution over AZ ensemble, with GV-58 promoting and Cd2+ inhibiting the activities. B, Cd2+ and GV-58 treatments proportionally reduce or increase, respectively, the density of the detected Poissonian and non-Poissonian AZs (*p < 0.05 per one-way ANOVA). C, The activity of non-Poissonian AZs is not significantly affected by either Cd2+ or GV-58 treatment. D, Latency histograms averaged across experiments show that neither treatment eliminates the peak at a 1 s latency. Inset, The GV-58 treatment significantly increases the pool of SB events (*p < 0.05 per ANOVA followed by post hoc Tukey test). E, The GV-58 treatment significantly increases the ratio between the SB pool of events and total non-Poissonian events (*p < 0.05 per ANOVA followed by post hoc Tukey test). F, The GV-58 treatment significantly affects the length of bursts of events (p < 0.01 per ANCOVA). G, MC simulations based on the three-state succession model (Fig. 5F) produce an excellent fit for the distributions of activities and latencies obtained from GV-58-treated and Cd2+-treated NMJs. The parameters k+SB and NAZ are adjusted. H, The rate of the transition from the HA state to the SB state, kSB+, is reduced on the Cd2+ treatment and increased on the GV-58 treatment. I, The density of AZs capable of spontaneous transmission, NAZ, is reduced on the Cd2+ treatment and increased on the GV-58 treatment.
Neither treatment eliminated the peak at the latency histogram corresponding to the subsecond interevent latencies (Fig. 10D). Notably, the SB population of events was significantly increased at GV-58-treated preparations (Fig. 10D, inset). Furthermore, the GV-58 treatment increased the fraction of SB events in the non-Poissonian ensemble (Fig. 10E). Finally, the GV-58 treatment produced significantly longer bursts of events (Fig. 10F, the decay slope b = −0.71 ± 0.06 for GV treated NMJs vs −0.27 ± 0.01 for control NMJs). These results indicate that the population of SB events may depend on Ca2+ levels.
To provide a more rigorous quantitative test for this hypothesis, we performed MC simulations for the datasets obtained from the treated NMJs. We found that to fit the distributions of activities and latencies by MC simulations (Fig. 10G), we had to adjust the parameters k+SB and NAZ (Fig. 5A) for GV-58-treated preparations (Table 1; Fig. 10H,I). Increasing NAZ in MC simulations was required to account quantitatively for the broad increase in activities at GV-58-treated preparations (Fig. 10A). This result suggests that silent AZs may become activated for spontaneous transmission on GV-58 treatment. For the Cd2+-treated preparations, the fit (Fig. 10G) could only be achieved by modifying three parameters (Table 1): decreasing k+SB, decreasing NAZ, and slightly decreasing rLA, the release rate for the Poissonian AZ ensemble. Thus, counter adjustments in the parameter k+SB were required for both Cd2+ and GV-58 datasets (Fig. 10H), supporting the assumption that Ca2+ influx drives bursts of spontaneous events at individual AZs. Furthermore, counter adjustments in the parameter NAZ (Fig. 10I) were also required, suggesting that a total lack of Ca2+ may silence an AZ for spontaneous transmission.
We next promoted the release of Ca2+ ions from internal stores. We used either ryanodine (Ryn) treatment (5 μm), promoting Ca2+ release from endoplasmic reticulum stores (Collin et al., 2005), or thapsigargin (Tga) treatment (5 µm), blocking the ATP-dependent Ca2+ uptake (Treiman et al., 1998). We first performed mEPSP recordings from Tga- or Ryn-treated preparations. Interestingly, we observed numerous enlarged and extended mEPSPs at Tga-treated preparations (Fig. 11A), which were also sometimes observed at Ryn-treated preparations but almost never observed at control. To evaluate the prevalence of the enlarged mEPSPs, we performed mEPSP area measurements (Fig. 11B). This analysis revealed a significant population of enlarged mEPSPs at treated preparations, and this was especially prominent for the Tga treatment (Fig. 11B, wine). Interestingly, neither treatment produced any significant change in the mEPSP frequency (0.82 ± 0.11 s−1 at Ryn-treated and 0.96 ± 0.17 at Tga-treated preparations vs 0.81 ± 0.09 s−1 at control). The fit of the mEPSP area distributions by the multipeak gaussians (Fig. 11C, dotted lines and arrows) suggested that mEPSPs at the Tga-treated preparations are largely composed out of multiquantal events, while single quantal events at the Tga-treated NMJs comprise <25% of all the mEPSPs (Fig. 11C, note the low amplitude of the first quantal peak for Tga). Furthermore, this analysis suggests that the Tga-treated preparations sometimes produce mEPSPs comprised of six or more quantal events. In contrast, single quantal events comprise >70% of all the mEPSPs at control (note the large first peak, Fig. 11C, black), while multiquantal mEPSPs are rare. Finally, at Ryn-treated preparations (Fig. 11C, orange), single quantal mEPSPs remain prevalent, although the majority mEPSPs are multiquantal.
Figure 11.
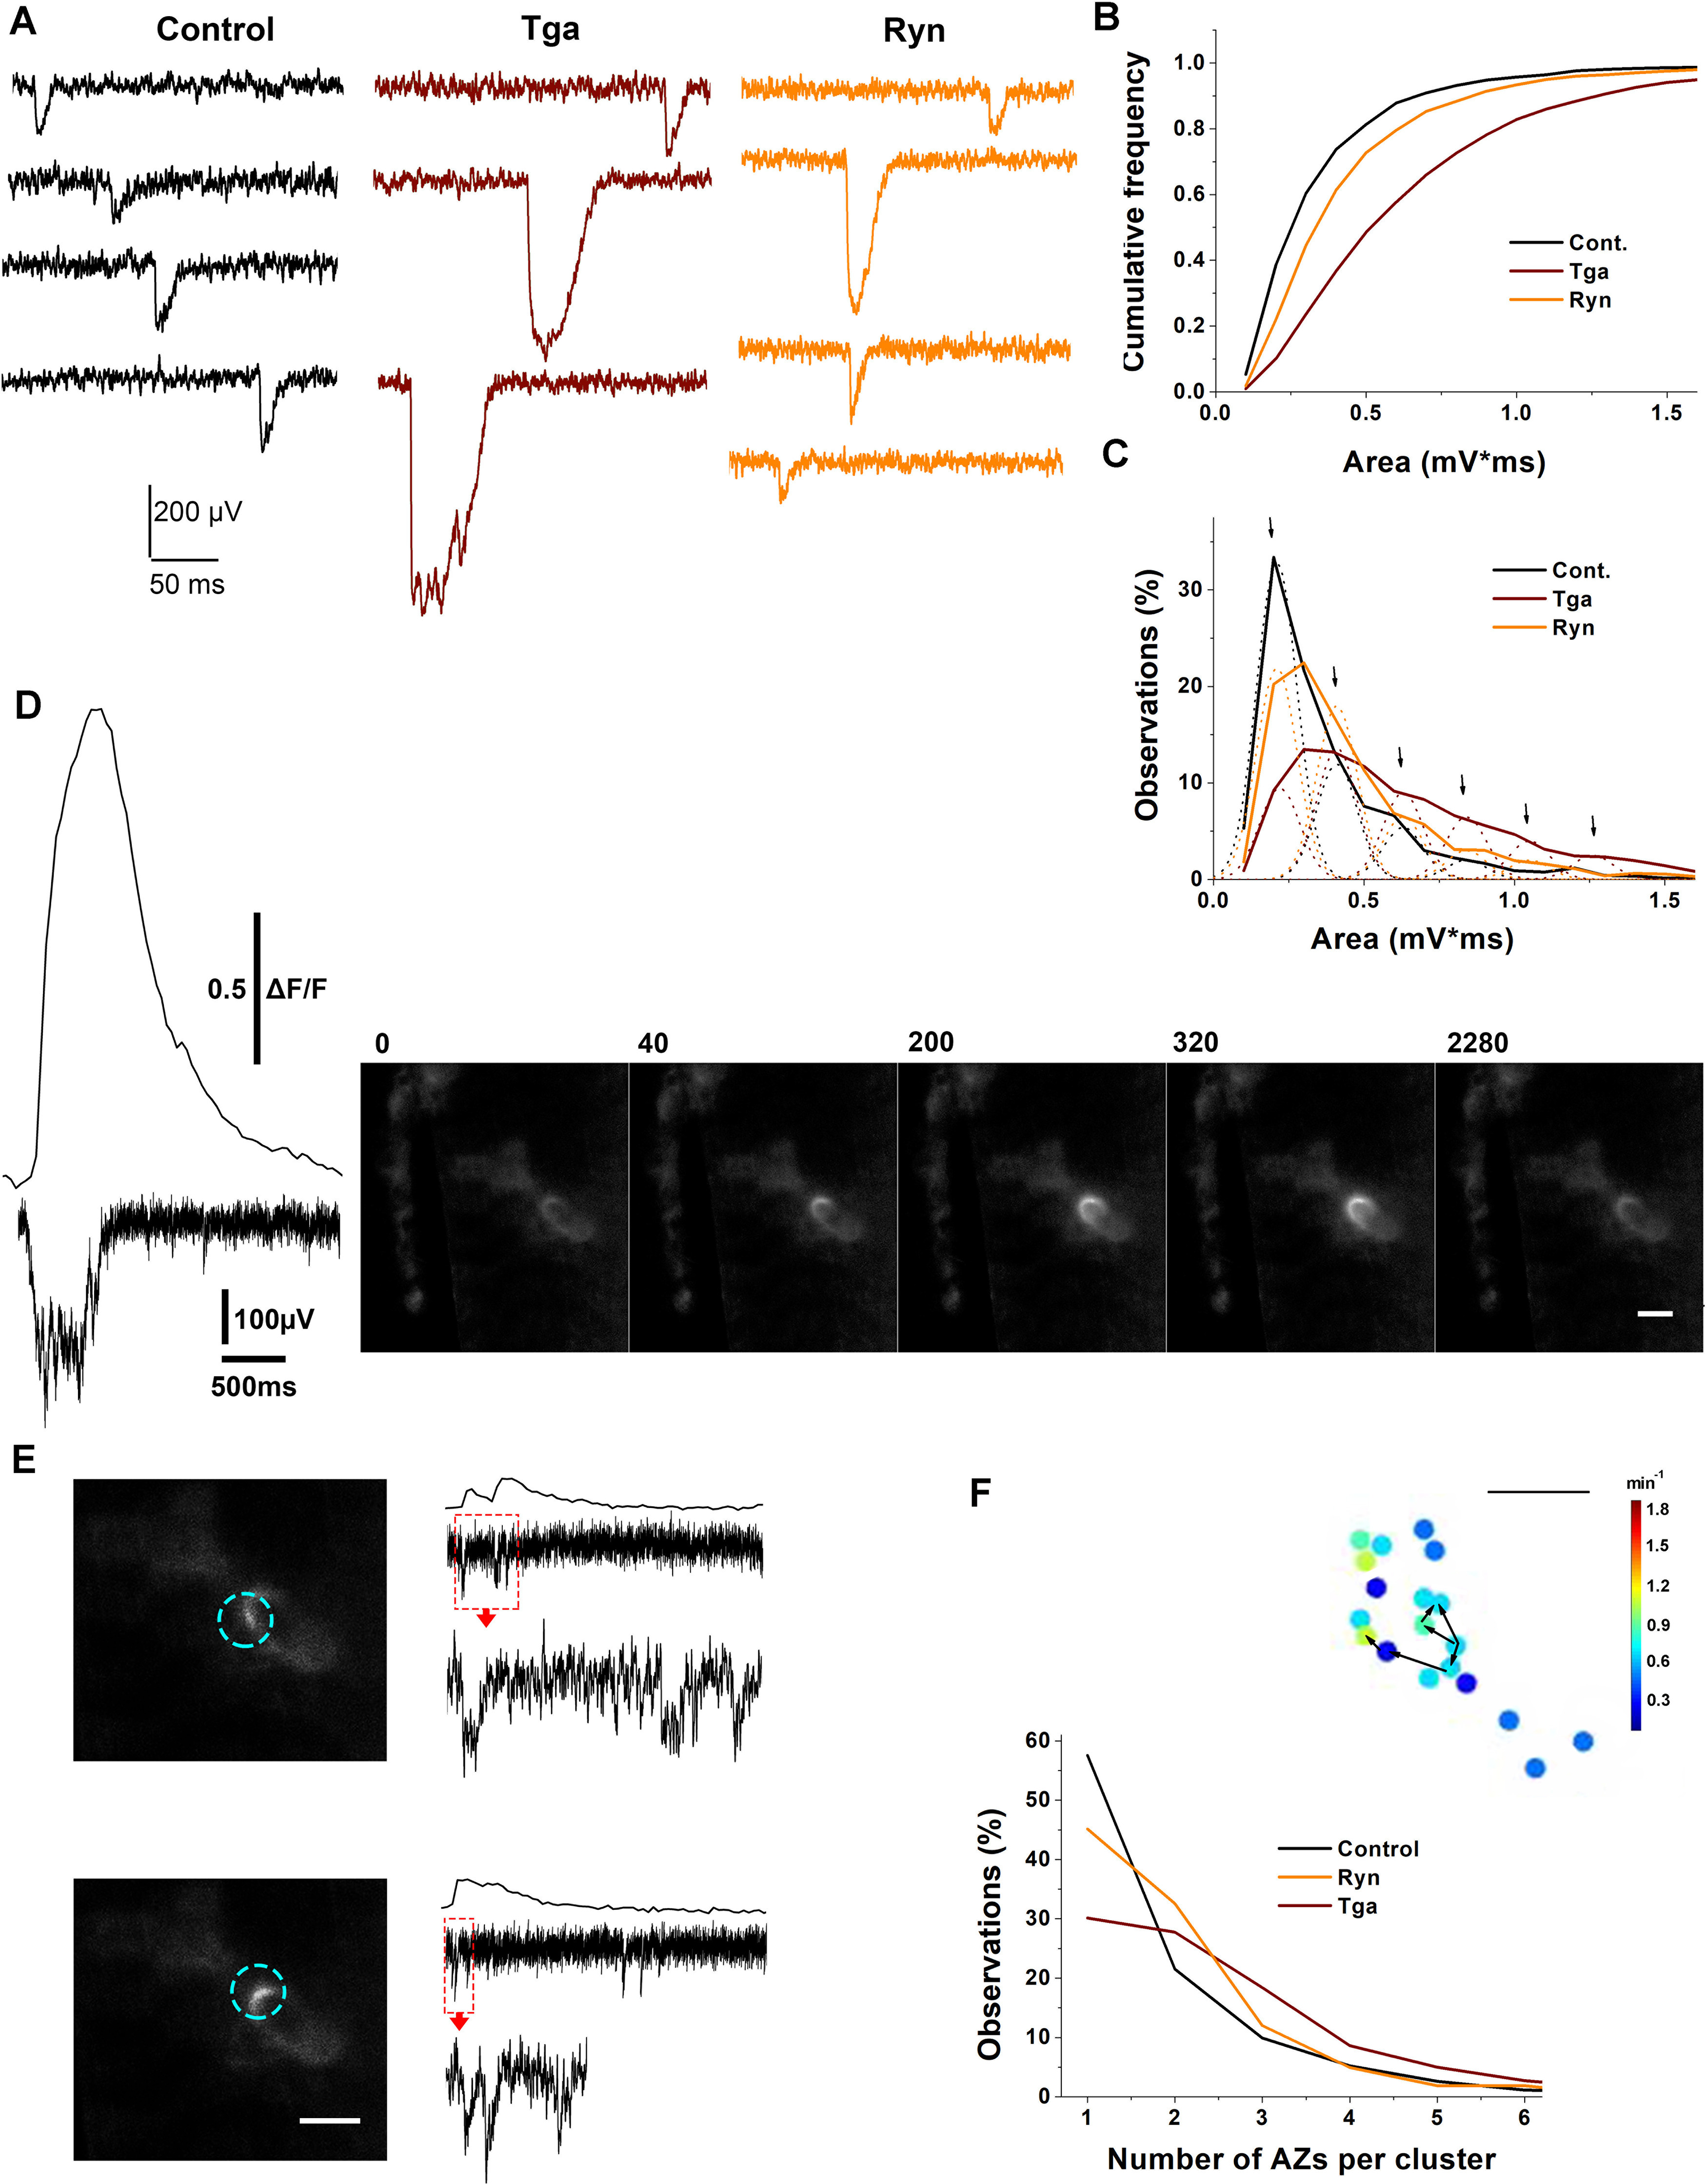
Release of Ca2+ from internal stores can activate AZ clusters. A, Representative recordings showing enlarged mEPSPs at Tga- and Ryn-treated preparations versus control NMJs. C, The cumulative distribution of mEPSP areas is shifted toward enlarged mEPSPs at Ryn-treated and especially at Tga-treated preparations. p < 0.01 and p < 0.0001 for Ryn- and Tga-treated preparations, respectively, per Kolmogorov–Smirnov test. B, Gaussian analysis of the distribution of mEPSP areas at Ryn and Tga NMJs shows numerous multiquantal events. Dotted lines indicate Gaussian probability density for the single quantal (the first peak), double quantal (the second peak), and multiquantal events. Arrows point to the Gaussian peaks. The control distribution is largely comprised of single quantal events, while at the Tga-treated preparations most of the mEPSPs are multiquantal. Data collected from eight preparations at each condition. D, An example showing an enlarged optical event at a Tga-treated NMJ lasting >2 s. The frames show the onset (40 ms), the peak fluorescence (from 200-320 ms), and the end of the event (2280 ms). Left, The fluorescent profile of the event and the matching enlarged and prolonged mEPSP. E, The same enlarged area showing small optical events with matching mEPSPs recorded at different time points. The scale is identical to that in A. Boxed regions of electrical recordings are shown at the extended scale at the bottom of each trace. Scale bars: D-F, 5 µm. Active AZ clusters at treated versus untreated preparations. Isolated events correspond to the data points at 1 AZ per cluster. The isolated events are prevalent at control but not at Tga-treated NMJs. Inset, An example of an active cluster (AZs connected by arrows). Arrows indicate the sequence of optical events within the cluster. Scale bar, 2 µm. Data collected from nine preparations for each treatment. p < 0.001 per Kolmogorov–Smirnov test for each treatment versus control.
We next investigated the activity at the individual AZs of GCaMP-expressing NMJs on Tga or Ryn treatments. Notably, we observed frequent unusually large optical events with the extended time course (Movie 3, red arrow). We used VER to determine whether these enlarged optical events match the enlarged mulitiquantal mEPSP responses. We found that, indeed, prolonged multiquantal mEPSPs typically matched the enlarged and prolonged optical events (Fig. 11D). Importantly, we observed small optical events matching small unitary mEPSPs within the same area (Fig. 11E). These observations suggest that the enlarged optical events matching the enlarged multiquantal mEPSPs represent the activity of AZ clusters. We next quantified such clusters at the treated preparations versus untreated controls. An active cluster (Fig. 11F, inset, puncta linked by black arrows) was defined as two or more AZs in the immediate vicinity to each other, with the most distant points being separated by no more than 5 μm, which produced optical events with the onsets separated by no more than 5 frames (200 ms). We then quantified the frequency of observations for the clusters (Fig. 11F, two or more AZs) and isolated events (Fig. 11F, one AZ). At control (Fig. 11F, black), the majority of events (∼60%) were isolated (note the prominent maximum at one AZ), and the clusters seldom included more than two AZs. In contrast, the activity at Tga-treated preparations (Fig. 11F, wine) was largely produced by AZ clusters, which often included five or more AZs. Furthermore, the isolated events at Tga-treated NMJs comprised only a minor portion of the overall activity. Finally, the Ryn-treated preparations (Fig. 11F, orange) had numerous active AZ clusters, although isolated events remained prevalent. These results suggest that Ca2+ release from internal stores can activate AZ clusters, which produce multiple release events.
Spontaneous activity at Tg-treated GCaMP5-expressing preparations: enlarged events (red arrow) versus unitary event (yellow arrows).
Together, our results support the three-state succession model (Fig. 12) of an AZ, in which transitions between the states and the activities are controlled by Ca2+-dependent and Ca2+-independent mechanisms (Fig. 12).
Figure 12.

Ca2+-dependent and Ca2+-independent mechanisms in the three-state succession model. The LA state depends on Ca2+ supplied through VGCC or from internal stores. This state may represent an AZ with relatively loose SVs, some of which are attached to the plasma membrane by partially assembled SNARE complex clamped by Cpx. In contrast, the HA state is defined by the abundance of SVs attached to the plasma membrane by nearly zippered SNARE complexes. Finally, spontaneous openings of VGCC generate the SB state, promoting bursts of release events closely following each other.
Discussion
We took advantage of GCaMP postsynaptic sensors (Melom et al., 2013; Newman et al., 2017) and combined the optical detection of synaptic events with electrophysiology (Vasin and Bykhovskaia, 2017) and computer simulations to investigate spontaneous transmission at individual AZs. We show that the release mechanisms produce “hot spots” of spontaneous activity. Unlike the hot spots of evoked activity (Akbergenova et al., 2018), the hot spots for spontaneous release are relatively short lived and not associated with structural AZ components. We detected two temporal components for the elevated spontaneous activity at individual AZs: at a timescale of minutes and at a subsecond timescale.
We used the Drosophila NMJ, which enables the high-resolution visualization of individual presynaptic AZs in real time. Although this is the most advantageous preparation to study synaptic activities at individual AZs, it remains to be investigated to what extent the conclusions of our study can be applied to mammalian synapses and whether any of the observed phenomena represent a hallmark of the immature larval NMJ.
We found that the spontaneous activity at individual AZs was well described by the three-state model, in which a LA AZ could transition to the HA state with a lifetime of minutes, and then transition to a very short-lived state that enables bursts of spontaneous events at a subsecond scale. Our initial justification for this model came from a detailed statistical analysis of release events. We found that the majority AZs represented a Poissonian ensemble, corresponding to a large number of functionally equivalent units producing events with low probabilities. However, a small but clearly detectable AZ population (∼10%) deviated from the Poissonian distribution and had release probabilities that significantly exceeded those derived from the Poissonian law. These non-Poissonian AZs, being highly active, accounted for almost half of spontaneous transmission. Thus, spontaneous transmission could be described as a mixture of signaling at hot spots and a Poissonian noise.
Notably, the HA AZs did not have structural correlates, such as the increased levels of the scaffolding protein Brp, although the positions of individual AZs generally coincided with Brp puncta. Furthermore, the spots of elevated spontaneous activity did not correlate with the spots of elevated evoked transmission. Finally, the elevated spontaneous activity was not a permanent AZ feature. Instead, our results showed that HA was a temporary state with a typical lifetime of several minutes.
The analysis of interevent latencies at individual AZs revealed an unexpected population of release events that followed each other within 1 s. Combining optical event detection with electrical recordings of mEPSPs enabled us to couple the spatial resolution provided by microscopy with the temporal resolution provided by electrophysiology. This analysis revealed that subsequent events at individual AZs frequently follow each other within milliseconds or tens of milliseconds.
These findings agree with earlier studies which showed that synaptic transmission is spatially (Wojtowicz et al., 1994; Peled and Isacoff, 2011) and temporally (Cohen et al., 1974, 1981) heterogeneous. Our study revealed two temporal components of this heterogeneity in relation to individual AZs, raising the question of what mechanisms define this heterogeneity within AZ ensembles. Since we are unable to unambiguously determine the state of an AZ because of the probabilistic nature of the release process, we coupled experiments with MC simulations. Stochastic modeling of the release process is a proven approach, which has been used broadly to understand the mechanisms of synaptic plasticity (Bykhovskaia et al., 2000; Nadkarni et al., 2010; Luo et al., 2015; Miki et al., 2016). We used this approach to understand the mechanisms of temporal and spatial heterogeneity in spontaneous transmission. MC simulations showed that the three-state model provided a very good fit for the observed statistics of spontaneous transmission. This enabled us to investigate the effect of Ca2+ and protein release machinery on the activities of individual AZs.
We started by addressing the role of Cpx since Cpx is a powerful regulator of spontaneous transmission (Huntwork and Littleton, 2007). Notably, we found that Cpx OE preparations have a Poissonian ensemble of AZs, with the HA state being essentially eliminated. One possible interpretation for this finding would be that Cpx maintains AZs in their LA state, in which case the LA state would be eliminated in the absence of Cpx. However, the analysis of cpx−/− preparations showed that this was not the case. Although the HA state was drastically promoted by the Cpx deletion, the LA Poissonian ensemble was not eliminated and remained in the mixture. The results obtained at the lines with altered Cpx levels, including the Cpx OE, cpx−/−, and cpx+/−, showed the selective effect of Cpx on the HA state, which was diminished by the Cpx OE and promoted by the Cpx deletion. Furthermore, the mutation in the SNARE protein Sx1A (Littleton et al., 1998; Lagow et al., 2007), which likely affects Cpx-controlled SNARE zippering (Vasin et al., 2016), promoted the HA state, similar to Cpx deficiency.
These results support the model in which the HA state is defined by the abundance of nearly zippered SNARE complexes. The conversion between the LA and HA states would then be regulated by membrane trafficking of Sx1A. In support of this hypothesis, it was demonstrated that Sx1A forms dynamic clusters (Bademosi et al., 2017; Li et al., 2020), which regulate spontaneous transmission (Khuong et al., 2013). We favor the hypothesis that the formation of Sx1A clusters generates the hot spots of spontaneous transmission and that this process is enhanced by Cpx dispersion from these hot spots, promoting SNARE zippering. Further experimentation is needed to test this hypothesis directly.
It should be noted that the Cpx role in fusion clamping is well established in invertebrates but is more controversial at mammalian synapses (Mohrmann et al., 2015; Trimbuch and Rosenmund, 2016). However, it was demonstrated that Cpx inhibits spontaneous activity at cortical neuronal cultures (Yang et al., 2013), at the mammalian calyx of Held (Chang et al., 2015), and at ribbon (Vaithianathan et al., 2013, 2015) synapses. Furthermore, promoting Cpx action inhibited exocytosis in neurosecretory cells (Abderrahmani et al., 2004; J. Liu et al., 2007), providing additional evidence for Cpx clamping function in mammals. It remains to be investigated how Cpx deficiency affects the activities of individual AZs at mammalian synapses.
Our experiments, combined with simulations, also suggested that spontaneous VGCC openings account for the bursts of release events from individual AZs at a time scale from milliseconds to seconds. This finding is in line with earlier studies, showing that spontaneous release depends on the activation of VGCC (Williams et al., 2012; Kavalali, 2020). Furthermore, we showed that Ca2+ release from internal stores could produce simultaneous or nearly simultaneous release events from clusters of closely positioned AZs, and these giant optical events coincided with giant mEPSPs. Although earlier experimental (Korn et al., 1993) and theoretical (Bennett et al., 1995) studies suggested that some mEPSPs could represent synchronous multivesicular releases, this mechanism has not been demonstrated directly. Our study showed that such events arise in response to Ca2+ release from internal stores and that they represent the activity of AZ clusters.
It is still debated how specifically Ca2+ transients regulate spontaneous transmission, and several molecular Ca2+ sensors affecting spontaneous release have been identified (Courtney et al., 2018; Huson and Regehr, 2020; Shin and Kavalali, 2021). Our study revealed the components of spontaneous transmission that are most sensitive to Ca2+ transients and created the framework for the investigation of the molecular Ca2+ sensors regulating spontaneous transmission.
Finally, we showed that the number of AZs participating in spontaneous transmission, NAZ, is plastic and tightly regulated. Since the majority of AZs have low release probabilities and may not produce events during the experiment, we had to derive NAZ by fitting AZ activities with MC simulations. Notably, NAZ was increased at cpx−/− and syx3-69 NMJs, as could be expected from developmental alterations observed at these lines (Cho et al., 2015). Unexpectedly, we found that NAZ was significantly altered by Ca2+ manipulations, suggesting that local Ca2+ levels may define the abilities of AZs to participate in spontaneous transmission. Since Ca2+ regulates SV docking (Pinheiro et al., 2016; Kreutzberger et al., 2017; Malagon et al., 2020), it is likely that the lack of docked SVs may preclude some AZs from contributing to spontaneous transmission.
Together, our findings show that spontaneous transmission is dynamic and plastic and that several molecular mechanisms generate transient hot spots of spontaneous release. The signaling at the hot spots is mixed with a random Poissonian population of release events, and this Poissonian spontaneous noise appears insensitive to manipulations with the protein release machinery. In contrast, the hot spots of spontaneous transmission are controlled tightly by the SNARE-Cpx complex and by Ca2+ transients. Since the synaptic growth depends on spontaneous transmission (Choi et al., 2014; Cho et al., 2015), the hot spots could serve as tags for outgrowth of new synaptic boutons. In contrast, the low-probability Poissonian component of spontaneous transmission could mediate the homeostatic regulation (Davis and Muller, 2015).
Footnotes
This work was supported by the National Institute of Health Grant F31 NS100488.
The authors declare no competing financial interests.
References
- Abderrahmani A, Niederhauser G, Plaisance V, Roehrich ME, Lenain V, Coppola T, Regazzi R, Waeber G (2004) Complexin I regulates glucose-induced secretion in pancreatic beta-cells. J Cell Sci 117:2239–2247. 10.1242/jcs.01041 [DOI] [PubMed] [Google Scholar]
- Abenavoli A, Forti L, Bossi M, Bergamaschi A, Villa A, Malgaroli A (2002) Multimodal quantal release at individual hippocampal synapses: evidence for no lateral inhibition. J Neurosci 22:6336–6346. 10.1523/JNEUROSCI.22-15-06336.2002 [DOI] [PMC free article] [PubMed] [Google Scholar]
- Akbergenova Y, Cunningham KL, Zhang YV, Weiss S, Littleton JT (2018) Characterization of developmental and molecular factors underlying release heterogeneity at Drosophila synapses. Elife 7:e38268. 10.7554/eLife.38268 [DOI] [PMC free article] [PubMed] [Google Scholar]
- Bademosi AT, Lauwers E, Padmanabhan P, Odierna L, Chai YJ, Papadopulos A, Goodhill GJ, Verstreken P, van Swinderen B, Meunier FA (2017) In vivo single-molecule imaging of syntaxin1A reveals polyphosphoinositide- and activity-dependent trapping in presynaptic nanoclusters. Nat Commun 8:13660. 10.1038/ncomms14492 [DOI] [PMC free article] [PubMed] [Google Scholar]
- Bennett MR, Gibson WG, Robinson J (1995) Probabilistic secretion of quanta: spontaneous release at active zones of varicosities, boutons, and endplates. Biophys J 69:42–56. 10.1016/S0006-3495(95)79873-3 [DOI] [PMC free article] [PubMed] [Google Scholar]
- Brady J, Vasin A, Bykhovskaia M (2021) The accessory helix of complexin stabilizes a partially unzippered state of the SNARE complex and mediates the complexin clamping function in vivo. eNeuro 8:ENEURO.0526-20.2021. 10.1523/ENEURO.0526-20.2021 [DOI] [PMC free article] [PubMed] [Google Scholar]
- Brunger AT, Choi UB, Lai Y, Leitz J, White KI, Zhou Q (2019) The pre-synaptic fusion machinery. Curr Opin Struct Biol 54:179–188. 10.1016/j.sbi.2019.03.007 [DOI] [PMC free article] [PubMed] [Google Scholar]
- Burnod Y, Korn H (1989) Consequences of stochastic release of neurotransmitters for network computation in the central nervous system. Proc Natl Acad Sci USA 86:352–356. 10.1073/pnas.86.1.352 [DOI] [PMC free article] [PubMed] [Google Scholar]
- Bykhovskaia M (2008) Making quantal analysis more convenient, fast, and accurate: user-friendly software QUANTAN. J Neurosci Methods 168:500–513. 10.1016/j.jneumeth.2007.10.006 [DOI] [PMC free article] [PubMed] [Google Scholar]
- Bykhovskaia M, Worden MK, Hackett JT (2000) Stochastic modeling of facilitated neurosecretion. J Comput Neurosci 8:113–126. 10.1023/A:1008917130947 [DOI] [PubMed] [Google Scholar]
- Bykhovskaia M, Jagota A, Gonzalez A, Vasin A, Littleton JT (2013) Interaction of the complexin accessory helix with the C-terminus of the SNARE complex: molecular-dynamics model of the fusion clamp. Biophys J 105:679–690. 10.1016/j.bpj.2013.06.018 [DOI] [PMC free article] [PubMed] [Google Scholar]
- Chang S, Reim K, Pedersen M, Neher E, Brose N, Taschenberger H (2015) Complexin stabilizes newly primed synaptic vesicles and prevents their premature fusion at the mouse calyx of Held synapse. J Neurosci 35:8272–8290. 10.1523/JNEUROSCI.4841-14.2015 [DOI] [PMC free article] [PubMed] [Google Scholar]
- Chen X, Tomchick DR, Kovrigin E, Arac D, Machius M, Sudhof TC, Rizo J (2002) Three-dimensional structure of the complexin/SNARE complex. Neuron 33:397–409. 10.1016/S0896-6273(02)00583-4 [DOI] [PubMed] [Google Scholar]
- Cho RW, Buhl LK, Volfson D, Tran A, Li F, Akbergenova Y, Littleton JT (2015) Phosphorylation of complexin by PKA regulates activity-dependent spontaneous neurotransmitter release and structural synaptic plasticity. Neuron 88:749–761. 10.1016/j.neuron.2015.10.011 [DOI] [PMC free article] [PubMed] [Google Scholar]
- Choi BJ, Imlach WL, Jiao W, Wolfram V, Wu Y, Grbic M, Cela C, Baines RA, Nitabach MN, McCabe BD (2014) Miniature neurotransmission regulates Drosophila synaptic structural maturation. Neuron 82:618–634. 10.1016/j.neuron.2014.03.012 [DOI] [PMC free article] [PubMed] [Google Scholar]
- Cohen I, Kita H, Van Der Kloot W (1974) Stochastic properties of spontaneous transmitter release at the crayfish neuromuscular junction. J Physiol 236:363–371. 10.1113/jphysiol.1974.sp010439 [DOI] [PMC free article] [PubMed] [Google Scholar]
- Cohen IS, van der Kloot W, Barton SB (1981) Bursts of miniature end-plate potentials can be released from localized regions of the frog motor nerve terminal. Brain Res 221:382–386. 10.1016/0006-8993(81)90787-3 [DOI] [PubMed] [Google Scholar]
- Collin T, Marty A, Llano I (2005) Presynaptic calcium stores and synaptic transmission. Curr Opin Neurobiol 15:275–281. 10.1016/j.conb.2005.05.003 [DOI] [PubMed] [Google Scholar]
- Courtney NA, Briguglio JS, Bradberry MM, Greer C, Chapman ER (2018) Excitatory and inhibitory neurons utilize different Ca(2+) sensors and sources to regulate spontaneous release. Neuron 98:977–991.e5. 10.1016/j.neuron.2018.04.022 [DOI] [PMC free article] [PubMed] [Google Scholar]
- Crawford DC, Kavalali ET (2015) Molecular underpinnings of synaptic vesicle pool heterogeneity. Traffic 16:338–364. 10.1111/tra.12262 [DOI] [PMC free article] [PubMed] [Google Scholar]
- Davis GW, Muller M (2015) Homeostatic control of presynaptic neurotransmitter release. Annu Rev Physiol 77:251–270. 10.1146/annurev-physiol-021014-071740 [DOI] [PubMed] [Google Scholar]
- Dolphin AC, Lee A (2020) Presynaptic calcium channels: specialized control of synaptic neurotransmitter release. Nat Rev Neurosci 21:213–229. 10.1038/s41583-020-0278-2 [DOI] [PMC free article] [PubMed] [Google Scholar]
- Ehmann N, van de Linde S, Alon A, Ljaschenko D, Keung XZ, Holm T, Rings A, DiAntonio A, Hallermann S, Ashery U, Heckmann M, Sauer M, Kittel RJ (2014) Quantitative super-resolution imaging of Bruchpilot distinguishes active zone states. Nat Commun 5:4650. 10.1038/ncomms5650 [DOI] [PMC free article] [PubMed] [Google Scholar]
- Faure P, Korn H (1997) A nonrandom dynamic component in the synaptic noise of a central neuron. Proc Natl Acad Sci USA 94:6506–6511. 10.1073/pnas.94.12.6506 [DOI] [PMC free article] [PubMed] [Google Scholar]
- Freedman D (2009) Statistical models: theory and practice. New York: Cambridge UP. [Google Scholar]
- Ghelani T, Sigrist SJ (2018) Coupling the structural and functional assembly of synaptic release sites. Front Neuroanat 12:81. 10.3389/fnana.2018.00081 [DOI] [PMC free article] [PubMed] [Google Scholar]
- Giraudo CG, Eng WS, Melia TJ, Rothman JE (2006) A clamping mechanism involved in SNARE-dependent exocytosis. Science 313:676–680. 10.1126/science.1129450 [DOI] [PubMed] [Google Scholar]
- Giraudo CG, Garcia-Diaz A, Eng WS, Chen Y, Hendrickson WA, Melia TJ, Rothman JE (2009) Alternative zippering as an on-off switch for SNARE-mediated fusion. Science 323:512–516. 10.1126/science.1166500 [DOI] [PMC free article] [PubMed] [Google Scholar]
- Goda Y, Sudhof TC (1997) Calcium regulation of neurotransmitter release: reliably unreliable? Curr Opin Cell Biol 9:513–518. 10.1016/S0955-0674(97)80027-0 [DOI] [PubMed] [Google Scholar]
- Gramlich MW, Klyachko VA (2019) Nanoscale organization of vesicle release at central synapses. Trends Neurosci 42:425–437. 10.1016/j.tins.2019.03.001 [DOI] [PMC free article] [PubMed] [Google Scholar]
- Gratz SJ, Goel P, Bruckner JJ, Hernandez RX, Khateeb K, Macleod GT, Dickman D, O'Connor-Giles KM (2019) Endogenous tagging reveals differential regulation of Ca(2+) channels at single active zones during presynaptic homeostatic potentiation and depression. J Neurosci 39:2416–2429. 10.1523/JNEUROSCI.3068-18.2019 [DOI] [PMC free article] [PubMed] [Google Scholar]
- Holz RW, Zimmerberg J (2019) Dynamic relationship of the SNARE complex with a membrane. Biophys J 117:627–630. 10.1016/j.bpj.2019.07.010 [DOI] [PMC free article] [PubMed] [Google Scholar]
- Huntwork S, Littleton JT (2007) A complexin fusion clamp regulates spontaneous neurotransmitter release and synaptic growth. Nat Neurosci 10:1235–1237. 10.1038/nn1980 [DOI] [PubMed] [Google Scholar]
- Huson V, Regehr WG (2020) Diverse roles of Synaptotagmin-7 in regulating vesicle fusion. Curr Opin Neurobiol 63:42–52. 10.1016/j.conb.2020.02.006 [DOI] [PMC free article] [PubMed] [Google Scholar]
- Jorquera RA, Huntwork-Rodriguez S, Akbergenova Y, Cho RW, Littleton JT (2012) Complexin controls spontaneous and evoked neurotransmitter release by regulating the timing and properties of synaptotagmin activity. J Neurosci 32:18234–18245. 10.1523/JNEUROSCI.3212-12.2012 [DOI] [PMC free article] [PubMed] [Google Scholar]
- Karatekin E (2018) Toward a unified picture of the exocytotic fusion pore. FEBS Lett 592:3563–3585. 10.1002/1873-3468.13270 [DOI] [PMC free article] [PubMed] [Google Scholar]
- Kavalali ET (2015) The mechanisms and functions of spontaneous neurotransmitter release. Nat Rev Neurosci 16:5–16. 10.1038/nrn3875 [DOI] [PubMed] [Google Scholar]
- Kavalali ET (2018) Spontaneous neurotransmission: a form of neural communication comes of age. J Neurosci Res 96:331–334. 10.1002/jnr.24207 [DOI] [PMC free article] [PubMed] [Google Scholar]
- Kavalali ET (2020) Neuronal Ca(2+) signalling at rest and during spontaneous neurotransmission. J Physiol 598:1649–1654. 10.1113/JP276541 [DOI] [PubMed] [Google Scholar]
- Khuong TM, Habets RL, Kuenen S, Witkowska A, Kasprowicz J, Swerts J, Jahn R, van den Bogaart G, Verstreken P (2013) Synaptic PI(3,4,5)P3 is required for Syntaxin1A clustering and neurotransmitter release. Neuron 77:1097–1108. 10.1016/j.neuron.2013.01.025 [DOI] [PubMed] [Google Scholar]
- Korn H, Bausela F, Charpier S, Faber DS (1993) Synaptic noise and multiquantal release at dendritic synapses. J Neurophysiol 70:1249–1254. 10.1152/jn.1993.70.3.1249 [DOI] [PubMed] [Google Scholar]
- Kreutzberger AJ, Kiessling V, Liang B, Seelheim P, Jakhanwal S, Jahn R, Castle JD, Tamm LK (2017) Reconstitution of calcium-mediated exocytosis of dense-core vesicles. Sci Adv 3:e1603208. 10.1126/sciadv.1603208 [DOI] [PMC free article] [PubMed] [Google Scholar]
- Kummel D, Krishnakumar SS, Radoff DT, Li F, Giraudo CG, Pincet F, Rothman JE, Reinisch KM (2011) Complexin cross-links prefusion SNAREs into a zigzag array. Nat Struct Mol Biol 18:927–933. 10.1038/nsmb.2101 [DOI] [PMC free article] [PubMed] [Google Scholar]
- Lagow RD, Bao H, Cohen EN, Daniels RW, Zuzek A, Williams WH, Macleod GT, Sutton RB, Zhang B (2007) Modification of a hydrophobic layer by a point mutation in syntaxin 1A regulates the rate of synaptic vesicle fusion. PLoS Biol 5:e72. 10.1371/journal.pbio.0050072 [DOI] [PMC free article] [PubMed] [Google Scholar]
- Leao RN, Leao FN, Walmsley B (2005) Non-random nature of spontaneous mIPSCs in mouse auditory brainstem neurons revealed by recurrence quantification analysis. Proc Biol Sci 272:2551–2559. 10.1098/rspb.2005.3258 [DOI] [PMC free article] [PubMed] [Google Scholar]
- Lefkowitz JJ, Fogarty KE, Lifshitz LM, Bellve KD, Tuft RA, ZhuGe R, Walsh JV Jr, De Crescenzo V (2009) Suppression of Ca2+ syntillas increases spontaneous exocytosis in mouse adrenal chromaffin cells. J Gen Physiol 134:267–280. 10.1085/jgp.200910285 [DOI] [PMC free article] [PubMed] [Google Scholar]
- Li M, Oh TJ, Fan H, Diao J, Zhang K (2020) Syntaxin clustering and optogenetic control for synaptic membrane fusion. J Mol Biol 432:4773–4782. [DOI] [PubMed] [Google Scholar]
- Littleton JT, Chapman ER, Kreber R, Garment MB, Carlson SD, Ganetzky B (1998) Temperature-sensitive paralytic mutations demonstrate that synaptic exocytosis requires SNARE complex assembly and disassembly. Neuron 21:401–413. 10.1016/S0896-6273(00)80549-8 [DOI] [PubMed] [Google Scholar]
- Liu J, Guo T, Wu J, Bai X, Zhou Q, Sui SF (2007) Overexpression of complexin in PC12 cells inhibits exocytosis by preventing SNARE complex recycling. Biochemistry (Mosc) 72:439–444. 10.1134/s0006297907040116 [DOI] [PubMed] [Google Scholar]
- Liu P, Khvotchev M, Li YC, Chanaday NL, Kavalali ET (2018) Copine-6 binds to SNAREs and selectively suppresses spontaneous neurotransmission. J Neurosci 38:5888–5899. 10.1523/JNEUROSCI.0461-18.2018 [DOI] [PMC free article] [PubMed] [Google Scholar]
- Llano I, Gonzalez J, Caputo C, Lai FA, Blayney LM, Tan YP, Marty A (2000) Presynaptic calcium stores underlie large-amplitude miniature IPSCs and spontaneous calcium transients. Nat Neurosci 3:1256–1265. 10.1038/81781 [DOI] [PubMed] [Google Scholar]
- Luo F, Dittrich M, Cho S, Stiles JR, Meriney SD (2015) Transmitter release is evoked with low probability predominately by calcium flux through single channel openings at the frog neuromuscular junction. J Neurophysiol 113:2480–2489. 10.1152/jn.00879.2014 [DOI] [PMC free article] [PubMed] [Google Scholar]
- Malagon G, Miki T, Tran V, Gomez LC, Marty A (2020) Incomplete vesicular docking limits synaptic strength under high release probability conditions. Elife 9:e52137. 10.7554/eLife.52137 [DOI] [PMC free article] [PubMed] [Google Scholar]
- McKinney RA, Capogna M, Durr R, Gahwiler BH, Thompson SM (1999) Miniature synaptic events maintain dendritic spines via AMPA receptor activation. Nat Neurosci 2:44–49. 10.1038/4548 [DOI] [PubMed] [Google Scholar]
- Meinertzhagen IA, Govind CK, Stewart BA, Carter JM, Atwood HL (1998) Regulated spacing of synapses and presynaptic active zones at larval neuromuscular junctions in different genotypes of the flies Drosophila and Sarcophaga. J Comp Neurol 393:482–492. [DOI] [PubMed] [Google Scholar]
- Melom JE, Akbergenova Y, Gavornik JP, Littleton JT (2013) Spontaneous and evoked release are independently regulated at individual active zones. J Neurosci 33:17253–17263. 10.1523/JNEUROSCI.3334-13.2013 [DOI] [PMC free article] [PubMed] [Google Scholar]
- Miki T, Malagon G, Pulido C, Llano I, Neher E, Marty A (2016) Actin- and myosin-dependent vesicle loading of presynaptic docking sites prior to exocytosis. Neuron 91:808–823. 10.1016/j.neuron.2016.07.033 [DOI] [PubMed] [Google Scholar]
- Mohrmann R, Dhara M, Bruns D (2015) Complexins: small but capable. Cell Mol Life Sci 72:4221–4235. 10.1007/s00018-015-1998-8 [DOI] [PMC free article] [PubMed] [Google Scholar]
- Nadkarni S, Bartol TM, Sejnowski TJ, Levine H (2010) Modelling vesicular release at hippocampal synapses. PLoS Comput Biol 6:e1000983. 10.1371/journal.pcbi.1000983 [DOI] [PMC free article] [PubMed] [Google Scholar]
- Neher E, Brose N (2018) Dynamically primed synaptic vesicle states: key to understand synaptic short-term plasticity. Neuron 100:1283–1291. 10.1016/j.neuron.2018.11.024 [DOI] [PubMed] [Google Scholar]
- Newman ZL, Hoagland A, Aghi K, Worden K, Levy SL, Son JH, Lee LP, Isacoff EY (2017) Input-specific plasticity and homeostasis at the Drosophila larval neuromuscular junction. Neuron 93:1388–1404. 10.1016/j.neuron.2017.02.028 [DOI] [PMC free article] [PubMed] [Google Scholar]
- Peled ES, Isacoff EY (2011) Optical quantal analysis of synaptic transmission in wild-type and rab3-mutant Drosophila motor axons. Nat Neurosci 14:519–526. 10.1038/nn.2767 [DOI] [PMC free article] [PubMed] [Google Scholar]
- Peled ES, Newman ZL, Isacoff EY (2014) Evoked and spontaneous transmission favored by distinct sets of synapses. Curr Biol 24:484–493. 10.1016/j.cub.2014.01.022 [DOI] [PMC free article] [PubMed] [Google Scholar]
- Pinheiro PS, Houy S, Sorensen JB (2016) C2-domain containing calcium sensors in neuroendocrine secretion. J Neurochem 139:943–958. 10.1111/jnc.13865 [DOI] [PubMed] [Google Scholar]
- Radoff DT, Dong Y, Snead D, Bai J, Eliezer D, Dittman JS (2014) The accessory helix of complexin functions by stabilizing central helix secondary structure. Elife 3:e04553. 10.7554/eLife.04553 [DOI] [PMC free article] [PubMed] [Google Scholar]
- Reese AL, Kavalali ET (2015) Spontaneous neurotransmission signals through store-driven Ca(2+) transients to maintain synaptic homeostasis. Elife 4:e09262. 10.7554/eLife.09262 [DOI] [PMC free article] [PubMed] [Google Scholar]
- Rizo J (2018) Mechanism of neurotransmitter release coming into focus. Protein Sci 27:1364–1391. 10.1002/pro.3445 [DOI] [PMC free article] [PubMed] [Google Scholar]
- Shin OH, Kavalali ET (2021) Evolutionary diversity of the dual Ca(2+) sensor system for neurotransmitter release. Cell Calcium 96:102402. 10.1016/j.ceca.2021.102402 [DOI] [PubMed] [Google Scholar]
- Simkus CR, Stricker C (2002) The contribution of intracellular calcium stores to mEPSCs recorded in layer II neurones of rat barrel cortex. J Physiol 545:521–535. 10.1113/jphysiol.2002.022103 [DOI] [PMC free article] [PubMed] [Google Scholar]
- Stevens CF, Wang Y (1994) Changes in reliability of synaptic function as a mechanism for plasticity. Nature 371:704–707. 10.1038/371704a0 [DOI] [PubMed] [Google Scholar]
- Sutton MA, Ito HT, Cressy P, Kempf C, Woo JC, Schuman EM (2006) Miniature neurotransmission stabilizes synaptic function via tonic suppression of local dendritic protein synthesis. Cell 125:785–799. 10.1016/j.cell.2006.03.040 [DOI] [PubMed] [Google Scholar]
- Tarr TB, Dittrich M, Meriney SD (2013a) Are unreliable release mechanisms conserved from NMJ to CNS? Trends Neurosci 36:14–22. 10.1016/j.tins.2012.09.009 [DOI] [PMC free article] [PubMed] [Google Scholar]
- Tarr TB, Malick W, Liang M, Valdomir G, Frasso M, Lacomis D, Reddel SW, Garcia-Ocano A, Wipf P, Meriney SD (2013b) Evaluation of a novel calcium channel agonist for therapeutic potential in Lambert-Eaton myasthenic syndrome. J Neurosci 33:10559–10567. 10.1523/JNEUROSCI.4629-12.2013 [DOI] [PMC free article] [PubMed] [Google Scholar]
- Treiman M, Caspersen C, Christensen SB (1998) A tool coming of age: thapsigargin as an inhibitor of sarco-endoplasmic reticulum Ca(2+)-ATPases. Trends Pharmacol Sci 19:131–135. 10.1016/S0165-6147(98)01184-5 [DOI] [PubMed] [Google Scholar]
- Trimbuch T, Rosenmund C (2016) Should I stop or should I go? The role of complexin in neurotransmitter release. Nat Rev Neurosci 17:118–125. 10.1038/nrn.2015.16 [DOI] [PubMed] [Google Scholar]
- Vaithianathan T, Zanazzi G, Henry D, Akmentin W, Matthews G (2013) Stabilization of spontaneous neurotransmitter release at ribbon synapses by ribbon-specific subtypes of complexin. J Neurosci 33:8216–8226. 10.1523/JNEUROSCI.1280-12.2013 [DOI] [PMC free article] [PubMed] [Google Scholar]
- Vaithianathan T, Henry D, Akmentin W, Matthews G (2015) Functional roles of complexin in neurotransmitter release at ribbon synapses of mouse retinal bipolar neurons. J Neurosci 35:4065–4070. 10.1523/JNEUROSCI.2703-14.2015 [DOI] [PMC free article] [PubMed] [Google Scholar]
- Vasin A, Bykhovskaia M (2017) Focal macropatch recordings of synaptic currents from the Drosophila larval neuromuscular junction. J Vis Exp 127:56493. [DOI] [PMC free article] [PubMed] [Google Scholar]
- Vasin A, Volfson D, Littleton JT, Bykhovskaia M (2016) Interaction of the complexin accessory helix with synaptobrevin regulates spontaneous fusion. Biophys J 111:1954–1964. 10.1016/j.bpj.2016.09.017 [DOI] [PMC free article] [PubMed] [Google Scholar]
- Williams C, Chen W, Lee CH, Yaeger D, Vyleta NP, Smith SM (2012) Coactivation of multiple tightly coupled calcium channels triggers spontaneous release of GABA. Nat Neurosci 15:1195–1197. 10.1038/nn.3162 [DOI] [PMC free article] [PubMed] [Google Scholar]
- Wojtowicz JM, Marin L, Atwood HL (1994) Activity-induced changes in synaptic release sites at the crayfish neuromuscular junction. J Neurosci 14:3688–3703. 10.1523/JNEUROSCI.14-06-03688.1994 [DOI] [PMC free article] [PubMed] [Google Scholar]
- Wragg RT, Snead D, Dong Y, Ramlall TF, Menon I, Bai J, Eliezer D, Dittman JS (2013) Synaptic vesicles position complexin to block spontaneous fusion. Neuron 77:323–334. 10.1016/j.neuron.2012.11.005 [DOI] [PMC free article] [PubMed] [Google Scholar]
- Xue M, Lin YQ, Pan H, Reim K, Deng H, Bellen HJ, Rosenmund C (2009) Tilting the balance between facilitatory and inhibitory functions of mammalian and Drosophila Complexins orchestrates synaptic vesicle exocytosis. Neuron 64:367–380. 10.1016/j.neuron.2009.09.043 [DOI] [PMC free article] [PubMed] [Google Scholar]
- Yang X, Cao P, Sudhof TC (2013) Deconstructing complexin function in activating and clamping Ca2+-triggered exocytosis by comparing knockout and knockdown phenotypes. Proc Natl Acad Sci USA 110:20777–20782. 10.1073/pnas.1321367110 [DOI] [PMC free article] [PubMed] [Google Scholar]
- Zador A (1998) Impact of synaptic unreliability on the information transmitted by spiking neurons. J Neurophysiol 79:1219–1229. 10.1152/jn.1998.79.3.1219 [DOI] [PubMed] [Google Scholar]
- Zdanowicz R, Kreutzberger A, Liang B, Kiessling V, Tamm LK, Cafiso DS (2017) Complexin binding to membranes and acceptor t-SNAREs explains its clamping effect on fusion. Biophys J 113:1235–1250. 10.1016/j.bpj.2017.04.002 [DOI] [PMC free article] [PubMed] [Google Scholar]
Associated Data
This section collects any data citations, data availability statements, or supplementary materials included in this article.
Supplementary Materials
Spontaneous activity at GCaMP5-expressing preparations shown in real-time.
Continuous spontaneous activity at cpx–/– GCaMP5-expressing preparations.
Spontaneous activity at Tg-treated GCaMP5-expressing preparations: enlarged events (red arrow) versus unitary event (yellow arrows).