

Abstract
Arabidopsis (Arabidopsis thaliana) UNFERTILIZED EMBRYO SAC 12 (AtUNE12) belongs to the basic helix–loop–helix DNA-binding superfamily of proteins. However, its function is not well known. Here, we found that AtUNE12 plays an important role in mediating salt tolerance. AtUNE12 is a transcriptional activator located in the nucleus whose expression is induced by NaCl, mannitol, and abscisic acid. In addition to binding to the G-box “CACGTG”, AtUNE12 also binds to the low temperature responsive element 15 (LTRE15) “CCGAC”. Furthermore, the serine residue at position 108 of AtUNE12 is phosphorylated during the salt stress response, enabling AtUNE12 to trigger gene expression by binding to G-box and/or LTRE15 motifs. Phosphorylated AtUNE12 regulates the expression of the genes involved in ion transport leading to reduced Na+ accumulation and K+ loss. At the same time, phosphorylation of AtUNE12 also induces the expression of AtMYB61 to decrease stomatal aperture, leading to a reduced transpiration rate. Overall, AtUNE12 serves as a transcriptional activator that is induced and phosphorylated upon salt stress, and the induction and phosphorylation of AtUNE12 in turn activate the salt-overly-sensitive pathway and decrease the stomatal aperture, enabling improved salt tolerance.
Salt induces the phosphorylation of UNFERTILIZED EMBRYO SAC 12, enabling it to mediate the salt-overly-sensitive pathway and stomatal aperture movement to improve salt tolerance.
Introduction
Arabidopsis (Arabidopsis thaliana) UNFERTILIZED EMBRYO SAC 12 (AtUNE12) belongs to the basic helix–loop–helix (bHLH) DNA-binding superfamily of proteins. bHLH transcription factors (TFs) are ubiquitously distributed in major eukaryotes, playing important roles in many biological processes (Heim et al., 2003). bHLH domains are characterized by two functionally distinct regions: The basic region and the HLH region. The HLH region functions as a dimerization domain, allowing the formation of homodimers or heterodimers, and comprises two amphipathic α helices separated by a variable length loop region (Ellenberger et al., 1994). The basic region includes ∼15 amino acids and typically contains six basic residues, which is usually located at the N-terminus where this basic region functions in DNA-binding (Atchley et al., 1999). The motifs bound by bHLH proteins include the E-box (“CANNTG”) motif, with the G-box (“CACGTG”) being the most common forms (Zhang et al., 2013).
Plant bHLH proteins are involved in growth, development, seed production, senescence, and abiotic and biotic stress responses. For example, MdbHLH93 promotes leaf senescence by binding to the Malus domestica SENESCENCE-ASSOCIATED GENE 18 (MdSAG18) promoter to activate its expression. In contrast, BTB AND TAZ DOMAIN PROTEIN 2 (MdBT2) ubiquitinates and degrades the MdbHLH93 protein in the absence of abscisic acid (ABA), which delays MdbHLH93-promoted leaf senescence (An et al., 2019). Two Arabidopsis bHLH TFs, PERICYCLE FACTOR TYPE-A (PFA) and PFB, initiate lateral root primordium formation by governing the competence of pericycle cells (Zhang et al., 2021). An et al. (2014) showed that enhanced expression of ABNORMAL SHOOT 5/TMO5-LIKE1 /bHLH30, together with ABS7/MYB101, could alter leaf lamina development and lead to upwardly curling leaves. Plant bHLH genes (bHLHs) also play important roles in iron homeostasis. SlbHLH068 from tomato (Solanum lycopersicum) regulates the expression of FERRIC-CHELATE REDUCTASE 1 (LeFRO1), which is involved in tomato iron homeostasis (Du et al., 2015). bHLHs have important functions in abiotic stress tolerance. For example, overexpression (OE) of a tobacco (Nicotiana tabacum) bHLH gene (NtbHLH123) conferred salt stress tolerance, while silencing of NtbHLH123 decreased salt stress tolerance. In addition, NtbHLH123 induces the expression of the RESPIRATORY BURST OXIDASE HOMOLOG (NtRbohE) and reactive oxygen species (ROS) production, suggesting that NtbHLH123 improves salt tolerance through the NtbHLH123-NtRbohE signaling pathway (Liu et al., 2021). Arabidopsis bHLH106 binds the G-box sequence and confers salt tolerance on transgenic plants. Additionally, bHLH106 regulates 198 genes positively and regulates 36 genes negatively, and many of which are abiotic stress response genes (Ahmad et al., 2015). ZmbHLH124 (termed as ZmbHLH124T-ORG) is found in drought-tolerant maize (Zea mays) lines; however, in its sensitive lines, a substitution in ZmbHLH124 (termed ZmbHLH124S-ORG) produces an early stop codon leading to sensitivity to drought. ZmbHLH124T-OR directly binds the cis-acting elements in the DEHYDRATION-RESPONSIVE ELEMENT‐BINDING FACTOR 2A (ZmDREB2A) promoter to enhance its expression, leading to drought tolerance, suggesting that ZmbHLH124T-ORG is a valuable and important genetic locus for breeding drought-tolerant maize (Wei et al., 2021). OsbHLH148 confers drought tolerance on rice (Oryza sativa) as a component of the jasmonate signaling module and can interact with JASMONATE ZIM DOMAIN 1 (OsJAZ1) to act on the initial response of jasmonate-regulated gene expression toward drought tolerance (Seo et al., 2011).
Many bHLH proteins have been identified from different plant species; for instance, 167 bHLH genes in Arabidopsis, 99 in poplar (Populus alba), and 177 in rice (Heang and Sassa, 2012). However, the biological roles of most bHLH proteins are not well known (Liu et al., 2014). Post translational modifications (PTMs) are involved in almost all biological complex processes, that is, nonlinear signal integration leading to major transcriptional reprogramming, playing critical roles in the regulation and structural stabilization of eukaryotic proteins (Minguez et al., 2013). PTMs are involved in a variety of biological functions, such as signal transduction, writers, and erasers that modulate DNA replication, and recruitment of enzymatic readers (Schwämmle et al., 2016; Lemos Duarte and Devi, 2020). Protein phosphorylation is an important PTM. In plants, regulation of TFs mediated by phosphorylation has been revealed in many signaling pathways, which is an important regulatory mechanism (Zhao et al., 2016). Additionally, TFs play central roles in gene expression regulation, and they regulate the expression of genes by binding to certain cis-acting regulatory element motifs in DNA. Therefore, it is important to study the PTMs of bHLH and the motifs recognized by bHLHs.
As a member of bHLHs, the function of AtUNE12 involved in salt stress has not been characterized. In this study, we characterized the function of AtUNE12 in response to abiotic stress. Our results indicated that AtUNE12 has phosphorylation modification. The phosphorylation of AtUNE12 is induced by salt stress and plays a crucial role in conferring salt tolerance. In addition, AtUNE12 could bind to the low temperature-responsive element 15 (LTRE15) and the G-box to regulate the expression of genes involved in the abiotic stress response. AtUNE12 aids abiotic stress tolerance by activating the salt overly sensitive (SOS) pathway and controlling stomatal apertures. This study provides insight into the functions of AtUNE12 in response to abiotic stress.
Results
Expression profiles of AtUNE12
To explore the expression patterns of AtUNE12, T3 transgenic Arabidopsis (A. thaliana) plants expressing ProUNE12:GUS (in which the promoter of AtUNE12 drives expression of the β-glucuronidase [GUS] gene) were generated, and three independent transgenic lines were generated for analysis. GUS staining indicated that AtUNE12 was expressed at each developmental stage and in all studied tissues of Arabidopsis (Figure 1A). However, the expression of AtUNE12 showed some tissue specificity. It was preferentially expressed in old leaves compared with young leaves and other tissues and showed comparatively lower expression in roots and stems (Figure 1A). Consistently, reverse transcription quantitative PCR (RT-qPCR) also confirmed that the expression of AtUNE12 was highest in old leaves, followed by that in flowers, young leaves, and roots, while the stems showed the lowest expression levels (Figure 1B).
Figure 1.

The expression pattern of AtUNE12. A, The expression levels of AtUNE12 in different tissues and developmental stages. GUS histochemical staining was performed in Arabidopsis plants harboring ProbHLH::GUS. Three independent lines were generated and had the same GUS staining results, and one line serves as a representative to be shown. (1) Seeds; (2) 3-d-old seedlings; (3) 5-d-old seedlings; (4) 7-d-old seedlings; (5) 10-d-old seedlings; (6) root tip; (7) flower; (8) silique; and (9) 21-d-old seedlings. B, RT-qPCR investigation of the expression of AtUNE12 in roots (roots), stems (stems), old leaves (O-leaves), young leaves (Y-leaves), and flowers of 28-d-old seedlings (flowers). The transcript level of ACTIN3 (AT3G53750) was used to normalize the relative expression level of AtUNE12 in each tissue. C and D, RT-qPCR determination of the expression of AtUNE12 in roots (C) and aerial parts (D) in response to salt, ABA, and osmotic stress. The relative expression level (Log2 transformed) was calculated as the gene expression under the stress condition at each time point, divided by the gene expression under the normal conditions at the corresponding time point. E and F, Analysis of the expression of AtUNE12 in response to NaCl, ABA, and mannitol using GUS staining (E) and GUS activity measurements from the three independent lines were performed (F). Arabidopsis plants harboring ProbHLH::GUS were grown in 1/2 MS medium (control), 1/2 MS medium containing 150 mM NaCl (NaCl), 30-μM ABA (ABA), or 300-mM mannitol (Mannitol) for 3 h, and GUS staining and GUS activity measurement were performed. Three independent experiments were performed, and data are means ± sd from the three experiments. Asterisk indicates significant (*P < 0.05, t test) differences from WT plants.
The expression of AtUNE12 is induced by salt, osmotic stress, and ABA stimulus
RT-qPCR analyses showed that the expression of AtUNE12 changed slightly over time under normal conditions (Figure 1, C and D). However, when exposed to NaCl, mannitol, or ABA, the expression of AtUNE12 was induced substantially in roots and the aerial parts of the plants (Figure 1, C and D). Interestingly, AtUNE12 showed roughly similar expression patterns in response to salt, osmotic, and ABA stimulus. All reached peak levels after stress for 9 h in the roots or reached a peak level at 6 or 9 h in the aerial parts. Consistently, GUS staining and GUS activity determination both revealed that AtUNE12 expression was induced in aerial parts and roots by ABA, salt, and osmotic treatment (Figure 1, E and F). These inductions of AtUNE12 expression by salt, osmotic stress and ABA stimuli suggested that AtUNE12 plays a role in abiotic stress responses.
AtUNE12 is a nuclear protein with transactivation activity
We transformed ProUNE12:UNE12-GFP (in which the promoter of AtUNE12 drives expression of an AtUNE12 and green fluorescent protein [GFP] fusion gene) into Arabidopsis plants and examined the roots of the transgenic plants for the subcellular location of AtUNE12. Arabidopsis plants expressing 35S:GFP were used as controls. The roots of 7-d-old plants were visualized using an epifluorescence microscope. Nuclear localization of GFP was detected in the ProUNE12:UNE12-GFP transformed plants, while the 35S:GFP control was uniformly distributed in root cells (Figure 2A), indicating that AtUNE12 is a nuclear-localized protein.
Figure 2.

The subcellular localization and transactivation activities of AtUNE12. A, Subcellular localization analysis of AtUNE12 in root tissues. The AtUNE12-GFP gene was expressed under the control of the AtUNE12 promoter and was transformed into Arabidopsis plants for subcellular localization analysis. Bars, 100 μm. B, Transactivation assay of the AtUNE12 protein. A diagram of the pGBKT7 constructs to express different truncated AtUNE12 proteins in yeast cells. Transactivation assay of the intact or truncated AtUNE12 proteins. Asterisk indicates the truncated proteins with transactivation activity. Fusion proteins of the GAL4 DNA-binding domain and different portions of AtUNE12 were transformed into Y2H Gold cells and grown on SD/–Trp or SD/–Trp/–His/X-α-gal plates to check their transactivation activities.
To determine whether AtUNE12 functions as a transcriptional activator, we inserted the full coding sequence (CDS) of AtUNE12 or different truncated CDSs into pGBKT7 and transformed them into yeast (Saccharomyces cerevisiae) Y2HGold cells for transactivation assays. The results showed that the pGBKT7 construct harboring the full CDS of AtUNE12 could activate the expression of reporter genes, indicating that AtUNE12 is a transcriptional activator (Figure 2B). Additionally, we noticed that the smallest truncated CDS of AtUNE12, comprised the N-terminal 20–59 amino acids (dC11), had transcriptional activity, suggesting that amino acids 20–59 represent the transcriptional activation domain.
AtUNE12 confers salt and osmotic stress tolerance to transgenic plants
To study the function of AtUNE12 using gain- and loss-of-function methods, T-DNA insertion mutant plants une1 (SALK_135301), and une2 (SALK_135303) were obtained from the Arabidopsis Biological Resource Center (ABRC). OE of AtUNE12 and a 35S:AtUNE12 construct that complemented the une1 Arabidopsis plants (Com1) were generated. RT-qPCR was performed to monitor the expression of AtUNE12 in the une1, une2, Com1, and OE lines. Compared with wild-type (WT) plants, the expression of AtUNE12 was significantly increased in OE lines, significantly decreased in une1 and une2, and showed no significant difference in Com1 plants (Supplemental Figure S1A). In addition, western blot was performed to determine the protein level of AtUNE12 in different plant lines using Anti-Flag antibody. The results showed that both OE lines had high protein levels of AtUNE12, and expression of AtUNE12 protein was also detected in Com1 (Supplemental Figure S1B), suggesting that AtUNE12 protein had been successfully expressed in these lines. Furthermore, the F1, F2, and F3 genetic screens were performed to identify single insert homozygous plants. The results showed that the separation ratios of nonresistant/resistant plants in different generations are in accord with single insert separation (Supplemental Figure S1, C and D), suggesting that these lines are single insert. These results together indicated that these plants are suitable for gain- and loss-of-function studies.
To characterize the function of AtUNE12 under abiotic stress tolerance, four types of plants with different AtUNE12 expression levels were studied: Two independent T3 homozygous transgenic plants overexpressing AtUNE12 with high (OE3) and moderate (OE7) expression levels; two mutant AtUNE12 lines (une1 and une2), which showed the lowest expression levels of AtUNE12; and WT plants and 35S:AtUNE12 complementation line (Com1) with medium expression level among the studied lines. There was no difference in seed germination and growth phenotypes among these plants under normal conditions (Figure 3, A and B). Under salt or osmotic treatment conditions, OE3 and OE7 displayed significantly improved seed germination rates compared with the WT and Com1 plants, while the une1 and une2 plants showed highly reduced germination rates (Figure 3, A and B). In addition, both OE3 and OE7 lines had significantly higher root growth and fresh weights than the WT and Com1 plants, and the une1 and une2 had significantly reduced root growth and fresh weights compared with the WT and Com1 plants under salt or osmotic treatment (Figure 3, C–E). Analysis of the growth phenotypes and fresh weights of the plants grown in soil with salt or osmotic treatment also showed that the OE lines grew much better and had higher fresh weights than the WT or Com1, and the WT or Com1 plants displayed better growth phenotypes and had higher fresh weights than the une1 and une2 plants (Figure 3, G and H). The chlorophyll contents in OE, WT, Com1, and une1, 2 were similar under normal conditions. However, under salt and osmotic stress conditions, both OE lines had the highest chlorophyll levels, followed by WT and Com1 plants, and the AtUNE12 mutant line (une1 and une2) had the lowest chlorophyll levels (Figure 3F). These results indicated that AtUNE12 confers salt and osmotic tolerance to transgenic plants, and thus plays a role in abiotic stress tolerance in Arabidopsis.
Figure 3.

Abiotic stress tolerance associated with AtUNE12. A and B, Analysis of seed germination rates. C, Growth comparison among OE, une, and WT plants. Arabidopsis plants grown on 1/2 MS medium (control) and 1/2 MS medium supplied with NaCl or mannitol for growth analysis. D–F, Analysis of root growth (D), fresh weight (E), and chlorophyll contents (F). At least 30 seedlings in each treatment were analyzed. G and H, Comparison of growth phenotype (G) and fresh weights (H) among OE, une, and WT Arabidopsis lines grown in soil. The plants were treated with NaCl or mannitol for 14 d for the analyses. Plants grown under normal conditions were used as controls. Three independent experiments were performed, and the sample sizes were shown in Supplemental Table S4. Data are means ± sd from the three experiments. Asterisk indicates significant (*P < 0.05, t test) differences from WT plants.
There was no significant difference (P > 0.05) in the electrolyte leakage rates and malondialdehyde (MDA) contents among the studied plants under normal conditions (Supplemental Figure S2). However, under salt stress conditions, the une1 and une2 lines both exhibited the highest electrolyte leakage rates, followed by the WT and Com1 plants, and then the OE lines (Supplemental Figure S2A). At the same time, the une 1 and 2 lines displayed the highest MDA content, followed by WT and Com1 plants, and then the OE lines (Supplemental Figure S2B). These results suggested that OE of AtUNE12 could reduce cell death and membrane lipid peroxidation to protect plants.
Water loss rates were substantially reduced in OE lines but increased in AtUNE12 mutant lines (une1, 2) compared with that in WT plants (Figure 4A). Correspondingly, stomatal apertures in the AtUNE12 mutant lines (une1, 2) were the largest, followed by those in the WT; the OE plants had the smallest stomatal apertures under salt or mannitol stress conditions (Figure 4, B and C). A. thaliana MYB DOMAIN PROTEIN 61 (AtMYB61) controls the stomatal aperture directly (Liang et al., 2005); therefore, we studied the expression of AtMYB61. The expression of AtMYB61 was significantly induced by AtUNE12 under salt stress (Figure 4D). AtUNE12 can bind to the promoter of AtMYB61 according to chromatin immunoprecipitation-PCR (ChIP-PCR) (Figure 4E). These results demonstrated that AtUNE12 could directly regulate the expression of AtMYB61 to control the stomatal aperture movement, leading to reduced transpiration rate.
Figure 4.

Water loss rates and stomatal aperture measurements. A, Water loss rates. B and C, Stomatal aperture changes in response to NaCl and mannitol. Bars, 10 μm. D, AtUNE12 controls the expression of AtMYB61. Plants were treated with NaCl (150 mM) or 250 mM mannitol for 48 h, and plants grown under normal conditions at the corresponding time points were used as controls. The relative expression levels were log2 transformed. E, ChIP-PCR analysis of the binding of AtUNE12 to the promoter of AtMYB61. The promoter of AtMYB61 was divided with four equal lengths for PCR. The black frame on the sketch map indicates the position of LTRE15 motif. Input: input sample; +: Samples immunoprecipitated with anti-GFP antibody; −: Samples immunoprecipitated with HA antibody (negative control). The sample sizes were shown in Supplemental Table S4. Asterisk indicates significant (*P < 0.05, t test) differences from WT plants. Three independent experiments were performed, and data are means ± sd from the three experiments.
Determination of Na+ and K+ concentrations
To test whether AtUNE12 is involved in Na+ and K+ homeostasis, we compared the Na+ and K+ contents among the WT, OE, and AtUNE12 mutant lines (une1, 2). The Na+ and K+ contents in roots, young leaves, and old leaves were similar among all the studied lines under normal conditions. Under high salt conditions, the Na+ content increased, but the K+ level decreased, in all the studied lines. However, OE lines accumulated less Na+ and more K+ in roots, young leaves, and old leaves than the WT plants; meanwhile, the une1 and une2 plants had higher Na+ and lower K+ in the roots, young leaves, and old leaves compared with those in the WT plants. Consequently, compared with the WT plants, the K+/Na+ ratio was significant higher in OE lines but lower in the une1 and une2 plants under salt stress conditions (Figure 5, A–I).
Figure 5.

Analyses of Na+ and K+ contents. A–I, Analysis of Na+ and K+ contents and the K+/Na+ ratio in different tissues of Arabidopsis. Roots, roots; Y-Leaves, young leaves; O-Leaves, old leaves. Thirty-d-old seedlings grown on 1/2 MS medium supplemented without (Control) or with 150-mM NaCl (NaCl) were used for analysis. J, CoroNa-Green staining of the root tip region, with or without NaCl treatment. Na+ concentration stained by CoroNa-Green (shown as blue fluorescence), cell death stained by PI (shown as yellow fluorescence). Bars, 100 μm. K–N, Analyses of the expression of Na+ and K+ transporting genes. Plants were treated with NaCl for 48 h, and plants grown under normal conditions were used as controls. The relative expression levels were log2 transformed. O, ChIP-PCR analysis of the bindings of AtUNE12 to the promoters of its target genes for SOS1, SOS2, SOS3 and NHX1. The promoters were divided with four equal lengths for PCR. The black and white boxes within the sketch maps of promoters respectively indicate LTRE15 and G-box motifs. Input: input sample; +: Samples immunoprecipitated with anti-GFP antibody; −: Samples immunoprecipitated with HA antibody (negative control). The sample sizes were shown in Supplemental Table S4. Asterisk indicates a significant (*P < 0.05, t test) difference compared with the WT plants. Three independent experiments were performed, and data are means ± sd from the three experiments.
CoroNa-Green combined with propidium iodide (PI) staining was conducted to study Na+ accumulation and cell damage. There was no substantial difference in Na+ concentration and cell death among OE, WT, and une lines under normal conditions. Under salt stress conditions, although cell death (yellow staining) occurred in different parts of the tip zone in une1 and une2, both mutant lines suffered substantially increased cell death compared with OE and WT plants. At the same time, the une1 and une2 lines accumulated obviously higher Na+ (blue staining) than the WT plants did, while the OE lines had substantially lower Na+ contents than WT plants (Figure 5J). Additionally, PI staining showed that the rate of cell death in the une lines was higher than that in WT plants, and the OE lines suffered lower rates of cell death than the WT plants (Figure 5J).
We then performed RT-qPCR to determine the expression of genes associated with Na+ and K+ transport, including NHX1 (encoding a sodium/hydrogen exchanger 1; AT5G27150), SOS1 (encoding salt overly sensitive 1; AT2G01980), SOS2 (AT5G35410), and SOS3 (AT5G24270). Under normal conditions, there was no significant difference in the expression of these genes among the studied lines. However, under salt stress conditions, OE of AtUNE12 significantly induced the expression of NHX1, SOS1, SOS2, and SOS3 compared to WT (Figure 5, K–N). ChIP-PCR analysis showed that AtUNE12 can bind to the promoters of SOS1, SOS2, SOS3, and NHX1 (Figure 5O), suggesting that AtUNE12 directly regulates these genes.
The potential salt tolerance genes regulated by AtUNE12
For selection of the salt tolerance genes regulated by AtUNE12, some genes potentially involved in salt tolerance were selected from Arabidopsis, including superoxide dismutase (SODs), peroxidase (PODs), and late embryogenesis abundant (LEAs). RT-qPCR results showed that these genes all can be regulated by AtUNE12, suggesting that AtUNE12 improves salt tolerance by regulation of these genes (Supplemental Figure S3).
AtUNE12 binds to G-box and LTRE15 motifs
The yeast-one-hybrid (Y1H) results showed that AtUNE12 could bind to G-box (“CACGTG”) and failed to bind to any of the mutated G-box sequences (Figure 6A), indicating that AtUNE12 binds to G-box motifs specifically. Consistently, electrophoretic mobility shift assay (EMSA) analysis showed that the observed DNA–protein complexes gradually decreased with increasing levels of the unlabeled probes (Figure 6B), indicating that AtUNE12 binds to G-box sequences.
Figure 6.

The binding of AtUNE12 to G-box or LTRE15 motifs. A, Y1H assay for AtUNE12 binding to G-boxes. B, EMSA analysis of the binding of AtUNE12 to G-boxes. C, Y1H assay for AtUNE12 binding to LTRE15 motifs. In (B) and (C), the sequences of the motifs and their mutants are shown in the right panel. Yeast transformants were spotted using serial dilutions (1/1, 1/10, 1/100, 1/1,000). D, EMSA analysis of the binding of AtUNE12 to LTRE15. In (B) and (D), labeled probe competition was performed by adding 20, 50, and 100-fold of excess unlabeled probes. The DNA-AtUNE12 complexes are indicated with arrows. E, Analysis of the binding of AtUNE12 to the LTRE15 motif using ChIP-PCR. The positions of the LTRE15 motif in promoters and the PCR amplified regions for the ChIP assay are shown. A black box indicates an LTRE15 motif, and there are no other AtUNE12 binding motifs (E-boxes) in the indicated promoter regions. Input, input sample; ChIP+: Samples immunoprecipitated with anti-GFP antibody; ChIP−: Samples immunoprecipitated with HA antibody (negative control).
To study whether AtUNE12 could bind to other motifs, we employed a special Y1H method that can identify the cis-acting elements bound by an interested TF, called TF-centered Y1H method (Ji et al., 2014a). In total, six clones were obtained by selection on the medium of SD/–His/–Leu/–Trp (without 3-AT) using TF-centered Y1H screening. These six clones were further selected with strict conditions (growing at the medium SD/–His/–Leu/–Trp supplied with 30 mM 3-AT), and two clones were obtained. After sequencing, these two clones represent the same sequence, that is, “CGCCGACC”, which contains the sequence of an LTRE15 motif (“CCGAC”), suggesting that AtUNE12 might bind to this motif. To study whether the binding of AtUNE12 to the sequence of “CGCCGACC” was caused by its binding to LTRE15, Y1H was performed. The LTRE15 sequence and its mutants were cloned into pHIS2 for the binding assay. The results showed that AtUNE12 could bind to the sequence “CCGAC”, which is the LTRE15 sequence (Busk and Pagès, 1998), and also showed low binding activity to “ACGAC”, but failed to bind to “TCGAC”, “GCGAC” and all the other mutated sequences. Therefore, AtUNE12 could bind specifically to the LTRE15 sequence (Figure 6C).
To further verify the binding of AtUNE12 to the LTRE15 motif, EMSA was performed. The results showed that the observed DNA–protein complex decreased in the presence of the competitor probe (unlabeled), indicating that AtUNE12 can bind to the LTRE15 sequence in vitro (Figure 6D).
To study whether the binding of AtUNE12 to the LTRE15 motif actually occurs in Arabidopsis, we screened the promoters of genes regulated by AtUNE12 (genes from Figure 5;Supplemental Figure S3) to select those containing “CCGAC” but lacking any form of E-box motif (“CANNTG”, which includes the G-box) in their promoter (−1500 to 0 bp relative to the transcription start site). Primers were designed to amplify the promoter regions that contain LTRE15 or regions far away from the E-box motif (as a negative control), including the promoters of four genes: AT5G35410, AT5G58390, AT5G64100, and AT1G02820. PCR was performed using ChIP+ products, using chromatin immunoprecipitated with HA antibody (ChIP−, negative control), and the input (positive control) as PCR templates, respectively. The PCR products were analyzed using agarose gel electrophoresis. The results showed that the promoter regions containing an LTRE15 sequence could be PCR amplified, but the promoter regions distant from the LTRE15 motif failed PCR amplification when using the ChIP (ChIP+) products as PCR templates. These results further confirmed that AtUNE12 could bind to the LTRE15 sequence, and the binding of AtUNE12 to LTRE15 actually occurs in Arabidopsis plants. Meanwhile, all promoter regions could be amplified using input as PCR templates (Input) but failed to amplify from the chromatin immunoprecipitated with HA antibody (ChIP−), indicating that the ChIP results were reliable (Figure 6E).
Salt stress induces the phosphorylation of the AtUNE12 protein
To determine whether AtUNE12 is phosphorylated in response to salt, the AtUNE12 protein from OE lines was immunoprecipitated using an anti-Flag antibody under salt stress conditions. The phosphorylation of AtUNE12 protein was detected using biotinylated Phos-tag. The phosphorylation level of AtUNE12 protein was increased from 1 to 2 h, and then gradually decreased after 2 h of treatment (Figure 7A). These results indicated that AtUNE12 protein was phosphorylated in response to salt stress.
Figure 7.

Analysis of the phosphorylation of AtUNE12. A, Analysis of the phosphorylation of AtUNE12 in response to salt stress. 0–6 h, the plants were treated with 150 mM NaCl for 0–6 h. AtUNE12-Flag proteins were immunoprecipitated using anti-Flag agarose beads from total proteins for analysis. B, Analysis of the phosphorylated amino acids of AtUNE12 in response to salt stress. + the AtUNE12-Flag protein from the plants treated with 150-mM NaCl for 1 h, which was used as positive control. S30A: Ser30 substituted with Ala; S57A: Ser57 substituted with Ala; S108A: Ser108 substituted with Ala; S230A: Ser230 substituted with Ala; S231A: Ser231 substituted with Ala. Anti-Flag, the proteins were detected by immunoblotting using Anti-Flag antibodies. Phos-tag, the proteins were detected by immunoblotting using biotinylated Phos-tag. Calf intestinal alkaline phosphatase-treated proteins were detected by immunoblotting using biotinylated Phos-tag as a control.
To further study the amino acid residue at which AtUNE12 protein is phosphorylated, the potential phosphorylation sites were predicted first. Five sites (Ser30, Ser57, , , and Ser231) that could potentially be phosphorylated were identified. The amino acid residues of Ser30, Ser57, Ser108, Ser230, and Ser231 were substituted separately with Ala (correspondingly named as S30A, S57A, S108A, S230A, and S231A, respectively). These mutated AtUNE12 genes were fused separately with a FLAG tag and transformed into the mutant Arabidopsis une2 (SALK_135303) for OE. These transgenic plants were treated with 150 mM NaCl for 2 h, and the mutated AtUNE12 protein was immunoprecipitated by using anti-FLAG antibody. The phosphorylation of these mutated AtUNE12 protein was analyzed using biotinylated Phos-tag. Among the five mutations, only the mutant S108A could not be detected the phosphorylation, indicating that serine only at position 108 can be phosphorylated by salt stress (Figure 7B).
To determine the function of phosphorylation of Ser108, the S108A gene was transformed into une1 and une2 plants for OE (termed as SACom1 and SACom2, respectively). Under normal conditions, all the studied lines shared similar growth phenotypes and fresh weights (Figure 8, A, B, F, and G). Under salt stress conditions, WT and Com1 had the best growth phenotypes and highest fresh weights, followed by une1 and une2, then SACom1 and SACom2 in both culture medium and soil (Figure 8, A, B, F, and G). Additionally, under salt conditions, SACom1 and SACom2 showed the highest MDA, electrolyte leakage, and ROS levels, followed by une1 and une2, and then Com1 and WT (Figure 8, C–E); whereas these physiological traits were similar among the studied lines under normal conditions (Figure 8, C–E). These results indicated that the loss of phosphorylation of Ser108 could not restore salt tolerance capability in mutant Arabidopsis une1 and 2, suggesting that phosphorylation of Ser108 is necessary for AtUNE12’s ability to confer salt tolerance.
Figure 8.

Characterization of the function of Ser108 phosphorylation. A, The growth phenotype of different kinds of Arabidopsis plants on tissue culture medium. B, Comparison of root growth. C, Comparison of electrolyte leakages. D, Comparison of MDA contents. E, Comparison of ROS levels. F, The growth phenotype of different kinds of Arabidopsis plants in soil. G, Comparison of the fresh weights among different kinds of Arabidopsis plants in soil. H, Analysis of the gene expression activation of S108A and AtUNE12 when binding to G-box and LTRE15 motifs. The activation of gene expression mediated by AtUNE12 when binding to G-box and LTRE15 motifs is triggered by salt treatment; however, gene expression activation mediated by S108A is not able to respond to salt stress. S108A, the Ser108 of AtUNE12 is muted to Ala. SACom1, 2, S108A was transformed into une1 (termed as SACom1) and une2 (termed as SACom2) plants for OE; WT Arabidopsis; Com1, AtUNE12 was transformed into une1 plants for function complementation; une1 and une2, T-DNA insertion SALK_135301 (une1) and SALK_135303 (une2). The sample sizes were shown in Supplemental Table S4. Asterisk indicates a significant (*P < 0.05, t test) difference compared with the WT plants. Three independent experiments were performed, and data are means ± sd from the three experiments.
AtUNE12 without phosphorylation of Ser108 fails to activate gene expression induced by salt stress
The AtUNE12 gene or the mutant of Ser108 to Ala (S108A) was cloned separately into pROKII under the control of the 35S promoter as effectors, and three tandem copies of the G-box or LTRE15 motifs fused with 46-bp minimal promoter of 35S were used to drive a GUS gene as a reporter. The effector, reporter, and 35S:Luc were transiently co-transformed into Arabidopsis plants. The transformed plants were then subjected NaCl treatment and the transformed plants grown under normal conditions were used as control. The ratio of GUS and Luc was calculated to determine the activation of gene expression mediated by AtUNE12 or its mutant S108A. The results showed that under normal conditions, AtUNE12 displayed low activation of gene expression; however, under NaCl stress conditions, the activation of gene expression mediated by AtUNE12 was increased strongly by binding either to the G-box or the LTRE15 motif, indicating that the activation of gene expression mediated by AtUNE12 is triggered by salt stress (Figure 8H). However, when Ser108 was mutated to Ala108, the activation of gene expression mediated by AtUNE12 was similar that with under normal condition and could not be triggered by salt treatment (Figure 8H). These results suggested that phosphorylation of Ser108 is necessary for the activation of gene expression in response to salt stress.
Discussion
Phosphorylation of Ser108 is necessary for AtUNE12 to confer salt tolerance
PTM is important for the regulation of the activity of TFs. In this study, we found that AtUNE12 is phosphorylated under salt stress and the amino acid of Ser108 is the only site for phosphorylation of AtUNE12 (Figure 7B). Further studies suggested that when Ser108 is mutated to Ala, the gene expression activation capability of AtUNE12 is wholly lost in response to salt stress (Figure 8H). This result indicated that AtUNE12 is post translationally modified, and the phosphorylation of Ser108 of AtUNE12 is necessary to trigger gene expression activation in response to salt, leading to improved salt tolerance. In addition, we observed a phenomenon that the plants (SACom1 and SACom2 lines) overexpressing S108A in une1 and une2 did not display restored salt tolerance, but showed increased salt sensitivity (Figure 8, A–G). This might be because the mutated AtUNE12 (S108A) fails to activate gene expression. At the same time, AtUNE12 (S108A) binds to the promoters of its target genes, which will interfere with the activity of other TFs or proteins that also bind to this region to activate gene expression. However, when AtUNE12 is knocked out, there is no AtUNE12 protein present in its binding region, and consequently, no interference with the activation of these genes by other TFs or proteins.
AtUNE12 binds to G-box and LTRE15 motifs
Previous studies showed that plant bHLH proteins can bind to E-box motifs, usually in the form of a G-box (“CACGTG”) (Zhang et al., 2013). However, whether they could bind to other motifs remained unknown. In this study, using a TF-centered Y1H assay, we found that AtUNE12 could bind to the LTRE15 motif, “CCGAC”. Furthermore, Y1H and EMSA tests verified that AtUNE12 could bind specifically to the LTRE15 motif (Figure 6, C and D). Moreover, ChIP-PCR showed that promoters containing an LTRE15 motif, but lacking E-box motifs, were highly enriched by AtUNE12 (Figure 6E), which further suggested that the binding of AtUNE12 to the LTRE15 sequence actually occurs in Arabidopsis plants. This result suggested that the LTRE15 motif plays a role in the AtUNE12-mediated gene expression regulatory network. G-box and LTRE15 were, respectively, screened on the upstream sequences (promoters) of Arabidopsis genes (1,000-bp upstream) using Patmatch, and the genes whose promoters contain G-box and/or LTRE15 motifs were retrieved, which are potentially regulated by AtUNE12 (Supplemental Table S1).
Importantly, we observed the following phenomena: (1) AtUNE12 is phosphorylated upon salt stress (Figure 7); (2) the expression activation of AtUNE12 when binding to both G-box and LTRE15 were increased significantly by salt stress (Figure 8H); and (3) the transcripts of AtUNE12 target genes are increased significantly under salt stress conditions compared with those under normal conditions (Figures 4 and 5). Thus, we concluded that the salt-stress-induced gene activation mediated by AtUNE12 via G-box and LTRE15 is triggered by phosphorylation of AtUNE12, which increases the expression of its target genes under salt stress conditions. This conclusion could explain the fact that the transcripts of the genes regulated by AtUNE12 were significantly increased under salt stress conditions compared with those under normal conditions (Figures 4 and 5).
AtUNE12 mediates salt stress tolerance via the SOS pathway
In plants, the SOS pathway is important to maintain ion homeostasis under salt stress, and comprises SOS3, SOS2, and SOS1 components (Lou et al., 2020). The Arabidopsis SOS1 is essential for K+ and Na+ homeostasis (Shi et al., 2000), which is found to improve salt tolerance by limiting Na+ accumulation in plant cells (Shi et al., 2003). SOS1 plays a role in retrieving Na+ from the xylem stream when exposed to severe salt stress; however, it may function in loading Na+ into the xylem under mild salt stress conditions (Shi et al., 2002). OE of SOS1 conferred significant salt tolerance in transgenic plants (Yadav et al., 2012; Feki et al., 2014; Katschnig et al., 2015). The Arabidopsis SOS2 and SOS3 genes play roles in intracellular K+ and Na+ homeostasis, and are important for plant tolerance under high Na+ and low K+ stress (Halfter et al., 2000). The activity of SOS1 is regulated by SOS2 (a protein kinase) and SOS3 (a calcium-binding protein) (Brindha et al., 2021). Our results showed that AtUNE12 induced the expression of SOS3, SOS2, and SOS1 markedly (Figure 5), indicating that AtUNE12 could activate the SOS pathway. Meanwhile, both Na+ measurement and CoroNa-Green staining showed that OE of AtUNE12 could reduce Na+ accumulation (Figure 5, A–C and J), indicating that the reduced Na+ level probably results from activation of the SOS pathway. Therefore, AtUNE12 activates the SOS pathway to reduce the accumulation of Na+, which leads to improved salt stress tolerance.
AtUNE12 controls stomatal aperture
In plants, stomata mediate transpiration water loss and CO2 influx from the atmosphere (Kim et al., 2010). Transpiration occurs through the stomatal apertures, accounting for most of the water loss by a plant. Therefore, control of the stomatal aperture is important for plant stress tolerance. Our results showed that the transcript abundance of AtUNE12 corresponds negatively with the water transpiration rate (Figure 4A), suggesting that AtUNE12 plays a positive role in controlling water transpiration. This prompted us to study whether AtUNE12 could control the stomatal aperture. Further experiments confirmed that AtUNE12 controls the stomatal aperture to reduce water transpiration (Figure 4, B and C). In addition, because AtMYB61 directly controls the stomatal aperture (Liang et al., 2005), we further studied whether AtUNE12 could regulate the expression of AtMYB61. RT-qPCR and ChIP-qPCR showed that AtUNE12 could bind to the promoter of AtMYB61 to induce its expression (Figure 4, D and E). These results suggested that AtUNE12 activates the expression of AtMYB61, and the induced AtMYB61 reduces stomatal apertures, resulting in decreased transpiration, which enhances stress tolerance.
Based on the above results, we proposed a working model for AtUNE12’s involvement in abiotic stress tolerance (Figure 9). Abiotic stress, such as salt stress, induces the expression of AtUNE12, and also phosphorylation of AtUNE12 at Ser108. The phosphorylation of AtUNE12 triggers the activation of gene expression, mediated by AtUNE12 binding to the LTRE15 and/or G-box to regulate genes involved in the SOS pathway (SOS1, SOS2, and SOS3), stomatal aperture movement (AtMYB61), and other stress tolerance genes. The increased expression levels of these genes activate their associated physiological pathways, resulting in reduced Na+ accumulation, decreased K+ loss, and a decreased transpiration rate, all of which contribute to improving salt tolerance.
Figure 9.
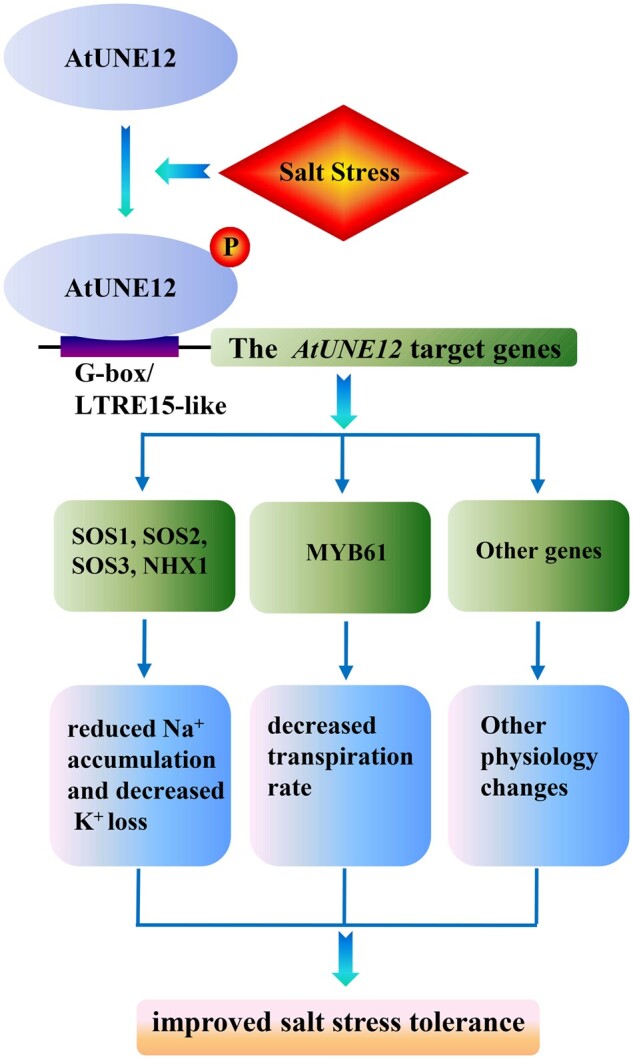
A working model showing how AtUNE12 increases salt and drought tolerance. Salt stress induces the expression and phosphorylation at Ser108 of AtUNE12, which then binds to LTRE15 and/or G-box motifs in promoter regions of other genes, such as SOS1, SOS2, SOS3, NHX1, and AtMYB61, to induce their expression. These induced genes activate their associated physiological processes, resulting in reduced Na+ accumulation and decreased K+ loss, a decreased transpiration rate, and decreased cell death and MDA levels, all of which contribute to improving abiotic stress tolerance.
Materials and methods
Plant growth and treatments
Arabidopsis (A. thaliana) Columbia (WT) plants were used in this study. Seeds of Arabidopsis were seeded into pots containing a mixture of perlite/soil (2:1 v/v) in a greenhouse (70%–75% relative humidity; 16-h light/8-h darkness photocycle; 22°C). Four-week-old plants were watered with a solution of 200-mM NaCl, 375-mM mannitol, or 100-μM ABA, and the tissues were collected at 3, 6, 9, 12, 24, and 48-h post watering; seedlings watered with fresh water were harvested at the corresponding time points as controls. Three biological replicates were performed. The T-DNA insertion Arabidopsis UNFERTILIZED EMBRYO SAC 12 (AtUNE12) mutant (SALK_135301 and SALK_135303) plants were obtained from the ABRC.
Vector constructions and plant transformation
A 1,459-bp region of genomic DNA containing the promoter and full-length 5′-untranslated region of AtUNE12 (AT4G02590.1) replaced the 35S promoter to drive the GUS gene (ProUNE12:GUS). The CDS of AtUNE12, without the termination codon, was fused to the N-terminus of the GFP controlled by AtUNE12 promoter to generate the ProUNE12:UNE12-GFP construct; the GFP gene under the control of the 35S promoter (35S:GFP) was also generated. The fusion gene of AtUNE12-GFP was cloned into pROKII under the control of the 35S promoter to generate the 35S:UNE12-GFP construct. The CDS of AtUNE12 was cloned into pROKII under the control of the 35S promoter to overexpress AtUNE12 (35S:AtUNE12-Flag), which was designed to contain three-section repeated sequences of Flag tags. The CDS of AtUNE12 was cloned into pROKII under the control of the 35S promoter for overexpressing AtUNE12 (35S:AtUNE12), which was used to obtain complemented une1 Arabidopsis plants. All the primers used are shown in Supplemental Table S2. Stably transformed Arabidopsis plants were generated using the floral dip method (Clough and Bent, 1998). T3 generation plants were used in subsequent experiments.
GUS assay and epifluorescence observation
GUS activity and GUS staining were performed as described by Jefferson et al. (1987) and Jefferson (1989), respectively. Three biological replicates were performed. For subcellular analysis, roots of transgenic Arabidopsis plants were visualized using an epifluorescence microscope (Axio Imager. A1; Carl Zeiss MicroImaging, Jena, Germany) with the settings: excitation laser of 488 nm and emission of 516 nm; signal intensity number of 2; pixel depth of 8 bits; detector gain of 500.
Analysis of transactivation of AtUNE12
Intact or various truncated CDSs of AtUNE12 were fused in-frame with the yeast GAL4 DNA-binding domain separately in the pGBKT7 vector (Clontech, Mountain View, CA, USA) and transformed into yeast Y2H Gold cells (Supplemental Table S3). The transformed cells were grown on SD/–Trp/–His/X-α-gal plates to examine their growth and β-galactosidase activity according to the manufacturer's instructions (Matchmaker Gold Yeast Two-Hybrid System, Clontech).
Stress tolerance analysis
Arabidopsis seeds were sown on 1/2 MS medium, 1/2 MS containing 125-mM NaCl or 175-mM mannitol for 1 week, and the germination rates were measured. The seeds were sown on 1/2 MS medium for 3 d, and then transferred into 1/2 MS medium, 1/2 MS medium plus 130-mM NaCl, or 175-mM mannitol for 10 d. The root length and fresh weight were measured. For stress tolerance in soil, seeds were sown on 1/2 MS solid medium for 7 d, and then transferred into soil. After 3 weeks of growth, seedlings were watered with a solution of 200-mM NaCl or 375-mM mannitol for 14 d and then imaged; the fresh weights were measured. The chlorophyll contents of detached leaves were measured according to the method of Lichtenthaler and Buschmann (1987). Three biological replicates were performed. The sample sizes in the experiments were shown in Supplemental Table S4.
Physiological analysis
Three-week-old Arabidopsis plants grown in soil were watered with a solution of 150-mM NaCl or 200-mM mannitol for 48 h, and then harvested for physiological analysis. The MDA level was measured as described by Wang et al. (2010). Electrolyte leakage was performed following the method Ji et al. (2014b), and H2O2 levels were measured according to the method of Dal Santo et al. (2012). The proline content was measured according to the method of Bates et al. (1973). For biological staining, the seedlings were incubated in solution of NaCl (150 mM) or mannitol (200 mM) for 0.5 and 1.5 h, and nitroblue tetrazolium and diaminobenzidine staining of the detached leaves were performed according to the methods of Fryer et al. (2002) and Zhang et al. (2011). For Na+ and K+ content determination, 1-week-old Arabidopsis seedlings were transferred to 1/2 MS medium (control) or 1/2 MS containing 150 mM NaCl grown for 5 d. Roots, young leaves, and old leaves were collected separately, washed three times with distilled water, and were dried in an oven at 80°C for 48 h for weighing. Each sample was dissolved in 5 mL of acetic acid (100 mM) at 90°C for 2 h, diluted to 25 mL with distilled water, and the Na+ and K+ contents were measured using an Atomic Absorption Spectrometer Analyst 800 (PerkinElmer, Waltham, MA, USA). The sample sizes in the experiments were shown in Supplemental Table S4.
Visualization of intracellular Na+ distributions
One-week-old seedlings grown on 1/2 MS medium were transferred to fresh medium containing with 0 mM (control) or 150-mM NaCl for 72 h. Then, the roots were washed three times with distilled water and stained with 10-μM CoroNa-Green AM (Invitrogen, Waltham, MA, USA) in the presence of a final concentration of 0.02% (v/v) pluronic acid for 3 h. The roots were then incubated with PI solution (50-μg mL−1) for 30 min and rinsed with distilled water. The intracellular Na+ fluorescence was visualized using a confocal laser scanning microscopy LSM700 microscope (Zeiss) with the settings: excitation laser of 488 nm and emission of 516 nm; signal intensity number of 2; pixel depth of 8 bits; detector gain of 500.
Stomatal aperture assays
The stomatal apertures of leaves were measured as previously described, with minor modifications (Hwang et al., 1997). To induce stomatal opening, rosette leaves from 3-week-old plants were harvested in the dark at the end of the night and then floated in a solution of 3 mM MES (pH 6.15) containing 50-mM KCl (MES-KCl) for 2 h under light at 25°C. The leaves were then transferred to MES-KCl buffer containing 150-mM NaCl or 200-mM mannitol for 3 h. Stomatal cells were observed using a light microscope (Axio Observer Z.1; Zeiss). Stomatal apertures were measured (pore width/length) using Interactive Measurement software (AxioVision 3.0.6; Zeiss).
Analysis of the binding of AtUNE12 to the G-box motif
Three tandem copies of the G-box (CACGTG), together with its mutants GM1–7, were each cloned into pHIS2 (Clontech) as reporter vectors (Supplemental Table S5). The CDS of AtUNE12 without its termination codon was cloned into pGADT7-Rec2 (Clontech) as an effector (pGADT7-AtUNE12). Y1H was performed according to Clontech protocol (BD Matchmaker Library Construction and Screening Kits User Manual).
TF-centered Y1H assay
To study whether AtUNE12 could bind to other motifs besides the G-box, TF-centered Y1H was performed according to the method of Ji et al. (2014a). AtUNE12 was cloned into pGADT7-Rec2 (pGADT7-AtUNE12) to screen against a random DNA insertion library using Y1H. The positive clones were further screened on high stringency selective medium. After further selection, the positive clones were sequenced, and the sequences were analyzed using PLACE (http://www.dna.affrc.go.jp/PLACE/) for motif prediction. To confirm the motif bound by AtUNE12, three tandem copies of the motif or its mutated sequences were cloned into pHIS2, and their interaction with AtUNE12 was assessed using Y1H.
EMSA
The CDS of AtUNE12 was cloned into vector pMAL-c5X vector (NEB, Ipswich, MA, USA) to fuse with the maltose-binding protein (AtUNE12-MBP). After transformation into Escherichia coli cells, the fusion gene was induced using 0.3-mM isopropyl β-d-1-thiogalactopyranoside at 37°C for 5 h. The AtUNE12-MBP fusion protein was purified according to the instruction manual of the pMAL Protein Fusion & Purification System (NEB). The forward and reverse strand DNA sequences containing the LTRE15 sequences were, respectively, labeled with biotin at the 3′-terminus (Sangon, Shanghai, China), and were annealed to form double stranded molecules as probes; the same unlabeled probe was used as the competitor. The probes and AtUNE12 protein were incubated at room temperature for 6 h, run on a polyacrylamide gel electrophoresis (PAGE) gel, and the complex of DNA and protein was detected using a Chemiluminescent EMSA kit (Beyotime, Haimen, China). The primers used are shown in Supplemental Table S6.
Western blotting analysis
For western blotting analysis, the proteins were separate proteins using 12% (w/v) sodium dodecyl sulphate–polyacrylamide gel electrophoresis (SDS-PAGE). The separated proteins were then shifted to polyvinylidene difluoride membranes (Millipore, Massachusetts, USA), blocked in 5% skim milk, and hatched in anti-Flag antibody (Beyotime, Shanghai, China). After at 4°C overnight, horseradish peroxidase (HRP)-conjugated secondary antibodies and enhanced chemiluminescence (ECL) solution (Beyotime) were added, and the membranes were visualized.
ChIP analysis
ChIP experiments were conducted following the method of Haring et al. (2007) with minor modifications. Briefly, proteins and DNA were cross-linked using formaldehyde (3%). The purified cross-linked nuclei were sonicated to shear the chromatin into 0.2- to 0.7-kb fragments and divided into two portions. One portion was incubated with Anti-FLAG antibody (ChIP+), and the other was incubated with a rabbit anti-haemagglutinin antibody as a negative control (ChIP−). Chromatin prior to immunoprecipitation (IP) was used as an input control. All the primers used for PCR are shown in Supplemental Table S7.
Analysis of AtUNE12 phosphorylation
Transgenic Arabidopsis plants overexpressing AtUNE12 were grown in soil, watered with a solution of 150-mM NaCl for 0, 1, 2, 3, 4, and 6 h, and harvested for IP. Total proteins from each sample were isolated using IP buffer (1× phosphate-buffered saline + 1× protease inhibitor + 1× phosphatase inhibitor + 1% Triton X-100), and AtUNE12 was immunoprecipitated using anti-Flag monoclonal antibody (mAb) agarose (Sigma-Aldrich, St Louis, MO, USA). Phosphorylated AtUNE12 proteins were subjected to SDS-PAGE and detected using immunoblotting with Phos-tag Biotin BTL-105 (WAKO Chemicals, Richmond, VA, USA). Phosphorylated proteins that bound specifically to Phos-tag Biotin were detected by the reaction between the ECL substrate and horseradish POD as ECL signals. As a negative control, calf intestinal alkaline phosphatase was used to dephosphorylate AtUNE12 protein. The phosphorylation site was predicted using the PhosphoSitePlus (https://www.phosphosite.org/siteSearchAction) and SCANSITE version 4.0 (https://scansite4.mit.edu/4.0).
Determination of the phosphorylation site of AtUNE12
The possible phosphorylation sites of AtUNE12 were predicted using PhosphoSitePlus (https://www.phosphosite.org/siteSearchAction) and SCANSITE version 4.0 (https://scansite4.mit.edu/4.0). Five potential phosphorylation sites (Ser30, Ser57, Ser108, Ser230, and Ser231) were mutated separately by substitution with Ala, and the mutated genes were fused separately with a FLAG tag sequence and transformed into Arabidopsis for OE. These transgenic plants were treated with 150-mM NaCl for 2 h, and the mutated AtUNE12 proteins were immunoprecipitated using anti-Flag mAb agarose (Sigma-Aldrich, St Louis, Missouri, USA). AtUNE12-Flag or its mutated proteins then were separated using 10% SDS–PAGE. Phosphorylated proteins were determined by immunoblotting using Phos-tag BTL-105.
Analysis of the bindings of AtUNE12 or its mutant to motifs
Three tandem copies of the G-box or LTRE15 sequence were fused with the 46-bp minimal 35S promoter, respectively, to drive a GUS gene in a reformed pCAMBIA1301 vector (in which the region of 35S::Hygromycin was deleted and a 46-bp minimal promoter was inserted between Hind III and GUS) as reporters (Supplemental Table S8). The CDS of AtUNE12 or its mutant (S108A) was cloned into pROKII under the control of 35S promoter as effectors. Each reporter and effector (35S:AtUNE12) were co-transformed into Arabidopsis using a transient transformation method (Ji et al., 2014b). At 2 d after transformation, the transformed plants were treated with 150-mM NaCl or normal conditions for 3 h, and then subjected to GUS activity determination. To normalize the efficiencies of transformation, the luciferase (Luc) gene under the control of the 35S promoter (35S::Luc) was also co-transformed. Three independent biological repeats were performed. To determination of the genes potentially regulated by AtUNE12, G-box and LTRE15 sequence were, respectively, screened on the promoters of Arabidopsis genes in the database of Arapot11 Loci Upstream Seq1,000-bp (DNA) using Patmath (https://www.arabidopsis.org/cgi-bin/patmatch/nph-patmatch.pl).
RT-qPCR
For RT-qPCR, the reaction mixture contained 10 μL of SYBR Green Real-time PCR Master Mix (Toyobo, Osaka, Japan), 0.5 μM of each primer, and 2 μL of template cDNA in a volume of 20 μL. PCR procedure was conducted as the follows: 94°C for 30 s; followed by 45 cycles of 94°C for 12 s, 58°C for 30 s, and 72°C for 45 s; and 1 s at 81°C for plate reading with an Opticon 2 System (Bio-Rad, Hercules, CA, USA). Relative expression levels were calculated using the 2−ΔΔCt method (Livak and Schmittgen, 2001). The DNA sequence of ACTIN3 (AT3G53750) was used as an internal reference. For gel electrophoresis assay, PCR was performed as follows: 95°C for 2 min; 30 cycles of 94°C for 30 s, 58°C for 30 s, and 72°C for 40 s; and 72°C for 10 min. All the primers used are shown in Supplemental Table S9.
Statistical analyses
Statistical analyses were carried out using SPSS version16.0 (IBM Corp., Armonk, NY, USA) software. Data were compared using Student’s t test. Differences were considered significantly (*P < 0.05).
Accession numbers
Sequence data from this article can be found in the GenBank/EMBL data libraries under accession numbers shown in Supplemental Table S10.
Supplemental data
The following materials are available in the online version of this article.
Supplemental Figure S1. Characterization of the transcript and protein expression of AtUNE12 and the insertion of AtUNE12.
Supplemental Figure S2. Detection of cell death and the MDA level.
Supplemental Figure S3. Determination of the potential genes regulated by AtUNE12.
Supplemental Table S1. The promoter regions of genes containing G-box and LTRE15 motifs.
Supplemental Table S2. The primers used for vector construction.
Supplemental Table S3. The primers used for constructing the pGBKT7 vectors.
Supplemental Table S4. The sample sizes in the experiments.
Supplemental Table S5. The primers used in the yeast one-hybrid analyses.
Supplemental Table S6. The primers used for EMSA analysis.
Supplemental Table S7. The primers used for ChIP-PCR.
Supplemental Table S8. The primers used for constructing the reporter and effector vectors.
Supplemental Table S9. The primers used for RT-qPCR.
Supplemental Table S10. The GenBank accession numbers of sequence data from this article.
Funding
This work was supported by the Joint Funds of the National Natural Science Foundation of China (No. U1703233), and Heilongjiang Touyan Innovation Team Program (Tree Genetics and Breeding Innovation Team).
Conflict of interest statement. The authors declared that they have no conflicts of interest to this work.
Supplementary Material
Z.H., Z.W., X.N., and X.J. performed the experiments. Y.W. and X.J. conceived and designed the research. Z.H., Z.W., X.N., X.J., M.Q., and H.Z. analyzed the data. Y.W. and X.J. supervised the work. Y.W., X.J., Z.H., and Z.W. wrote the article and Y.W. contributed and supervised the final article version. Y.W. agrees to serve as the author responsible for contact and ensures communication.
The author responsible for distribution of materials integral to the findings presented in this article in accordance with the policy described in the Instructions for Authors (https://academic.oup.com/plphys/pages/general-instructions) is Yucheng Wang (wangyucheng@ms.xjb.ac.cn).
References
- Ahmad A, Niwa Y, Goto S, Ogawa T, Shimizu M, Suzuki A, Kobayashi K, Kobayashi H (2015) BHLH106 integrates functions of multiple genes through their G-box to confer salt tolerance on Arabidopsis. PLoS One 10: e0126872. [DOI] [PMC free article] [PubMed] [Google Scholar]
- An JP, Zhang XW, Bi SQ, You CX, Wang XF, Hao YJ (2019) MdbHLH93, an apple activator regulating leaf senescence, is regulated by ABA and MdBT2 in antagonistic ways. New Phytol 222: 735–751 [DOI] [PubMed] [Google Scholar]
- An R, Liu X, Wang R, Wu H, Liang S, Shao J, Qi Y, An L, Yu F (2014) The over-expression of two transcription factors, ABS5/bHLH30 and ABS7/MYB101, leads to upwardly curly leaves. PLoS One 9: e107637. [DOI] [PMC free article] [PubMed] [Google Scholar]
- Atchley WR, Terhalle W, Dress A (1999) Positional dependence, cliques, and predictive motifs in the bHLH protein domain. J Mol Evol 48: 501–516 [DOI] [PubMed] [Google Scholar]
- Bates LS, Waldren RO, Teare ID (1973) Rapid determination of free proline for water stress studies. Plant Soil 39: 205–207 [Google Scholar]
- Brindha C, Vasantha S, Raja AK, Tayade AS (2021) Characterization of the Salt Overly Sensitive pathway genes in sugarcane under salinity stress. Physiol Plant 171: 677–687 [DOI] [PubMed] [Google Scholar]
- Busk PK, Pagès M (1998) Regulation of abscisic acid-induced transcription. Plant Mol Biol 37: 425–435 [DOI] [PubMed] [Google Scholar]
- Clough SJ, Bent AF (1998) Floral dip: a simplified method for Agrobacterium-mediated transformation of Arabidopsis thaliana. Plant J 16: 735–743 [DOI] [PubMed] [Google Scholar]
- Dal Santo S, Stampfl H, Krasensky J, Kempa S, Gibon Y, Petutschnig E, Rozhon W, Heuck A, Clausen T, Jonak C (2012) Stress-induced GSK3 regulates the redox stress response by phosphorylating glucose-6-phosphate dehydrogenase in Arabidopsis. Plant Cell 24: 3380–3392 [DOI] [PMC free article] [PubMed] [Google Scholar]
- Du J, Huang Z, Wang B, Sun H, Chen C, Ling HQ, Wu H (2015) SlbHLH068 interacts with FER to regulate the iron-deficiency response in tomato. Ann Bot 116: 23–34 [DOI] [PMC free article] [PubMed] [Google Scholar]
- Ellenberger T, Fass D, Arnaud M, Harrison SC (1994) Crystal structure of transcription factor E47: E-box recognition by a basic region helix-loop-helix dimer. Genes Dev 8: 970–980 [DOI] [PubMed] [Google Scholar]
- Feki K, Quintero FJ, Khoudi H, Leidi EO, Masmoudi K, Pardo JM, Brini F (2014) A constitutively active form of a durum wheat Na+/H+ antiporter SOS1 confers high salt tolerance to transgenic Arabidopsis. Plant Cell Rep 33: 277–288 [DOI] [PubMed] [Google Scholar]
- Fryer MJ, Oxborough K, Mullineaux PM, Baker NR. (2002) Imaging of photo-oxidative stress responses in leaves. J Exp Bot 53: 1249–1254 [PubMed] [Google Scholar]
- Halfter U, Ishitani M, Zhu JK (2000) The Arabidopsis SOS2 protein kinase physically interacts with and is activated by the calcium-binding protein SOS3. Proc Natl Acad Sci USA 97: 3735–37 [DOI] [PMC free article] [PubMed] [Google Scholar]
- Haring M, Offermann S, Danker T, Horst I, Peterhansel C, Stam M (2007) Chromatin immunoprecipitation: optimization, quantitative analysis and data normalization. Plant Methods 3: 11. [DOI] [PMC free article] [PubMed] [Google Scholar]
- Heang D, Sassa H. (2012). Antagonistic actions of HLH/bHLH proteins are involved in grain length and weight in rice. PLoS One 7: e31325. [DOI] [PMC free article] [PubMed] [Google Scholar]
- Heim MA, Jakoby M, Werber M, Martin C, Weisshaar B, Bailey PC (2003) The basic helix-loop-helix transcription factor family in plants: a genome-wide study of protein structure and functional diversity. Mol Biol Evol 20: 735–7 [DOI] [PubMed] [Google Scholar]
- Hwang JU, Suh S, Yi H, Kim J, Lee Y (1997) Actin filaments modulate both stomatal opening and inward K+-channel activities in guard cells of Vicia faba L. Plant Physiol 115: 335–342 [DOI] [PMC free article] [PubMed] [Google Scholar]
- Jefferson RA, Kavanagh TA, Bevan MW (1987) GUS fusions: betaglucuronidase as a sensitive and versatile gene fusion marker in higher plants. EMBO J 6: 3901–3907 [DOI] [PMC free article] [PubMed] [Google Scholar]
- Jefferson RA (1989) The GUS reporter gene system. Nature 342: 837–838 [DOI] [PubMed] [Google Scholar]
- Ji XY, Zheng L, Liu YJ, Nie XG, Liu SN, Wang YC (2014b) A transient transformation system for the functional characterization of genes involved in stress response. Plant Mol Biol Rep 32: 732–739 [Google Scholar]
- Ji XY, Wang LQ, Nie XG, He L, Zang DD, Liu YJ, Zhang B, Wang YC (2014a) A novel method to identify the DNA motifs recognized by a defined transcription factor. Plant Mol Biol 86: 367–380 [DOI] [PubMed] [Google Scholar]
- Katschnig D, Bliek T, Rozema J, Schat H (2015) Constitutive high-level SOS1 expression and absence of HKT1;1 expression in the salt-accumulating halophyte Salicornia dolichostachya. Plant Sci 234: 144–154 [DOI] [PubMed] [Google Scholar]
- Kim TH, Böhmer M, Hu H, Nishimura N, Schroeder JI (2010) Guard cell signal transduction network: advances in understanding abscisic acid, CO2 and Ca2+ signaling. Annu Rev Plant Biol 61: 561–591 [DOI] [PMC free article] [PubMed] [Google Scholar]
- Lemos Duarte M, Devi LA (2020) Post-translational modifications of opioid receptors. Trends Neurosci 43: 417–432 [DOI] [PMC free article] [PubMed] [Google Scholar]
- Liang YK, Dubos C, Dodd IC, Holroyd GH, Hetherington AM, Campbell MM (2005) AtMYB61, an R2R3-MYB transcription factor controlling stomatal aperture in Arabidopsis thaliana. Curr Biol 15: 1201–1206 [DOI] [PubMed] [Google Scholar]
- Lichtenthaler HK, Buschmann C (1987) Chlorophyll fluorescence spectra of green bean leaves. J Plant Physiol 129: 137–147 [Google Scholar]
- Liu D, Li YY, Zhou ZC, Xiang X, Liu X, Wang J, Hu ZR, Xiang SP, Li W, Xiao QZ, et al. (2021) Tobacco transcription factor bHLH123 improves salt tolerance by activating NADPH oxidase NtRbohE expression. Plant Physiol 186: 1706–1720 [DOI] [PMC free article] [PubMed] [Google Scholar]
- Liu W, Tai H, Li S, Gao W, Zhao M, Xie C, Li WX (2014) BHLH122 is important for drought and osmotic stress resistance in Arabidopsis and in the repression of ABA catabolism. New Phytol 201: 1192–1204 [DOI] [PubMed] [Google Scholar]
- Livak KJ, Schmittgen TD (2001) Analysis of relative gene expression data using real-time quantitative PCR and the 2(-Delta Delta C(T)) Method. Methods 25: 402–408 [DOI] [PubMed] [Google Scholar]
- Lou L, Yu F, Tian M, Liu G, Wu Y, Wu Y, Xia R, Pardo JM, Guo Y, Xie Q (2020) ESCRT-I component VPS23A sustains salt tolerance by strengthening the SOS module in Arabidopsis. Mol Plant 13: 1134–1148 [DOI] [PubMed] [Google Scholar]
- Minguez P, Letunic I, Parca L, Bork P (2013) PTMcode: a database of known and predicted functional associations between post-translational modifications in proteins. Nucleic Acids Res 41: D306–D311 [DOI] [PMC free article] [PubMed] [Google Scholar]
- Schwämmle V, Sidoli S, Ruminowicz C, Wu X, Lee CF, Helin K, Jensen ON (2016) Systems level analysis of histone H3 post-translational modifications (PTMs) reveals features of PTM crosstalk in chromatin regulation. Mol Cell Proteomics 15: 2715–2729 [DOI] [PMC free article] [PubMed] [Google Scholar]
- Seo JS, Joo J, Kim MJ, Kim YK, Nahm BH, Song SI, Cheong JJ, Lee JS, Kim JK, Choi YD (2011) OsbHLH148, a basic helix-loop-helix protein, interacts with OsJAZ proteins in a jasmonate signaling pathway leading to drought tolerance in rice. Plant J 65: 907–921 [DOI] [PubMed] [Google Scholar]
- Shi H, Ishitani M, Kim C, Zhu JK (2000) The Arabidopsis thaliana salt tolerance gene SOS1 encodes a putative Na+/H+ antiporter. Proc Natl Acad Sci USA 97: 6896–6 [DOI] [PMC free article] [PubMed] [Google Scholar]
- Shi H, Lee BH, Wu SJ, Zhu JK (2003) Overexpression of a plasma membrane Na+/H+ antiporter gene improves salt tolerance in Arabidopsis thaliana. Nat Biotechnol 21: 81–8 [DOI] [PubMed] [Google Scholar]
- Shi H, Quintero FJ, Pardo JM, Zhu JK (2002) The putative plasma membrane Na(+)/H(+) antiporter SOS1 controls long-distance Na(+) transport in plants. Plant Cell 14: 465–4 [DOI] [PMC free article] [PubMed] [Google Scholar]
- Wang Y, Gao C, Liang Y, Wang C, Yang C, Liu G (2010) A novel bZIP gene from Tamarix hispida mediates physiological responses to salt stress in tobacco plants. J Plant Physiol 167: 222–230 [DOI] [PubMed] [Google Scholar]
- Wei S, Xia R, Chen C, Shang X, Ge F, Wei H, Chen H, Wu Y, Xie Q (2021) ZmbHLH124 identified in maize recombinant inbred lines contributes to drought tolerance in crops. Plant Biotechnol J 19: 2069–2081 [DOI] [PMC free article] [PubMed] [Google Scholar]
- Yadav NS, Shukla PS, Jha A, Agarwal PK, Jha B (2012) The SbSOS1 gene from the extreme halophyte Salicornia brachiata enhances Na+ loading in xylem and confers salt tolerance in transgenic tobacco. BMC Plant Biol 12: 188. [DOI] [PMC free article] [PubMed] [Google Scholar]
- Zhang X, Wang L, Meng H, Wen H, Fan Y, Zhao J (2011) Maize ABP9 enhances tolerance to multiple stresses in transgenic Arabidopsis by modulating ABA signaling and cellular levels of reactive oxygen species. Plant Mol Biol 75: 365–378 [DOI] [PMC free article] [PubMed] [Google Scholar]
- Zhang Y, Mayba O, Pfeiffer A, Shi H, Tepperman JM, Speed TP, Quail PH (2013) A quartet of PIF bHLH factors provides a transcriptionally centered signaling hub that regulates seedling morphogenesis through differential expression-patterning of shared target genes in Arabidopsis. PLoS Genet 9: e1003244. [DOI] [PMC free article] [PubMed] [Google Scholar]
- Zhang Y, Mitsuda N, Yoshizumi T, Horii Y, Oshima Y, Ohme-Takagi M, Matsui M, Kakimoto T (2021) Two types of bHLH transcription factor determine the competence of the pericycle for lateral root initiation. Nat Plants 7: 633–643 [DOI] [PubMed] [Google Scholar]
- Zhao S, Zhang ML, Ma TL, Wang Y (2016) Phosphorylation of ARF2 relieves its repression of transcription of the K+ transporter gene HAK5 in response to low potassium stress. Plant Cell 28: 3005–3019 [DOI] [PMC free article] [PubMed] [Google Scholar]
Associated Data
This section collects any data citations, data availability statements, or supplementary materials included in this article.