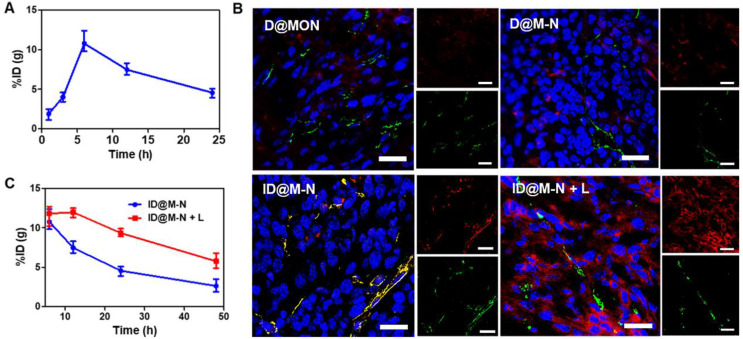
Figure 4.
In vivo tumor penetration. (A) Accumulation of ID@M-N at tumor site. (B) The tumor slice visualized tumor penetration of ID@M-N by CLSM imaging. Blue: nucleus; red: ID@M-N; green: blood vessels stained with anti-CD31-FITC; scale bars: 25 µm. (C) Accumulation of ID@M-N at tumor 6 h post-injection.

