Abstract
Background
Mortality is a critical measure of disease impact. The European Union (EU) countries share the same regulatory framework but different implementation policies.
Methods
We extracted cumulative COVID-19 mortality data across the EU countries. We evaluated the 27 member states using the location quotient (LQ) to adjust for the expected mortality in the whole EU region, where an LQ <1 signifies a more and an LQ >1 a less favorable outcome. We categorized EU members into 3 distinct profiles based on their LQ estimates: favorable profile, LQ ≤0.9; unfavorable profile, LQ >1.10; and average profile, LQ between 0.9 and 1.10. We compared LQ estimates and profiles with the prevaccination era that ended in December 2020 with the COVID-19 vaccine rollout.
Results
Twelve member states had a favorable profile, 4 had an average profile, and 11 had an unfavorable profile. In quantitative analysis, an improvement (negative LQ difference) was noted across countries with higher vaccination coverage (median, 71% fully vaccinated vs 57% for countries with positive LQ differences). There was a significant negative association between the share of fully vaccinated and LQ changes (ρ = –0.62, P < .001) and a significant 4-month lag effect. After COVID-19 vaccines became available, 4 countries improved their profile and 5 moved to a worse profile.
Conclusions
There is significant variability in mortality and impact of COVID-19 between countries, even if they share the same regulatory framework. Extending immunization coverage may lead the transition to a more favorable profile, and alter the trajectory of COVID-19 mortality.
Keywords: coronavirus, COVID-19, Europe, location quotient, mortality, SARS-CoV-2, vaccine
The European Union (EU) is a coalition of 27 countries that share close geographic, political, and commercial ties and operate under the same regulatory framework to combat coronavirus disease 2019 (COVID-19) [1, 2]. The official approval of COVID-19 vaccines by the end of December 2020 [2] initiated country-based vaccination campaigns across member states that led to 65% of the EU population being fully vaccinated by 31 October 2021 [3]. This vaccination rollout drew a discrete line between 2020 (the prevaccination period) and 2021 when immunization was added to the armamentarium against COVID-19. The latter period is also characterized by the emergence and dominance of the fast-spreading Delta variant (B.1.617.2) [4], which exhibits an elevated transmissibility compared to the Alpha variant [5–7]. Its emergence has hindered pandemic control, rendering the immunization coverage of the population an absolute necessity [6, 8].
In this study, we used this setting of countries that share the same regulatory framework but different implementation policies, to estimate the differences in cumulative COVID-19 mortality and evaluate the effects of immunization coverage.
METHODS
We compiled aggregate data up to 31 October 2021, to extract confirmed COVID-19 reported deaths across the EU region published in “Our World in Data” [3], and calculated population-adjusted outcomes. For these calculations, we used these open source, open access data available under the Creative Commons license (CC BY 4.0), while the projected population estimates across EU members were obtained from the European Commission’s Eurostat official portal [9].
We divided country-specific estimates by the cumulative COVID-19 EU mortality rate to adjust country-level outcomes to overall EU outcome. This metric is a location quotient (LQ) and can be used to classify regional variation of demographic groups, occupations, clusters of events, and industries relative to a reference average [10]. If a country’s LQ is less than unity, there are relatively fewer COVID-19 deaths than expected (a more favorable outcome). If LQ is higher than unity, there are relatively more COVID-19 deaths than expected (a less favorable outcome).
We reported LQ point estimates with their 95% precision estimates (confidence intervals) [11, 12]. If a precision estimate includes 1, then the LQ does not differ from unity and COVID-19 deaths do not differ from the expected EU mortality. To further categorize mortality on an ordinal scale, we grouped countries with an LQ <0.9 as “favorable profile,” those with an LQ between 0.9 and 1.10 as “average profile,” and those with an LQ >1.10 as “unfavorable profile.”
To evaluate changes in classification and magnitude of effect across EU countries compared to the prevaccination era, we performed a quantitative and qualitative comparison between to-date estimates and 2020 cumulative estimates (up to 31 December 2020). To assess the stability of classification at various instances, we used the nonparametric Kendall W for ranks. The test evaluates the concordance between ordinal datasets expressed as a number between 0 and 1, with 1 denoting a perfect match and 0 a lack of agreement. The test allows multiple comparisons of the same sample, requires no prior assumptions on the distribution pattern, and weighs misclassification by the distance of mismatched pairs [13].
To explore the potential association between current and lagged values of vaccination coverage (the population share of fully vaccinated) [3] with changes in LQ, we used Spearman correlation coefficient [14]. Stata software version16 (StataCorp, College Station, Texas) was used for data analysis and figures.
The study did not include factors necessitating patient consent.
RESULTS
Cumulative COVID-19 Mortality Differs Across EU Countries
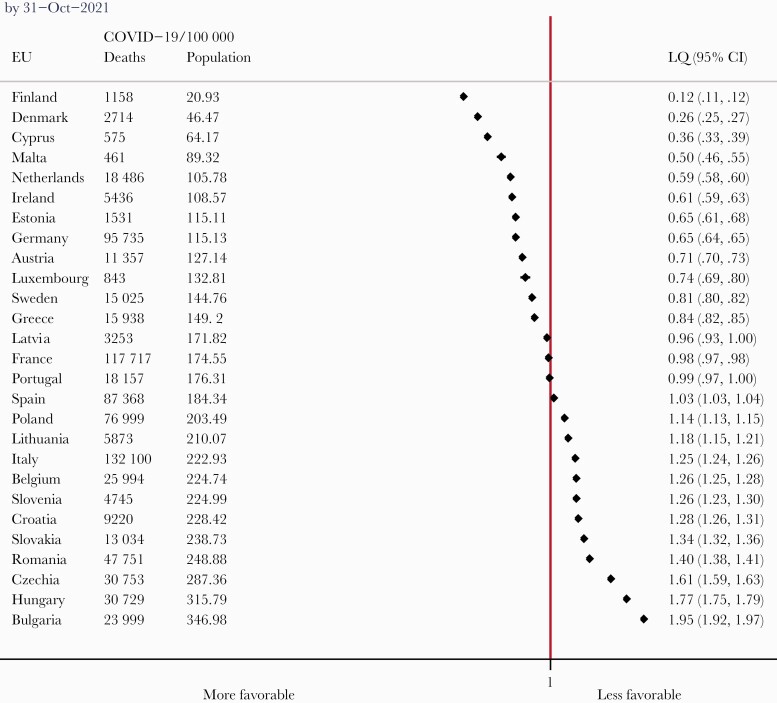
By 31 October 2021, there were approximately 797 000 confirmed COVID-19 deaths across the EU. Forty-six percent were reported by the end of 2020, 68% by the end of winter 2020–2021, and 91% by the end of spring [3]. Based on LQ, we classified EU countries into 3 discrete groups with regard to cumulative COVID-19 deaths as follows (Figure 1). More specifically, 11 countries (Poland, Lithuania, Italy, Belgium, Slovenia, Croatia, Slovakia, Romania, Czechia, Hungary, and Bulgaria) had LQs significantly higher than 1 and were included in the unfavorable profile group. The range was between 1.14 (Poland) and 1.95 (Bulgaria) and this means that through 31 October 2021, Poland had 14% more deaths than expected and Bulgaria had 95% COVID-19 deaths more than expected.
Figure 1.
Cumulative coronavirus disease 2019 (COVID-19) mortality data and location quotient (LQ) estimates in ascending order across the 27 European Union (EU) member countries. Most recent estimates (by 31 October 2021). An LQ <1 denotes fewer COVID-19 deaths than expected (a more favorable outcome), while an LQ >1 signifies more COVID-19 deaths than expected (a more unfavorable outcome). We allowed LQ estimates close to 1 (between 0.90 and 1.10) to be considered an average profile for group classification.
The countries in the second group (Latvia, France, Portugal, and Spain) were close to the EU mortality with an LQ of 0.90 to 1.10, comprising the average profile group, while the remaining 12 countries (Finland, Denmark, Cyprus, Malta, Netherlands, Ireland, Estonia, Germany, Austria, Luxembourg, Sweden, and Greece) had LQs significantly lower than unity to be included in the favorable profile group (range, 0.12 [Finland] to 0.84 [Greece]). This means that up to 31 October 2021, Finland had 88% fewer deaths than expected and Greece had 16% fewer COVID-19 deaths than expected.
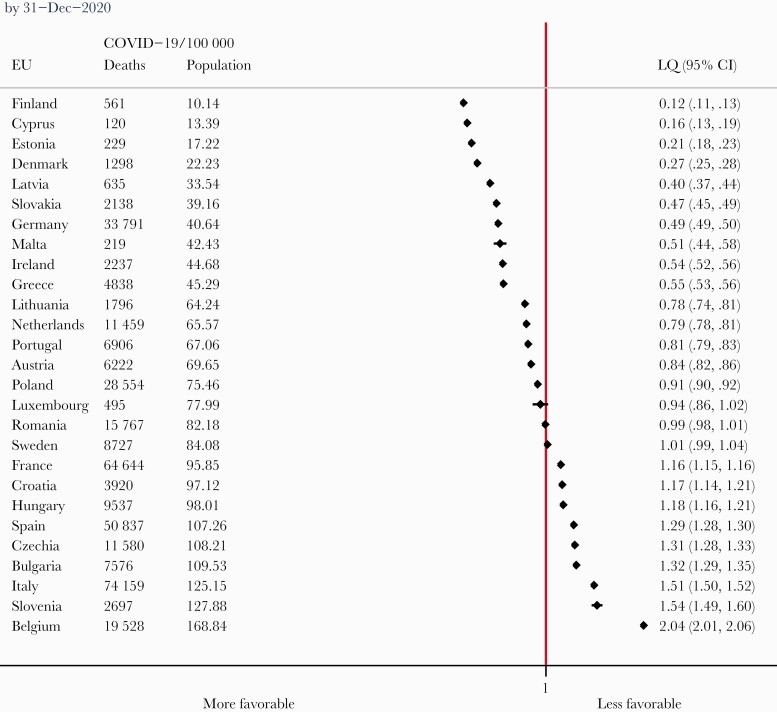
The direct comparison with the prevaccination period (estimates up to 31 December 2020, Figure 2) revealed that 9 of 27 EU countries changed group classification. Specifically, 4 countries improved their profile from average to favorable (Luxembourg, Sweden) or unfavorable to average (France, Spain). On the other hand, 5 countries moved to a less favorable group (Slovakia and Lithuania from favorable to unfavorable, Portugal and Latvia from favorable to average, and Romania from average to unfavorable).
Figure 2.
Cumulative coronavirus disease 2019 (COVID-19) mortality data and location quotient (LQ) estimates in ascending order across the 27 European Union (EU) member countries. Final 2020 estimates (by 31 December 2020). An LQ <1 denotes fewer COVID-19 deaths than expected (a more favorable outcome), while an LQ >1 signifies more COVID-19 deaths than expected (a more unfavorable outcome). We allowed LQ estimates close to 1 (between 0.90 and 1.10) to be considered an average profile for group classification.
Notably, the LQ rankings for the past 6 months were resilient to substantial change and the group classification was well preserved. The Kendall coefficient was 0.986 (P < .001) and indicated a near-perfect concordance (98.6%) for monthly rankings by 30 April through 31 October 2021. The Supplementary Figure shows the timeline of LQ changes by monthly intervals, based on the cumulative data on COVID-19 reported deaths across the EU region.
Quantifying the Changes in Cumulative Mortality Through 2021
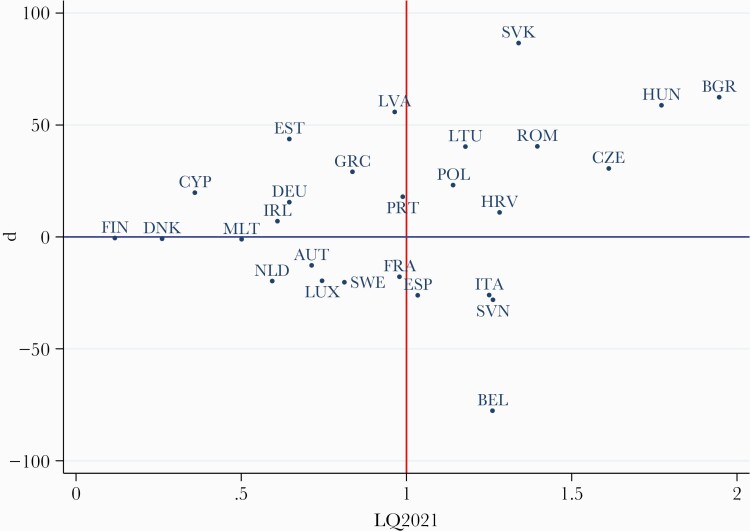
Figure 3 shows the quantitative changes in LQ estimates between the 2 periods with absolute differences (in percentage points) on the y-axis and current LQ estimates on the x-axis. The reference lines separate graphs into 4 quadrants. The countries on the right-upper quadrant have an unfavorable profile that has worsened in 2021; for example, Slovakia, Bulgaria, and Hungary had a >50-percentage-point increase. Those on the right-lower quadrant have an unfavorable profile with improvement in 2021 (eg, Belgium had the highest improvement by 78 percentage points). The countries on the left-upper quadrant have a favorable profile that has worsened in 2021 (eg, Latvia and Estonia had the highest increase by approximately 50 percentage points). Those on the left-lower quadrant have a favorable profile with improvement in 2021. Among them, Finland, Denmark, and Malta remained in the favorable group and had no change in LQ.
Figure 3.
Quantitative changes (d) of location quotient (LQ) in percentage points (y-axis) over 2021 estimates (x-axis). The reference lines for zero difference (horizontal) and expected European Union mortality (vertical) create 4 quadrants: the right-upper quadrant for unfavorable profile, worsening in 2021 (LQ >1 and positive change); the right-lower quadrant for an unfavorable profile with improvement in 2021 (LQ >1 and negative change); the left-upper quadrant for favorable profile, worsening in 2021 (LQ <1 and positive change); the left-lower quadrant for a favorable profile with improvement in 2021 (LQ <1 and negative change). Country abbreviations: AUT, Austria; BEL, Belgium; BGR, Bulgaria; CYP, Cyprus; CZE, Czechia; DEU, Germany; DNK, Denmark; ESP, Spain; EST, Estonia; FIN, Finland; FRA, France; GRC, Greece; HUN, Hungary; HRV, Croatia; IRL, Ireland; ITA, Italy; LTU, Lithuania; LUX, Luxembourg; LVA, Latvia; MLT, Malta; NLD, Netherlands; POL, Poland; PRT, Portugal; ROM, Romania; SVK, Slovakia; SVN, Slovenia; SWE, Sweden.
Vaccination Coverage Correlates With a Favorable Outcome
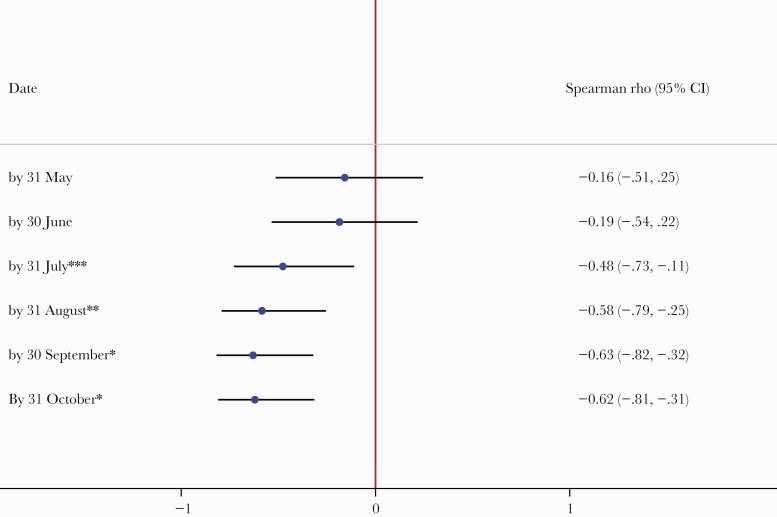
The changes in estimates were associated with vaccination coverage (measured as the population share of fully vaccinated). Overall, countries with a negative change in LQ (improvement) had median vaccination coverage of 71% (interquartile range [IQR], 67%–75%) as opposed to a lower vaccination coverage of 57% (IQR, 44%–64%) for countries with a positive change (worsening) in LQ (P = .005). Thus, there was a significant negative association between the current vaccination coverage and LQ changes (ρ = –0.62, P < .001). With a 4-month lag, vaccination coverage had also a negative association with LQ changes. Instead, vaccination coverage before July 2021 lacked any significant association with LQ changes (Figure 4).
Figure 4.
Association between the share of fully vaccinated (current and lagged values) and location quotient (LQ) change across European Union members. A significant negative association appears after July 2021. That is, higher vaccination coverage will be followed by reductions in LQ, namely an improvement on cumulative mortality (vice versa, a lower vaccination coverage will be followed by a growth in LQ and worsen cumulative mortality rankings). Spearman rank correlation coefficient (ρ) is a nonparametric measure of association; +1 means a perfect positive correlation; –1 a perfect negative correlation. ∗P < .001; ∗∗P = .002; ∗∗∗P = .02. All associations before June 2021 lack significance. Abbreviation: CI, confidence interval.
Illustrative Examples
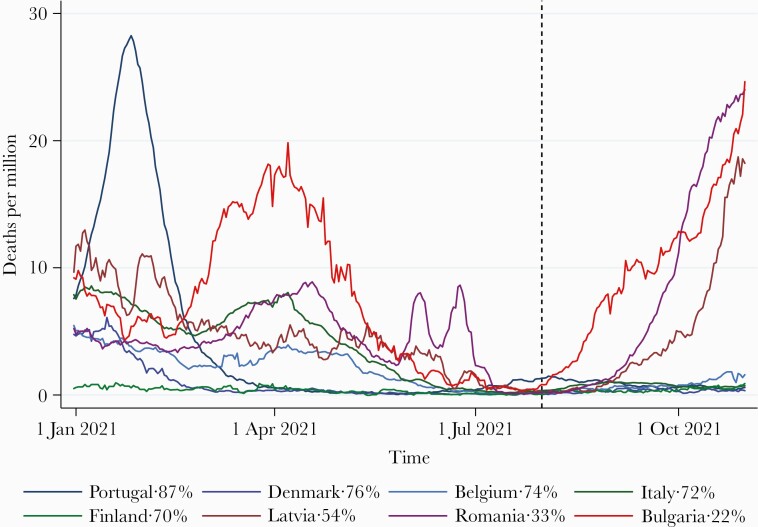
On Figure 5, we present informative examples on the patterns of change in mortality rankings. A high vaccination coverage (eg, Portugal, Denmark, Italy, Belgium) resulted in obliteration of flares in COVID-19 deaths after July 2021, with the Delta variant surge ongoing. This was juxtaposed with regions with low vaccination coverage (eg, Latvia, Romania, Bulgaria) where flares in COVID-19 deaths followed. A positive imbalance in actual mortality adds to cumulative mortality in lower-coverage regions, while high-coverage regions will improve rankings through COVID-19 death aversion. Regions that combine long-standing success to limit COVID-19 deaths retain an optimal profile with the adoption of vaccines (eg, Finland).
Figure 5.
Population-adjusted daily confirmed coronavirus disease 2019 (COVID-19) deaths (7-day rolling average) for selected European Union regions. COVID-19 deaths are suppressed across regions with high vaccination coverage after July 2021; deaths flare in regions with low vaccination coverage. Share (%) of fully vaccinated by the end of observation; vertical reference line marks July’s end.
DISCUSSION
During an outbreak or a global pandemic, such as COVID-19, cumulative mortality is an important index to measure the burden of disease. The EU countries have several similarities, including the same regulatory framework, providing the opportunity to evaluate the relative impact of vaccination programs. We used the LQ to study the cumulative mortality in the EU from the beginning of the pandemic and found that the share of fully vaccinated had a direct impact on the relative mortality rate within the EU.
The simple ranking of population-adjusted estimates is less informative when “success” and “failure” need to be defined at a regional level, unless a second adjustment is made for the expected effect. The LQ is a spatiotemporal index of regional variation that accounts for the expected effect [10, 12, 15] and, as such, a useful aid to draw a line between areas with a more favorable outcome over the ones with a less favorable outcome and quantify the relative difference. For cumulative COVID-19 mortality, 12 EU countries had a favorable profile, 11 had an unfavorable profile, and the remaining 4 were close to the expected EU mortality, with <10% difference.
Cross-country differences in the diffusion and the lethality of COVID-19 have been evident since the beginning of the pandemic. Such outcomes depend on regional socioeconomic factors, access and quality of healthcare, population adherence to specific measures, population characteristics (such as obesity and comorbidities), travel and spread of variants, and the administration’s performance (including the success of a vaccination campaign) [16–18]. However, EU countries share the same regulatory framework with different country-level implementation and acceptance of vaccination programs, providing a unique environment to study relative mortality rates.
The lack of an effective vaccine through the end of 2020 resulted in countries’ struggle with restriction measures and healthcare administrative interventions as the only tools to mitigate multiple COVID-19 waves [19, 20]. Sociodemographic and health status variables and the responses and measures adopted in the first vs the subsequent waves varied across countries and have been suggested to affect mortality [21–23]. The initiation of vaccine campaigns came to boost population immunity [24, 25] and add another crucial moderator on the course of COVID-19 and related mortality, given that vaccinations do suppress COVID-19 mortality, a proven effect documented across Europe [26–28] and the United States [29, 30]. As a result, countries with low vaccination coverage were unlikely to show relative improvement in COVID-19 mortality. Our quantitative analysis supports that higher vaccination coverage is associated with reduction in LQ and improvement on cumulative mortality, whereas lower vaccination coverage results in growth in LQ and worse relative cumulative mortality.
Interestingly, as noted on Figure 4, the mortality benefit comes within a 4-month lag, whereas no association between vaccination coverage and LQ change was seen prior to July 2021. These findings underscore that in the EU region, the effects of vaccinations on cumulative mortality were not seen clearly before late July 2021 when the share of fully vaccinated reached 49% [3].
Our study showed that the group classification for most countries did not change over time. This could be in part because the countries’ mortality profiles were primarily shaped in the early and late 2020–early 2021 waves, as 91% of the cumulative COVID-19 mortality across the EU was recorded by the end of spring 2021 [3]. Imbalances in population immunity may slowly change the mortality profiles in the short term and countries with a high vaccination coverage will face at worst moderate waves, whereas for countries with lower coverage more severe waves are expected [31].
In this study, we analyze laboratory-confirmed, COVID-19 cumulative deaths, which is the standard practice across EU. We present cumulative COVID-19 mortality data given that deaths are a less biased indicator of disease burden. Instead, apart from the epidemic activity, infection rates can vary across regions due to differences in testing and tracing policies, which adds further variability between country-level comparisons. Case detection rates are relative to the extent of testing for a given time and region and therefore less objective for country-level comparisons [3].
Regarding study limitations, the use of administrative databases comes with certain inherent limitations. The administrative authorities are requested to code laboratory-confirmed cases of COVID-19, collect them in national registration statistics, and report them to international sources. However, the actual death toll may be higher due to restrictions in civil registries (eg, lags in death certificate processing), the exclusion of those dying without testing positive (eg, due to restrictions in testing), or those dying at home without confirmation. Thus, the reported death rates are a conservative approximation of the true mortality from COVID-19 [32, 33].
We acknowledge that the association between the level of vaccination and the change in cumulative mortality rankings provides a hypothesis of a causal link, and not a direct proof. That is, association may not necessarily imply causation when complex interactions are present, and spurious associations may arise unless confounding factors are studied. Adjusting for confounding factors such as age, obesity, and immunosuppression would add to the analysis but would require individual patient data, which are not available [3]. Furthermore, admission and stay in the intensive care unit (ICU) is associated with high mortality rates. Changes in ICU mortality are multifactorial, not exclusively related to changes in care but also to the direct effect of variants on severe disease and their indirect effect of strain to the healthcare system [34, 35]. Improving practices in caring for COVID-19 patients in the ICU may have led to more favorable outcomes, though these associations are neither straightforward nor guaranteed and some studies did not show a dramatic improvement in mortality, regardless of changing practices in ICU during the pandemic [36]. Overall, it is highly unlikely that improving ICU care would alter the course of the pandemic in the same degree as an imperfect vaccine can avert severe cases, hospitalizations, and deaths and have a bulk effect on mortality [26–30, 37].
In conclusion, the lack of an effective vaccine until the end of 2020 hindered efforts to control the COVID-19 surge and shaped cumulative mortality across EU member countries. The advent of vaccine approval and rollout, and the implementation of massive vaccination campaigns across the EU, contributed to changes in cumulative mortality rankings across EU member countries, favoring those with higher vaccination coverage. Our findings underscore that despite the homogeneity in approval and distribution framework, regional differences in vaccination coverage are a major driver to moderate mortality from COVID-19. The paradigm extends to the country, subnational, and state level and regional setting and reaffirms the urgent need to attenuate the differences in vaccination toward high population coverage. As the complete eradication of COVID-19 is unlikely, a gradual waning of postvaccination and postinfection immunity that will allow the virus to circulate globally and maintain a level of activity is a realistic scenario for the long-term perspective [31]. Successful implementation of vaccination programs can slow down changes in cumulative mortality profiles.
Supplementary Data
Supplementary materials are available at Open Forum Infectious Diseases online. Consisting of data provided by the authors to benefit the reader, the posted materials are not copyedited and are the sole responsibility of the authors, so questions or comments should be addressed to the corresponding author.
Notes
Potential conflicts of interest. All authors: No reported conflicts of interest.
All authors have submitted the ICMJE Form for Disclosure of Potential Conflicts of Interest. Conflicts that the editors consider relevant to the content of the manuscript have been disclosed.
References
- 1. European Commission. Commissions centralised EU approach. 2020. https://ec.europa.eu/info/publications/commissions-centralised-eu-approach_en. Accessed 10 October 2021.
- 2. European Commission. A united front to beat COVID-19. 2021. https://eur-lex.europa.eu/legal-content/EN/TXT/?uri=CELEX%3A52021DC0035&qid=1616149581345. Accessed 10 October 2021.
- 3. Ritchie H, Mathieu E, Rodés-Guirao L, et al. Coronavirus pandemic (COVID-19). 2020. https://ourworldindata.org/coronavirus. Accessed 17 December 2021.
- 4. Tao K, Tzou PL, Nouhin J, et al. The biological and clinical significance of emerging SARS-CoV-2 variants. Nat Rev Genet 2021; 22:757–73. [DOI] [PMC free article] [PubMed] [Google Scholar]
- 5. Barda N, Dagan N, Cohen C, et al. Effectiveness of a third dose of the BNT162b2 mRNA COVID-19 vaccine for preventing severe outcomes in Israel: an observational study. Lancet 2021; 398:2093–100. [DOI] [PMC free article] [PubMed] [Google Scholar]
- 6. Shiehzadegan S, Alaghemand N, Fox M, Venketaraman V.. Analysis of the Delta variant B.1.617.2 COVID-19. Clin Pract 2021; 11:778–84. [DOI] [PMC free article] [PubMed] [Google Scholar]
- 7. Shoukat A, Vilches TN, Moghadas SM, et al. Lives saved and hospitalizations averted by COVID-19 vaccination in New York City: a modeling study. Lancet Reg Health Am 2021; 5:100085. [DOI] [PMC free article] [PubMed] [Google Scholar]
- 8. Singanayagam A, Hakki S, Dunning J, et al. Community transmission and viral load kinetics of the SARS-CoV-2 Delta (B.1.617.2) variant in vaccinated and unvaccinated individuals in the UK: a prospective, longitudinal, cohort study [manuscript published online ahead of print 29 October 2021]. Lancet Infect Dis 2021. doi: 10.1016/S1473-3099(21)00648-4. [DOI] [PMC free article] [PubMed] [Google Scholar]
- 9. European Commission. Eurostat:population projections at national level (2019-2100).2020. https://ec.europa.eu/eurostat/web/population-demography-migration-projections/data/database. Accessed 10 October 2021.
- 10. Gibson J, Miller M, Wright G.. Location quotient: a basic tool for economic development analysis. Econ Devel Rev 1991; 9:65–8. [Google Scholar]
- 11. Oehlert G. A note on the Delta method. Am Statistician 1992; 46:27–9. [Google Scholar]
- 12. Beyene J, Moineddin R.. Methods for confidence interval estimation of a ratio parameter with application to location quotients. BMC Med Res Methodol 2005; 5:32. [DOI] [PMC free article] [PubMed] [Google Scholar]
- 13. Siegel S, Castellan Jr NJ.. Nonparametric statistics for the behavioral sciences, 2nd ed. New York: McGraw-Hill; 1988. [Google Scholar]
- 14. Ramsey PH. Critical values for Spearman’s rank order correlation. J Educ Statistics 1989; 14:245–53. [Google Scholar]
- 15. Ziakas PD, Mylonakis E.. Medicare part D spending on drugs prescribed by oncologists: temporal trends and regional variation. JCO Oncology Practice 2021; 17:e433–9. [DOI] [PubMed] [Google Scholar]
- 16. Petherick A, Goldszmidt R, Andrade EB, et al. A worldwide assessment of changes in adherence to COVID-19 protective behaviours and hypothesized pandemic fatigue. Nat Hum Behav 2021; 5:1145–60. [DOI] [PubMed] [Google Scholar]
- 17. Schwarzinger M, Watson V, Arwidson P, Alla F, Luchini S.. COVID-19 vaccine hesitancy in a representative working-age population in France: a survey experiment based on vaccine characteristics. Lancet Public Health 2021; 6:e210–21. [DOI] [PMC free article] [PubMed] [Google Scholar]
- 18. Siciliani L, Wild C, McKee M, et al. Strengthening vaccination programmes and health systems in the European Union: a framework for action. Health Policy 2020; 124:511–8. [DOI] [PubMed] [Google Scholar]
- 19. Hale T, Anania J, Angrist N, et al. Variation in government responses to COVID-19. Version 12.0. Blavatnik School of Government working paper. 2020. https://www.bsg.ox.ac.uk/sites/default/files/2021-06/BSG-WP-2020-032-v12_0.pdf. Accessed 10 October 2021.
- 20. Hale T, Webster S, Petherick A, Phillips T, Kira B.. Oxford COVID-19 government response tracker. Blavatnik School of Government, University of Oxford. 2020. https://covidtracker.bsg.ox.ac.uk/. Accessed 10 October 2021.
- 21. Sage L, Albertini M, Scherer S.. The spreading of SARS-CoV-2: interage contacts and networks degree distribution. PLoS One 2021; 16:e0256036. [DOI] [PMC free article] [PubMed] [Google Scholar]
- 22. Villani L, Pastorino R, Ricciardi W, Ioannidis J, Boccia S.. Inverse correlates of COVID-19 mortality across European countries during the first versus subsequent waves. BMJ Glob Health 2021; 6:e006422. [DOI] [PMC free article] [PubMed] [Google Scholar]
- 23. Oksanen A, Kaakinen M, Latikka R, Savolainen I, Savela N, Koivula A.. Regulation and trust: 3-month follow-up study on COVID-19 mortality in 25 European countries. JMIR Public Health Surveill 2020; 6:e19218. [DOI] [PMC free article] [PubMed] [Google Scholar]
- 24. Veldhoen M, Simas JP.. Endemic SARS-CoV-2 will maintain post-pandemic immunity. Nat Rev Immunol 2021; 21:131–2. [DOI] [PMC free article] [PubMed] [Google Scholar]
- 25. Spellberg B, Nielsen TB, Casadevall A.. Antibodies, immunity, and COVID-19. JAMA Intern Med 2021; 181:460–2. [DOI] [PMC free article] [PubMed] [Google Scholar]
- 26. Jabagi M, Botton J, Baricault B, et al. Estimation de l’impact de la vaccination sur le risque de formes graves de Covid-19 chez les personnes de 50 à 74 ans en France à partir des données du Système National des Données de Santé (SNDS). EPI-PHARE, Surveillance pharmaco-épidémiologique de la vaccination contre la COVID-19. 2021. https://www.epi-phare.fr/rapports-detudes-et-publications/impact-vaccination-covid-octobre-2021/. Accessed 10 November 2021.
- 27. Bouillon K, Baricault B, Botton J, et al. Estimation de l’impact de la vaccination chez les personnes âgées de 75 ans et plus sur le risque de formes graves de Covid-19 en France à partir des données du Système National des Données de Santé (SNDS) – actualisation jusqu’au 20 juillet 2021. EPI-PHARE, Surveillance pharmaco-épidémiologique de la vaccination contre la COVID-19. 2021. https://www.epi-phare.fr/rapports-detudes-et-publications/impact-vaccination-covid-octobre-2021/. Accessed 11 October 2021.
- 28. Public Health England. COVID-19 vaccine surveillance report.https://www.gov.uk/government/publications/covid-19-vaccine-surveillance-report. Accessed 10 October 2021.
- 29. Samson LW, Tarazi W, Orav J, Sheingold S, De Lew N, Sommers BD;. Office of the Assistant Secretary for Planning and Evaluation. Associations between county-level vaccination rates and COVID-19 outcomes among Medicare beneficiaries. 2021. https://aspe.hhs.gov/reports/covid-19-vaccination-rates-outcomes. Accessed 10 October 2021.
- 30. Scobie HM, Johnson AG, Suthar AB, et al. Monitoring incidence of COVID-19 cases, hospitalizations, and deaths, by vaccination status—13 U.S. jurisdictions, April 4–July 17, 2021. MMWR Morb Mortal Wkly Rep 2021; 70:1284–90. [DOI] [PMC free article] [PubMed] [Google Scholar]
- 31. Iftekhar EN, Priesemann V, Balling R, et al. A look into the future of the COVID-19 pandemic in Europe: an expert consultation. Lancet Reg Health Eur 2021; 8:100185. [DOI] [PMC free article] [PubMed] [Google Scholar]
- 32. Checchi F, Roberts L;. Humanitarian Practice Network. Interpreting and using mortality data in humanitarian emergencies. 2005:52. https://odihpn.org/wp-content/uploads/2005/09/networkpaper052.pdf. Accessed 10 October 2020. [Google Scholar]
- 33. Karlinsky A, Kobak D.. Tracking excess mortality across countries during the COVID-19 pandemic with the World Mortality Dataset. Elife 2021; 10:e69336. [DOI] [PMC free article] [PubMed] [Google Scholar]
- 34. Prescott HC, Levy MM.. Temporal trends in ICU survival for coronavirus disease 2019: a bumpy road. Crit Care Med 2021; 49:1986–8. [DOI] [PMC free article] [PubMed] [Google Scholar]
- 35. Dennis JM, McGovern AP, Thomas NJ, Wilde H, Vollmer SJ, Mateen BA.. Trends in 28-day mortality of critical care patients with coronavirus disease 2019 in the United Kingdom: a national cohort study, March 2020 to January 2021. Crit Care Med 2021; 49:1895–900. [DOI] [PMC free article] [PubMed] [Google Scholar]
- 36. Carbonell R, Urgelés S, Rodríguez A, et al. Mortality comparison between the first and second/third waves among 3,795 critical COVID-19 patients with pneumonia admitted to the ICU: a multicentre retrospective cohort study. Lancet Reg Health Eur 2021; 11:100243. [DOI] [PMC free article] [PubMed] [Google Scholar]
- 37. Moghadas SM, Vilches TN, Zhang K, et al. The impact of vaccination on COVID-19 outbreaks in the United States. Clin Infect Dis 2021; 73:2257–64. [DOI] [PMC free article] [PubMed] [Google Scholar]
Associated Data
This section collects any data citations, data availability statements, or supplementary materials included in this article.


