Abstract
The calcium-sensing receptor (CaSR), a cell-surface sensor for Ca2+, is the master regulator of calcium homeostasis in humans and is the target of calcimimetic drugs for the treatment of parathyroid disorders1. CaSR is a family C G-protein-coupled receptor2 that functions as an obligate homodimer, with each protomer composed of a Ca2+-binding extracellular domain and a seven-transmembrane-helix domain (7TM) that activates heterotrimeric G proteins. Here we present cryo-electron microscopy structures of near-full-length human CaSR in inactive or active states bound to Ca2+ and various calcilytic or calcimimetic drug molecules. We show that, upon activation, the CaSR homodimer adopts an asymmetric 7TM configuration that primes one protomer for G-protein coupling. This asymmetry is stabilized by 7TM-targeting calcimimetic drugs adopting distinctly different poses in the two protomers, whereas the binding of a calcilytic drug locks CaSR 7TMs in an inactive symmetric configuration. These results provide a detailed structural framework for CaSR activation and the rational design of therapeutics targeting this receptor.
CaSR regulates calcium homeostasis primarily through its actions in the parathyroid gland and kidneys, where its activation by elevated circulating Ca2+ leads to decreases in parathyroid hormone (PTH) secretion and renal tubular Ca2+ resorption, respectively1. CaSR activity is positively modulated by various extracellular ligands, including aromatic amino acids, and has thus been proposed to double as a nutrient sensor3. Loss-of-function mutations of CaSR lead to familial hypocalciuric hypercalcaemia type 1 (FHH1), whereas gain-of-function CaSR mutations give rise to autosomal dominant hypocalcaemia type 1 (ADH1)1. Moreover, chronic kidney disease frequently reduces parathyroid CaSR expression and function, resulting in secondary hyperparathyroidism4. Currently, CaSR is clinically targeted by three calcimimetic positive allosteric modulators (PAMs), namely cinacalcet, evocalcet and etelcalcetide, for the treatment of secondary hyperparathyroidism and FHH1, while calcilytic negative allosteric modulators (NAMs) are currently in phase II clinical trials for the treatment of ADH15.
CaSR is a member of family C G-protein-coupled receptors (GPCRs)2, which also include the metabotropic glutamate receptors (mGlus). CaSR functions as an obligate homodimer with an N-terminal extracellular domain (ECD) comprised of a Venus flytrap domain (VFT), a bi-lobed structure (LB1–LB2) responsible for ligand binding, linked to the 7TM domain by a cysteine-rich domain (CRD). Previous crystal structures of the CaSR ECD6,7 have illustrated how the binding of Ca2+ and L-tryptophan (Trp) or its derivatives leads to the closure and reorientation of the VFTs. However, how ECD rearrangements result in the activation of the 7TMs and how NAMs and PAMs target the receptor remain unknown. To address these questions, we purified near-full-length human CaSR in active or inactive states (Extended Data Fig. 1a–f) and analysed these preparations by cryo-electron microscopy (cryo-EM) (Extended Data Figs. 2–4). We show two structures of active-state CaSR in complex with clinically used PAMs, namely the CaSR–cinacalcet complex and the CaSR–evocalcet–etelcalcetide complex, at nominal global resolutions of 2.5 Å and 2.8 Å, respectively, together with structures of CaSR complexed with the NAM NPS-2143 under inactive (low Ca2+) and activating (high Ca2+, high Trp) conditions at 4.1 Å and 3.2 Å, respectively (Fig. 1a, Extended Data Figs. 1g, h, 2–4). The results reveal how calcilytic and calcimimetic drugs target CaSR and illustrate an essential asymmetry between the two active-state CaSR protomers stabilized by the same 7TM PAM in two distinct binding poses.
Fig. 1 |. Structural rearrangements of human CaSR upon activation.
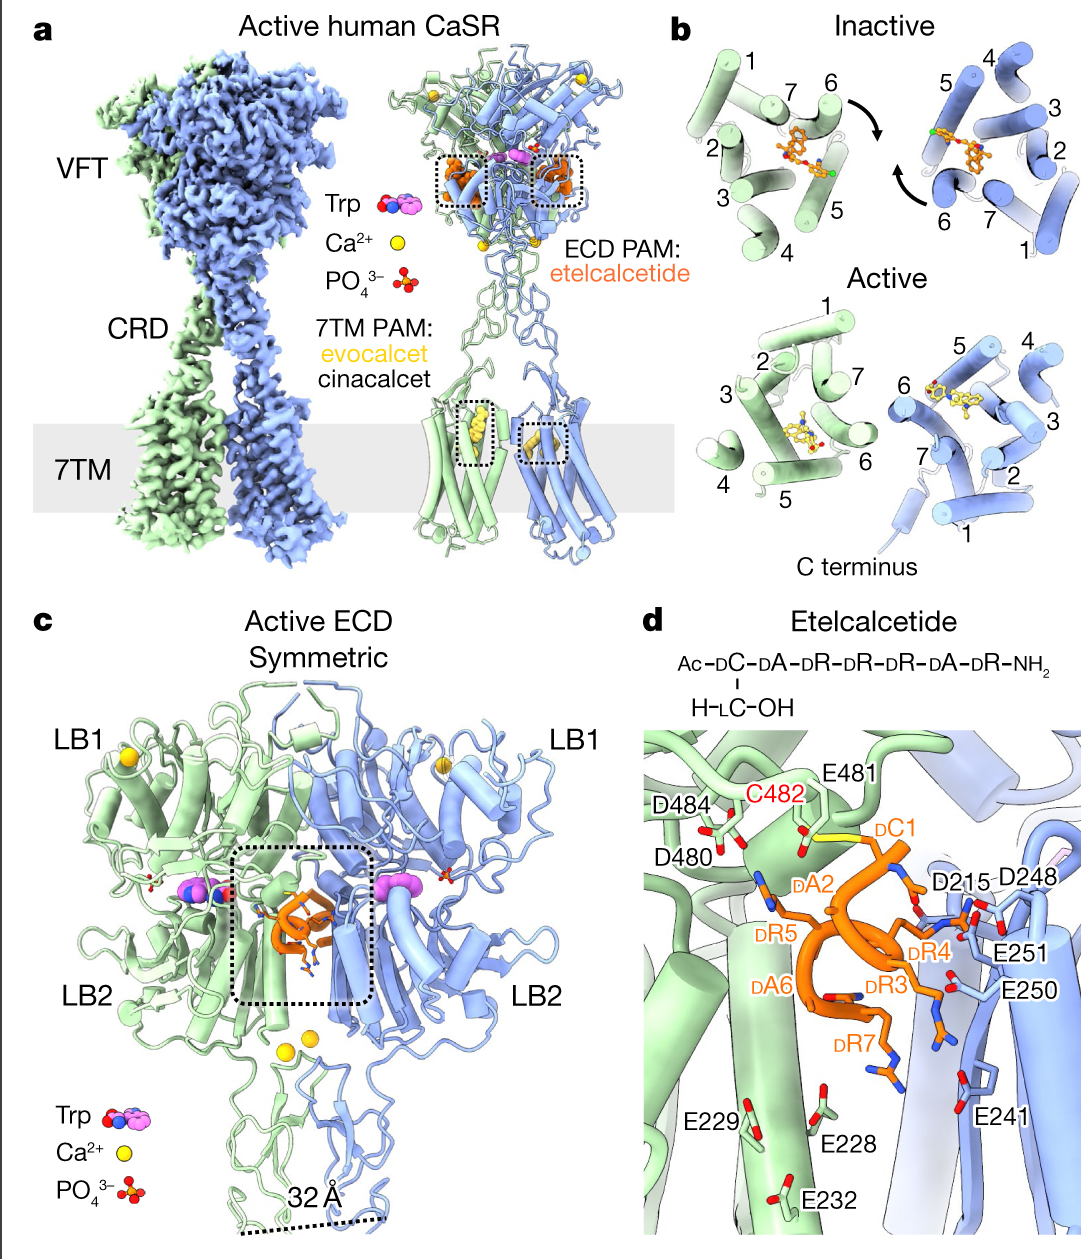
a, Cryo-EM map and model of active-state CaSR complexed with evocalcet and etelcalcetide. The PAM cinacalcet binds in a similar way to evocalcet (Extended Data Figs. 3, 6c, d). b, Comparison of overall arrangements of 7TM dimer in inactive and active states. c, Active-state CaSR ECD complexed with the ECD PAM etelcalcetide (dashed square). d, Top, etelcalcetide structure. Bottom, interactions between etelcalcetide and active-state VFTs. Prefixes indicate D- and L-amino acids. Ac, acetyl group.
Rearrangement of the ECD upon activation
In the inactive state, the CaSR homodimer adopts an extended parallel conformation with an interface involving the top lobe (LB1) of the VFTs, similar to the apo state mGlu5 homodimer8 (Extended Data Figs. 1g, 5a, b). Notably, the VFTs in the inactive-state cryo-EM structure adopt an asymmetric open–closed conformation, unlike the symmetric open–open inactive ECD crystal structure6 (Extended Data Figs. 1g, i, 5a, c, d). The 7TM domains are separated with the transmembrane helix 5 (TM5)–TM6 planes facing each other (Fig. 1b), distinct from the TM4–TM5 interface observed in mGlu58 (Extended Data Fig. 5e). Upon activation, the closure of the VFTs brings the CRDs together (Fig. 1c, Extended Data Fig. 5f), thereby clamping the 7TMs to form a TM6–TM6 interface (Fig. 1b). The juxtaposed TM6 helices diverge from each other on the cytoplasmic side (Fig. 2a), creating a space that accommodates several ordered elongated densities that correspond to cholesterol hemisuccinate (CHS) or glyco-diosgenin (GDN) detergent, potentially stabilized by a cholesterol-binding CARC motif9 (805-KFITFSML-812, characteristic CARC motif residues in bold) centred around F8096.47 (superscript denoting generic GPCR numbering10) (Extended Data Fig. 5g, h). Notably, CaSR has been shown in parathyroid cells to localize to cholesterol-rich caveolae11, and F8096.47L is an inactivating mutation causing FHH112.
Fig. 2 |. Asymmetric configuration of active-state CaSR 7TMs and interactions between the CRD and the 7TMs.
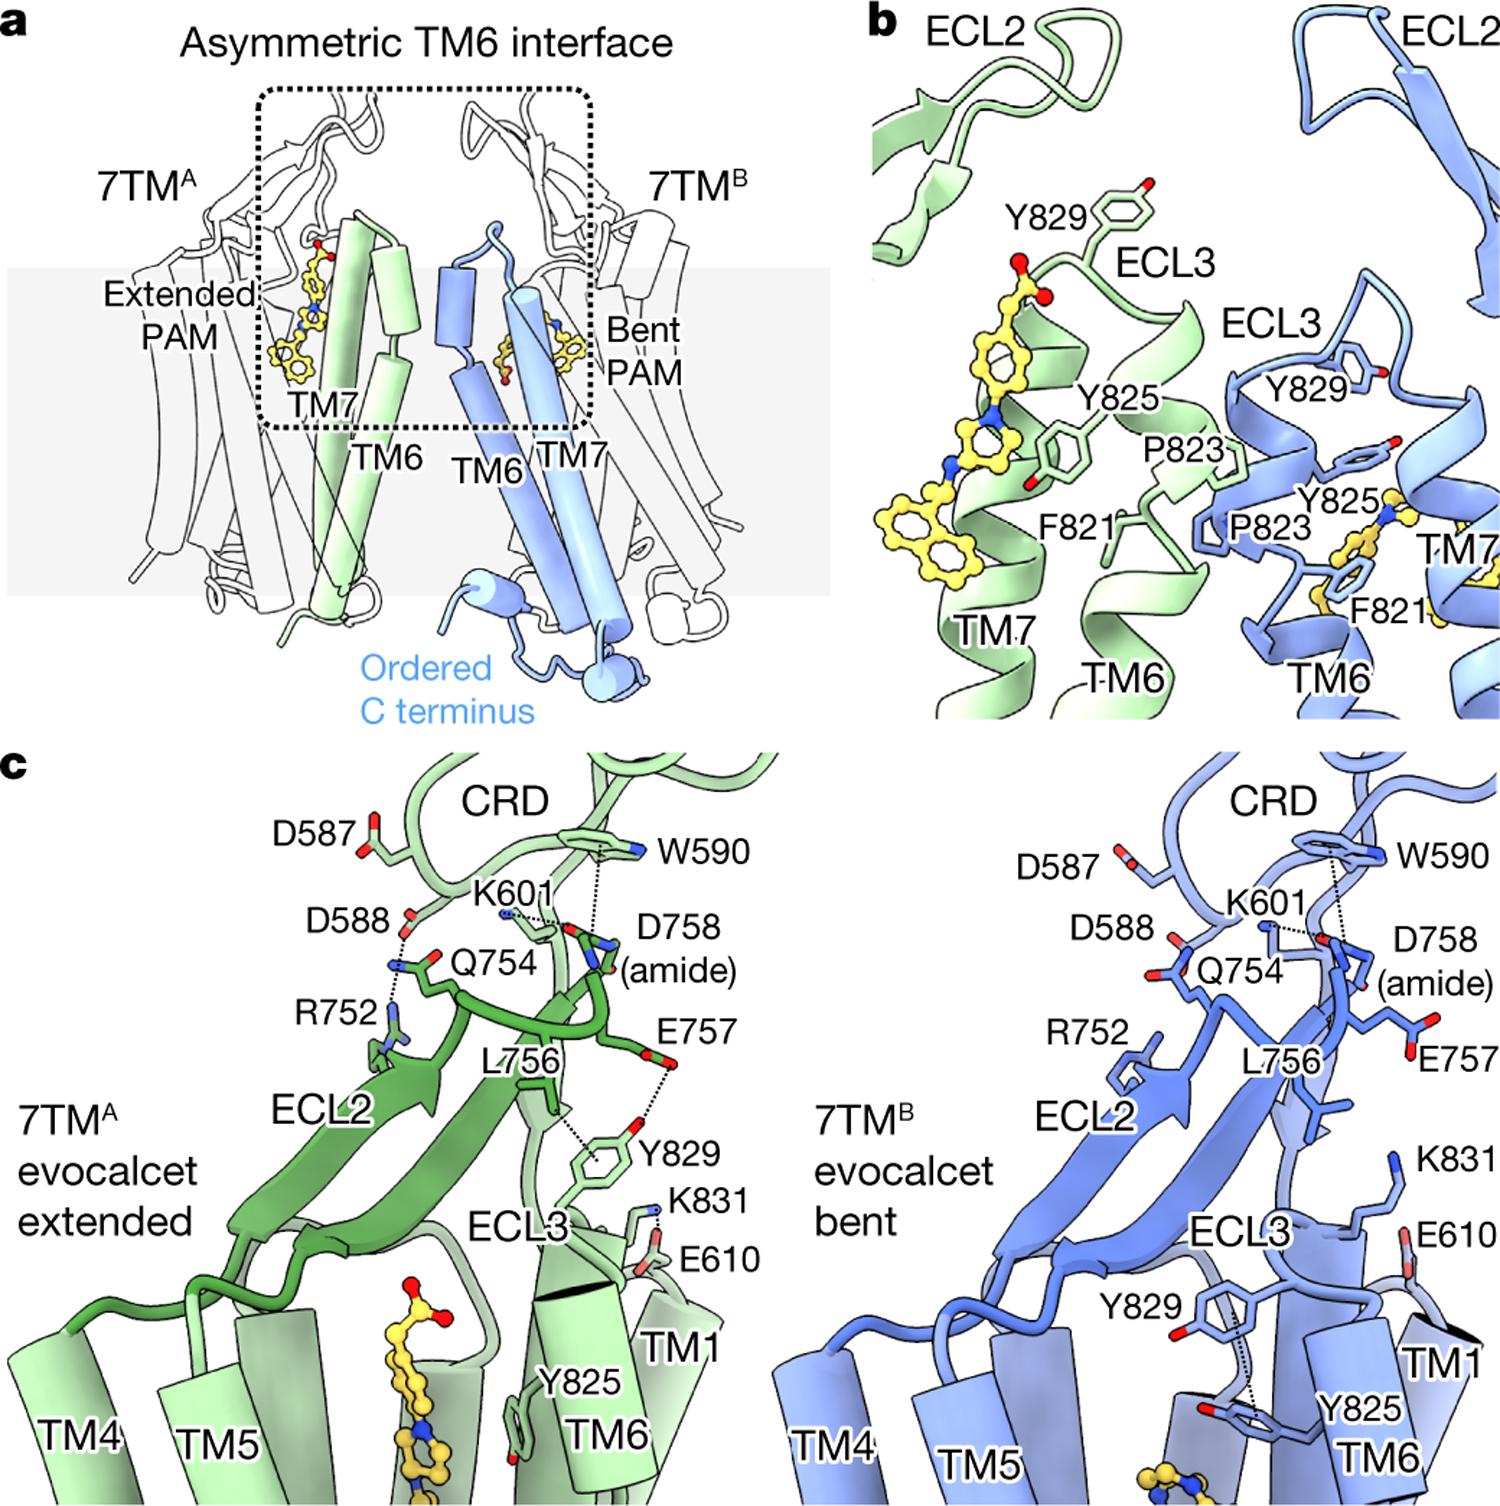
a, Overall conformation of the asymmetric 7TMs. b, Ribbon view of the asymmetric TM6–TM6 interface (boxed region in a). c, Interaction network in the CRD–ECL2–ECL3 region of active-state CaSR, showing the conformations of 7TMA with an extended PAM and 7TMB with a bent PAM.
The activated ECD adopts a symmetric closed–closed conformation (Fig. 1a, c) with a Trp bound at each LB1–LB2 cleft. In each protomer, we observe densities at the four Ca2+ sites reported in a previous active-state ECD crystal structure6; however, only two sites contain coordination spheres that support the presence of Ca2+ (Extended Data Fig. 5i). In the inactive open-closed ECD, the closed protomer (root mean square deviation (r.m.s.d.) = 0.7 Å; Extended Data Fig. 5j) is occupied by a tube-shaped density at the Trp site, as in the active state (Extended Data Fig. 5k). A previous crystal structure of the active CaSR ECD without added Trp also revealed a density at the LB1–LB2 cleft7, which was identified through mass spectroscopy as a Trp derivative and proposed to arise from recombinant protein production. Thus, the corresponding density observed in our inactive CaSR map could be of a similar origin. Notably, an open–closed conformation has been observed in crystal structures of the mGlu1 ECD13 (Extended Data Fig. 5l), where L-glutamate occupies the LB1–LB2 cleft. L-amino acids function as PAMs for CaSR, and the open–closed conformation could be more relevant in nutrient-rich environments, such as the gastrointestinal tract, where amino acid concentrations can increase to up to 30 mM after food intake14. The binding of L-amino acids or their derivatives in one VFT cleft of inactive CaSR may prime the receptor for activation, increasing its sensitivity to fast fluctuations of Ca2+ concentration.
Binding mode of the ECD PAM etelcalcetide
Etelcalcetide, a newly approved calcimimetic PAM that engages the CaSR ECD15, is a 7-residue D-peptide with an N-terminal D-Cys1 protected by a disulfide-bonded L-cysteine (Fig. 1d). It has been proposed that upon binding this PAM exchanges out the L-cysteine to form a disulfide with CaSR C48216. Our 2.5 Å structure of active-state CaSR in complex with both etelcalcetide and the 7TM PAM evocalcet reveals two identical copies of etelcalcetide covalently bound to C482 of each protomer (Fig. 1c, d, Extended Data Fig. 6a). The binding sites, located at the LB2 interface, are highly enriched in negatively charged residues (Fig. 1c, d). Residues D-Arg3, D-Arg4 and D-Arg5 in etelcalcetide reach out in opposite directions to form salt bridges with a patch of negatively charged residues on the juxtaposed VFTs, whereas D-Arg7 extends downward to simultaneously interact with E228 and E241 from opposite protomers. This would stabilize the active closed–closed ECD conformation, providing a molecular mechanism for etelcalcetide PAM activity. Of note, D-Ala2 and D-Ala6 each point to a different acidic patch on one protomer and the N-terminal acetyl group faces D248 and E251 from the other protomer. These observations suggest that introduction of basic side chains at D-Ala2 and D-Ala6 and addition of an N-terminal basic residue could potentially enhance the potency of etelcalcetide.
7TM asymmetry in active-state CaSR
In contrast to the symmetric ECD, the active-state 7TMs adopt markedly asymmetric conformations. This asymmetry is also reflected by the same 7TM PAM assuming distinct poses in the two protomers (Fig. 2a, b, Extended Data Fig. 6b–d). In both active CaSR structures, 7TMA contains an extended PAM, whereas the same PAM in 7TMB adopts a bent conformation (Fig. 2a, b, Extended Data Fig. 6c, d). At the 7TM interface, TM6 of 7TMA sits higher than the opposing TM6 of 7TMB, which is tilted relative to 7TMA (Fig. 2a, b, Extended Data Fig. 6b). The asymmetric 7TMs are further stabilized by a series of interactions across CRD–extracellular loop 2 (ECL2)–ECL3 (Fig. 2c, Extended Data Fig. 7a). K601 and W590 of CRD form polar or π–π interactions with the D758 main-chain amide at the apex of ECL2. R752 and Q754 of ECL2 are positioned to interact with CRD residues D587 and D588. Notably, R752C, which would weaken CRD–ECL2 interactions, is an inactivating FHH1 mutation17. ECL2–ECL3 interactions differ between the two protomers (Fig. 2c). In 7TMA, Y829 of ECL3 extends upward to interact with L756 and E757 of ECL2. This upward ECL3 conformation is further stabilized by the polar interaction between K831 of ECL3 and E610 on top of TM1. In 7TMB, ECL3 extends towards the 7TM core with Y829 stabilized by π–π interaction with Y8256.57. Thus, in active CaSR, the same set of residues form distinct interaction networks between the two protomers, stabilizing different ECL3 conformations.
Distinct 7TM PAM poses in the CaSR homodimer
Cinacalcet and evocalcet have similar efficacy and potency towards CaSR and share a backbone architecture with a flexible linker connecting naphthylethylamine and phenyl groups (Fig. 3a, Extended Data Figs. 1c, d, 7b). The linker in cinacalcet is a three-carbon chain, whereas in evocalcet it is a pyrrolidine ring adopting alternative endo- or exo-envelope conformers. In both the extended and bent conformations—which were evaluated and optimized using GemSpot18 (Fig. 3a, Extended Data Fig. 7c)—the naphthylethylamine group assumes highly similar positions, with the secondary amine stabilized by polar interactions with Q6813.33 and E8377.32. The naphthyl group forms hydrophobic interactions with F6843.36 and I7775.44 on one side and edge-to-face π–π interactions with W8186.50 on the other, holding the W8186.50 side chain inside the 7TM core. In the extended PAM, the linker together with the phenyl group extend upwards parallel to TM6, pushing Y8256.57 to point downward. In the bent PAM, the phenyl group folds down towards the gap between TM5 and TM6, forming parallel-displaced π–π stacking with the naphthyl group, while Y8256.57 adopts a near-horizontal conformation to stabilize the bent linker through σ–π interaction. In agreement with the observed PAM binding modes, the mutation Q6813.33A substantially attenuated cinacalcet-enhancement of CaSR signalling in inositol monophosphate (IP1) accumulation assays (Extended Data Fig. 8a). Furthermore, E8377.32A, F6843.36A and W8186.50A have been shown to substantially weaken cinacalcet-induced potentiation of CaSR19.
Fig. 3 |. Structural basis of CaSR-targeting by allosteric calcimimetic and calcilytic drug molecules.
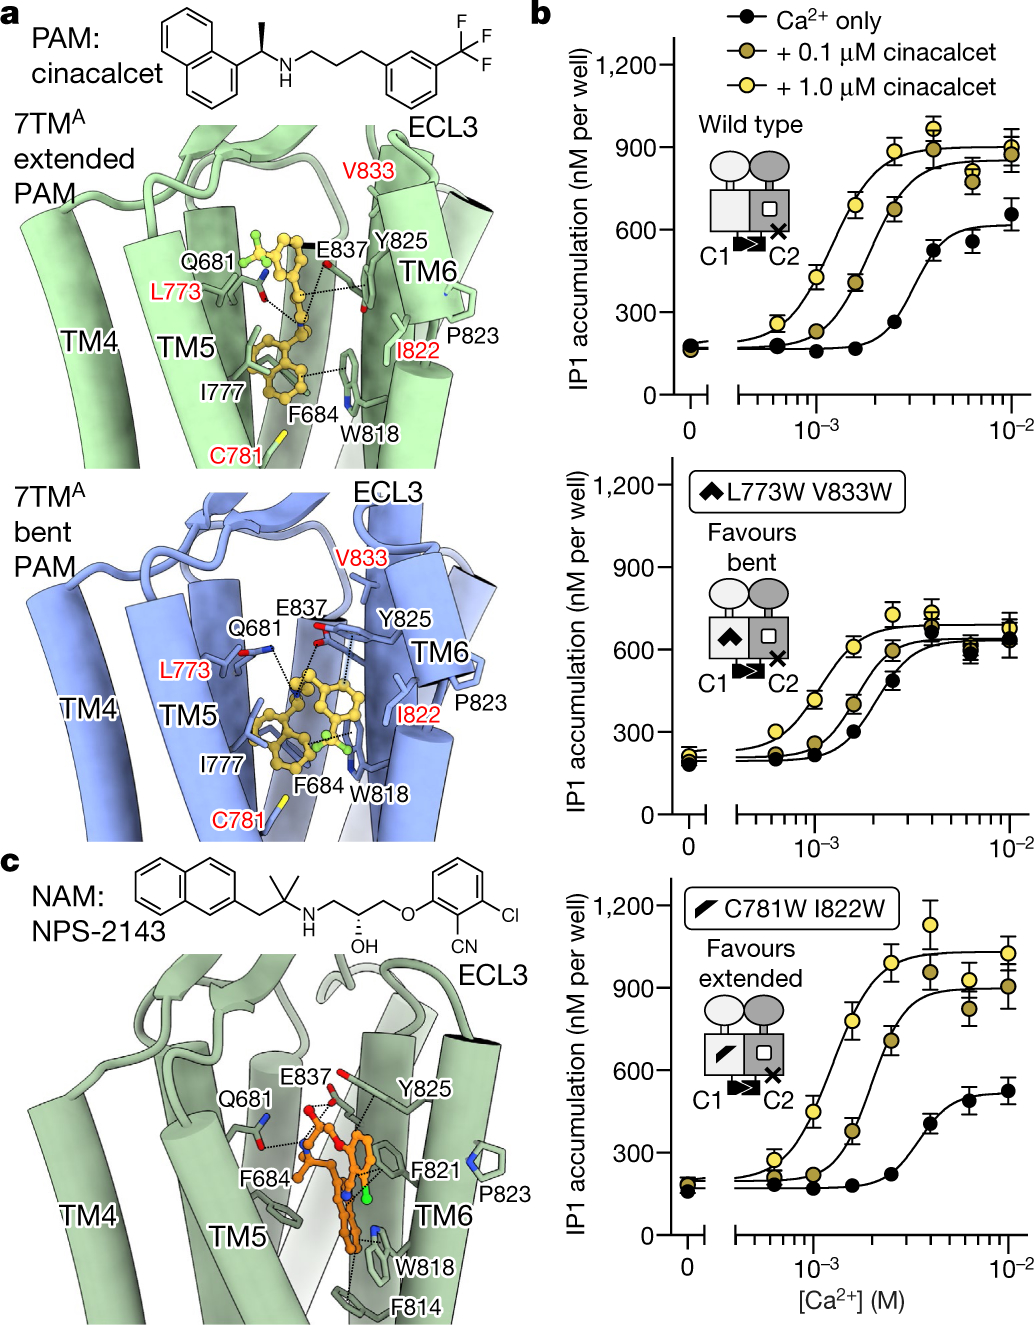
a, Top, structure of the calcimimetic (PAM) drug molecule cinacalcet. Bottom, structure of active-state CaSR 7TMs complexed with cinacalcet. b, IP1 accumulation assays monitoring Ca2+ responses for wild-type or PAM-conformer-occlusion mutants of the CaSR heterodimer with GABAB receptor C-terminal tails, in the absence or presence of the PAM cinacalcet. Data are mean ± s.e.m. from five independent experiments each performed in duplicate. c, Top, structure of the calcilytic (NAM) drug molecule NPS-2143. Bottom, binding mode of NPS-2143 in the CaSR–NAM–Ca2+–Trp 7TM.
Extended PAM favours G protein coupling
Family C GPCR dimers have been proposed to engage one G protein at a time20,21. The observed active-state CaSR asymmetry suggests that one protomer is primed to couple to the G protein, in agreement with our active structures of mGlu2 alone and complexed with Gi22. To determine which CaSR 7TM domain is primed for G-protein-coupling we used the quality control system of heterodimeric type B GABA (γ-aminobutyric acid) receptors23 (GABAB receptors) to display a CaSR heterodimer at the plasma membrane (Fig. 3b, Extended Data Fig. 8b). We fused the C-terminal coiled-coil domain of either GABAB1 or GABAB2 receptors, together with an endoplasmic reticulum retention sequence (KKTN) to the C terminus of CaSR, resulting in CaSR-C1 and CaSR-C2 constructs. Cell-surface enzyme-linked immunosorbent assays verified that only a CaSR heterodimer could reach the cell surface with equivalent expression and membrane localization levels (Extended Data Fig. 8b). Aiming to directly probe the effects of PAM-binding perturbations in Gq signalling at the CaSR-C1 protomer, we introduced E8377.38A and F801ICL3A mutations, which block PAM binding19 and G-protein coupling21 at the CaSR-C2 protomer (Fig. 3b). We then introduced mutations to CaSR-C1, sterically occluding either bent (C7815.48W/I8226.54W, favouring extended) or extended (L7735.40W/V8337.28W, favouring bent) PAM conformations (Fig. 3a, b, Extended Data Fig. 8c). Both mutant heterodimers responded to Ca2+ similarly to the wild type, confirming that the mutants were functional (Fig. 3b). In the presence of cinacalcet, the wild-type construct displayed an expected increase in maximal signalling capacity (Emax) and leftward shift of the Ca2+-response curve. By contrast, the mutant favouring the bent PAM conformation showed a substantially blunted PAM enhancement, whereas the mutant favouring the extended PAM displayed an increase in PAM enhancement compared with the wild-type (Fig. 3b). These results suggest that 7TMA, with an extended PAM, is favoured in G-protein coupling. Of note, TM6 of 7TMA is positioned higher than the juxtaposed TM6 of 7TMB (Fig. 2b, c, Extended Data Fig. 7a) in a fashion analogous to the TM6 configuration in both active-state and G-protein-coupling mGlu2 structures22 (Extended Data Fig. 9b, c).
A difference in G-protein-coupling propensities of 7TMA and 7TMB is also supported by observations related to CaSR C termini. Although disordered in 7TMA, an ordered C terminus encompassing residues 877–888 in 7TMB is observed sequestered in detergent micelles (Fig. 2a, Extended Data Fig. 9a). Previous studies have shown this region to be essential for CaSR signalling through Gq24. Furthermore, our mGlu2–Gi complex structure illustrates the critical role of the C terminus in G-protein coupling22. Notably, superposition of the mGlu2 G-protein-coupling 7TM onto CaSR 7TMA with extended PAM shows that they adopt similar conformations, with the G protein well accommodated on a membrane plane (Extended Data Fig. 9c). The 7TM asymmetry in CaSR is more pronounced than in mGlu2, with 7TMB tilting further to sequester its C terminus on the membrane, probably precluding G-protein coupling on 7TMB.
NAM binding in symmetric CaSR 7TMs
The inactive-state CaSR is highly flexible, limiting the overall achievable resolution of our structure to 4.1 Å, with local 7TM and ECD refinements reaching 3.9 Å and 3.7 Å, respectively (Extended Data Fig. 4a, b). Inactive-state CaSR displays symmetric 7TMs, in which we observe clear densities for the NAM NPS-2143 and surrounding residues (Extended Data Figs. 1g, 4a, 6g, h). To understand NAM inhibition under activating conditions, we purified CaSR in the presence of NPS-2143 with high concentrations of Ca2+ and Trp (CaSR-NAM-Ca2+-Trp) and obtained its cryo-EM structure (Extended Data Figs. 1h, 4c, d). The ECD of CaSR–NAM–Ca2+–Trp is identical to the active-state (r.m.s.d. = 0.3 Å), and the higher rigidity enabled us to achieve 3.2 Å global resolution. The conformation of the NAM-bound 7TMs agrees well with the inactive-state structure (Fig. 3c, Extended Data Fig. 6e, g, h). Notably, unlike the asymmetric 7TMs configuration observed in the active-state, the NAM-bound 7TMs are fully symmetric (Fig. 4a, Extended Data Fig. 6f) and the 7TM interface is distinct from the asymmetric interface observed in active-state CaSR (Fig. 4b, Extended Data Fig. 6b, f). When one 7TM of CaSR–NAM–Ca2+–Trp is aligned onto the active-state 7TMB, the other 7TM is positioned away from 7TMA (Fig. 4b). The NAM NPS-2143 shares a similar molecular architecture with the phenylalkylamine PAMs and binds through comparable polar interactions with Q6813.33 and E8377.32 (Fig. 3c). In our IP1 accumulation assays, Q6813.33A substantially attenuated CaSR inhibition by NPS-2143 (Extended Data Fig. 8a), whereas E8377.32A has previously been shown to blunt the NAM effect of NPS-214319. However, there are two key differences between the NAM and PAM (Fig. 3a, c). The longer linker between the secondary amine and the benzonitrile group allows the NAM to interact with F8216.53 and Y8256.57, and the addition of a quaternary carbon angles the naphthyl group towards a hydrophobic TM6–TM7 cleft forming π–π interactions with F8216.53 and F8146.46, thereby locking W8186.50 in an outward-facing conformation (Fig. 3c). These interactions probably rigidify the top of TM6, preventing the formation of the staggered active-state asymmetric interface.
Fig. 4 |. Symmetric configuration of CaSR–NAM–Ca2+–Trp 7TMs and the TM6 toggle switch.
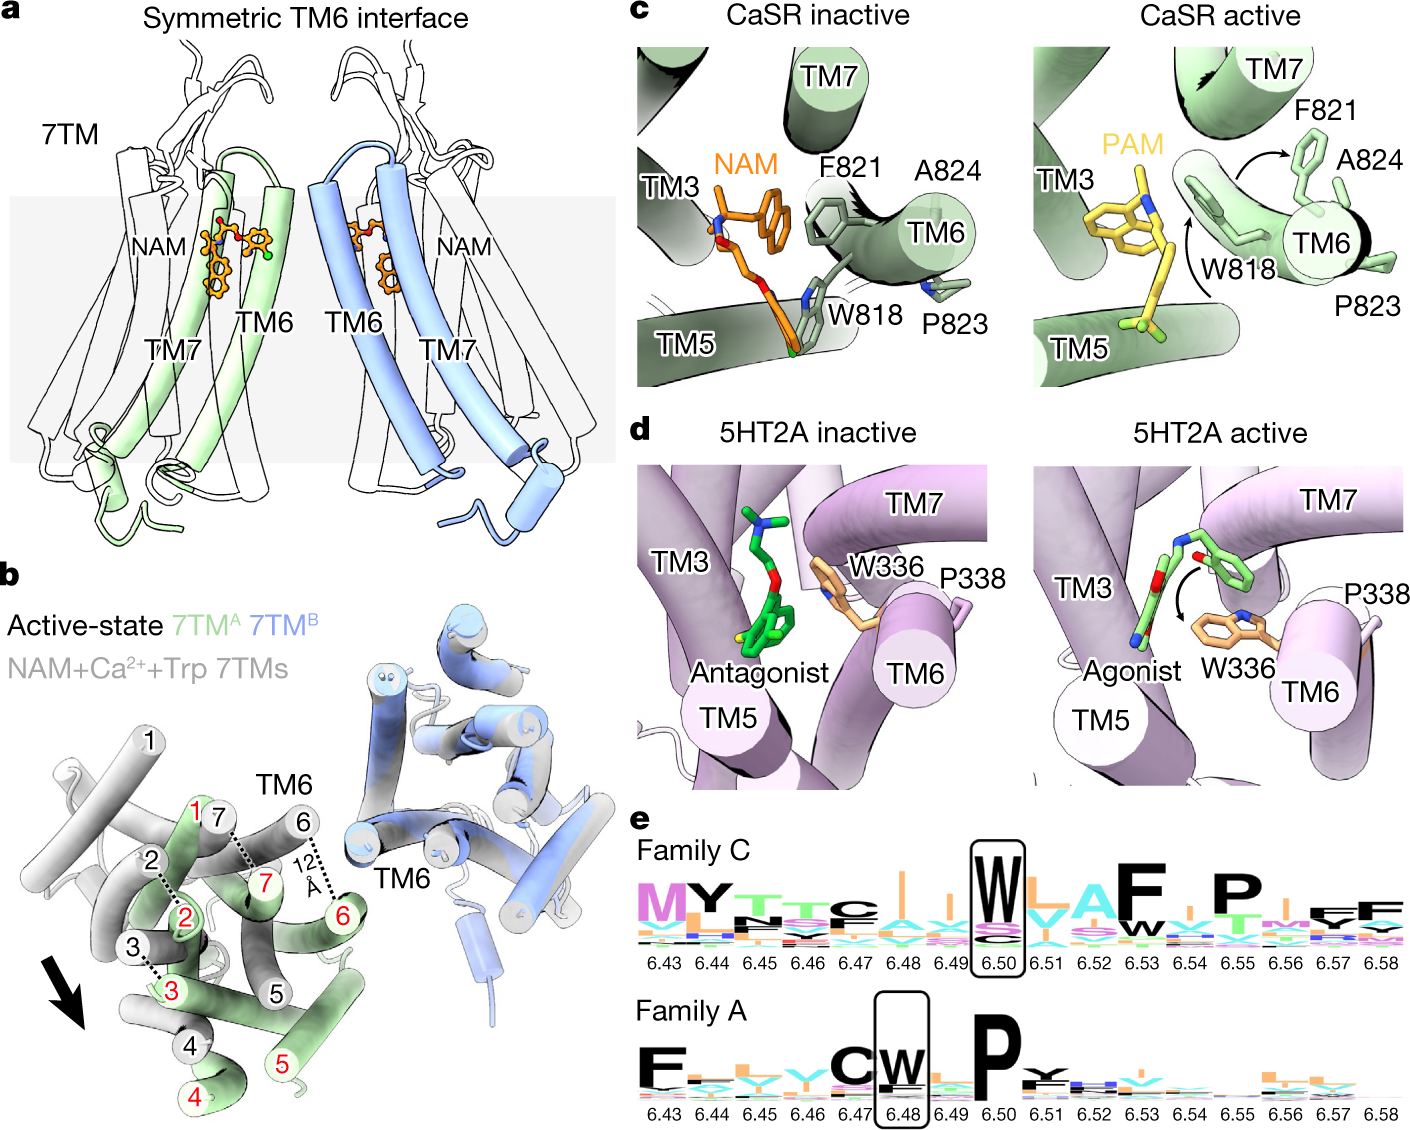
a, Overall structure of the symmetric CaSR–NAM–Ca2+–Trp 7TMs. b, Comparison of the symmetric CaSR–NAM–Ca2+–Trp 7TMs (grey) and the asymmetric PAM-bound 7TMs (7TMA (green) and 7TMB (blue)) based on 7TMB alignment. c, Conformational changes in CaSR TM6. d, Conformational changes in the 5HT2A serotonin receptor (Protein Data Bank (PDB): 6A94 and 6WHA), a family A GPCR that couples to Gq in a similar way to CaSR. e, Sequence logo analysis of family C and family A TM6 regions highlighting the conservation of toggle switch motif residues.
Distinct toggle switch in family C GPCRs
The most notable differences between inactive and active-state CaSR 7TMs lie in TM6 (Figs. 3a, c, 4c). Upon activation, TM6 forms a kink at P8236.55 and the cytoplasmic half of the helix rotates inwards, as evident in the F8216.53 and W8186.50 conformations. F8216.53 inserts into a TM6–TM7 hydrophobic cleft, and W8186.50 is pushed inwards by π–π interactions with PAMs. By contrast, in the inactive state, TM6 forms a continuous α-helix. NAM pushes W8186.50 to face outwards, while stabilizing F8216.53 towards TM5. P8236.55A, which would hinder TM6-kink formation, has been shown to ablate Ca2+ response by CaSR25, whereas A8246.56P and F8216.53L—which would facilitate TM6-kink formation and ease the inward rotation of TM6, respectively—are activating ADH mutations17,26. Furthermore, F8216.53A has been shown to impair NAM inhibition while enhancing PAM potentiation19. These observations point to the importance of the TM6 region surrounding W8186.50 in CaSR activation and modulator binding. W6.50 is highly conserved in family C GPCRs, forming a TM6 toggle switch motif (WxxFxP) reminiscent of the CWxP6.50 motif surrounding the W6.48 toggle switch in family A GPCRs27 (Fig. 4e). The family A toggle switch W6.48 is displaced to drive the opening of TM6 at the cytoplasmic end (Fig. 4d). However, the CaSR toggle switch W6.50 moves in a distinct direction, transiting from outward facing to inward facing upon activation (Fig. 4c). Consequently, the cytoplasmic half of TM6 rotates inwards rather than tilting outwards. Notably, crystal structures of NAM-bound inactive mGlu1 and mGlu5 7TMs reveal outward-facing W6.50 conformations similar to inactive CaSR28,29. Furthermore, in mGlu2–Gi, W6.50 points inward in the Gi-coupling protomer22. Thus, family C GPCRs use a distinct mechanism to couple to G proteins compared with most family A GPCRs, characterized by W6.50 toggle switch moving inward upon activation.
Conclusion
Our cryo-EM structures of CaSR in distinct states reveal that receptor activation engenders intrinsic 7TM asymmetry in the homodimer that favours one protomer for G-protein coupling. 7TM PAM binding stabilizes this asymmetry whereas NAM binding locks the 7TMs in a symmetric configuration (Extended Data Fig. 10). Furthermore, comparison between inactive and active CaSR structures reveals that the TM6 toggle switch, which is conserved across a large number of GPCRs, moves in a different direction upon activation compared with those of many family A GPCRs. Moreover, our structures reveal at high resolution how various drug molecules target CaSR at either the 7TM or the ECD, illustrating the intricate binding mechanisms of CaSR allosteric modulators and yielding valuable insights for the design of improved therapeutics.
Online content
Any methods, additional references, Nature Research reporting summaries, source data, extended data, supplementary information, acknowledgements, peer review information; details of author contributions and competing interests; and statements of data and code availability are available at https://doi.org/10.1038/s41586-021-03691-0.
Methods
No statistical methods were used to predetermine sample size. The experiments were not randomized. The investigators were not blinded to allocation during experiments and outcome assessment.
Expression and purification of CaSR
Human CaSR (Uniprot: P41180, residues 20–894) with N-terminal influenza haemagglutinin (HA) signal sequence (MKTIIALSYIFCLVFA) followed by Flag tag (DYKDDDDK) and three Ala linker (replacing the native signal sequence, residues 1–19) was cloned into either the BamH1 site of a pFastBac1 vector (Invitrogen) (for insect cell expression) or the BamH1 site of a pcDNA3.1(+) vector (Thermo Fisher) (for transient transfection of HEK293 cells in cell signaling assays described in subsequent sections) with InFusion cloning (Takara Bio). CaSR has a large extended C-terminal domain (residues 864–1078) that is predicted to be unstructured. Most of the flexibile CaSR C terminus (residues 895–1078) was removed in our construct. Previous studies have shown that truncation at a position (888) that is N-terminal to our truncation site (894) has no effect on CaSR signalling24 and cell-signalling assay results monitoring either direct G protein-coupling or downstream signalling (IP1 accumulation) show that our CaSR expression construct is fully functional (Extended Data Fig. 1b–f).
CaSR was expressed in Spodoptera frugiperda Sf9 cells (Expression Systems, authenticated by supplier, not tested for mycoplasma) using the Bac-to-Bac system (Invitrogen). Sf9 cells cultured in ESF921 medium to a density of 3.0 × 10⁶ cells·ml−1 were infected with 1% culture volume of P2 baculovirus. Cells were harvested 48–60 h after infection and washed once with HBS (20 mM HEPES 7.5, 150 mM NaCl). The pellets were snap-frozen in liquid nitrogen and stored at −80 °C.
For the purification of inactive-state CaSR, cell pellets were thawed in HBS with 0.5 mM CaCl2, 1 mM sodium phosphate (pH 7.5), protease inhibitors, benzonase and 20 μM NPS-2143 (CAS Number 324523–20-8, Cayman Chemical 17903, prepared as a 20 mM DMSO stock), and lysed by nitrogen cavitation at 600 psi. The lysate was centrifuged at 1,000g for 10 min to remove unbroken cells and nuclei, and the membrane fraction was harvested by centrifugation at 100,000g for 30 min and solubilized in the same buffer with the addition of 1% n-dodecyl-β-maltoside (DDM) and 0.2% CHS for 2 h, followed by centrifugation at 100,000g for 30 min. The resulting supernatant was collected and incubated with anti-DYKDDDDK G1 affinity resin (GenScript) for 2 h or overnight using a batch process. The resin was washed in the same buffer with 0.1% DDM, 0.02% CHS three times and transferred onto a gravity flow column. The column was washed with 10 column volumes of the same buffer and then the detergent was gradually exchanged to 0.1% GDN, 0.01% CHS. The detergent concentration was then lowered to 0.005% GDN, 0.0005% CHS and Flag-tagged CaSR was eluted from the column with the same buffer containing 0.2 mg ml−1 Flag peptide (GenScript). The eluate was concentrated to 500 μl with a 100-kDa MWCO Amicon concentrator (Millipore Sigma) and injected onto a Superose6 column preequilibrated with buffer containing 20 mM HEPES 7.5, 150 mM NaCl, 0.5 mM CaCl2, 1 mM sodium phosphate (pH 7.5), 20 μM NPS-2143 and 0.005% GDN, 0.0005% CHS. Peak fractions were pooled and concentrated to about 7 mg ml−1 with a 100-kDa MWCO concentrator.
The CaSR–NAM–Ca2+–Trp complex was purified in a similar procedure as for the inactive state with the only difference being that 10 mM CaCl2, 10 mM L-Trp, instead of 0.5 mM CaCl2, 1 mM sodium phosphate (pH 7.5), was used throughout the lysis, solubilization and purification.
The active-state CaSR was purified in a similar procedure as for the inactive state. The only difference is that 10 mM CaCl2, 10 mM L-Trp and 20 μM of cinacalcet (CAS Number 364782–34-3, Sigma-Aldrich SML2012, prepared as a 20 mM DMSO stock) or a combination of 20 μM of evocalcet (CAS Number 870964–67-3, MedChem Express HY-17613, prepared as a 20 mM DMSO stock) and 50 μM etelcalcetide (CAS Number 1334237–71-6, Cayman Chemical 26901, prepared as a 0.1 mg ml−1 stock in HBS), instead of 0.5 mM CaCl2, 1 mM sodium phosphate (pH 7.5) and 20 μM NPS-2143, were used throughout the lysis, solubilization and purification.
Cryo-EM data collection and processing
Three microlitres of inactive- or active-state CaSR or CaSR–NAM–Ca2+–Trp at 7 mg ml−1 was applied to freshly glow-discharged 300-mesh R1.2/R1.3 UltrAuFoil holey gold grids (Quantifoil) under 100% humidity at 4 °C. Excess sample was blotted away for 3 s, and the grids were subsequently plunged-frozen into liquid ethane using a Vitrobot Mark IV (Thermo Fisher Scientific) and then stored in liquid nitrogen. For the inactive- or active-state CaSR grids, cryo-EM data was collected on a Titan Krios electron microscope (Thermo Fisher Scientific - FEI) operating at 300 kV with a calibrated magnification of ×81,000, corresponding to a pixel size of 1.11 Å. Micrographs were recorded using a K3 direct electron camera (Gatan) with a dose rate of 16.23 electrons·Å−2·s−1 and defocus values ranging from −0.7 μm to −1.5 μm. The total exposure time was 4 s and intermediate frames were recorded in 0.05 s intervals, resulting in an accumulated dose of 64.9 electrons·Å−2 and a total of 80 frames per micrograph. For the CaSR–NAM–Ca2+–Trp grid, cryo-EM data was collected on a Titan Krios electron microscope (Thermo Fisher Scientific, FEI) operating at 300 kV with a calibrated magnification of ×105,000, corresponding to a pixel size of 0.8677 Å. Micrographs were recorded using a K3 direct electron camera (Gatan) with a dose rate of 24.36 electrons·Å−2·s−1 and defocus values ranging from −0.8 μm to −1.8 μm. The total exposure time was 2.5 s and intermediate frames were recorded in 0.05 s intervals, resulting in an accumulated dose of 60.9 electrons·Å−2 and a total of 50 frames per micrograph. Cryo-EM data processing was done in cryoSPARC v3.0 (inactive- or active-state CaSR) or v3.1 (CaSR–NAM–Ca2+–Trp)30 (Extended Data Fig. 2). Dose-fractionated image stacks were subjected to beam-induced motion correction and filtering with patch motion correction and contrast transfer function (CTF) parameters were refined with patch CTF refinement. Auto-picked particle projections were extracted and subjected to several rounds of reference-free 2D classification. Five initial models were generated for each dataset with 3D ab initio reconstruction and the particles were subjected to several rounds of 3D heterogeneous refinement to remove particles populating poorly defined classes. Particles from conformationally homogeneous groups were then subjected to local motion correction, followed by local and global CTF refinement. Subsequently, the particles were subjected to several rounds of further 2D classification and 3D heterogeneous refinement. The resulting particles were refined with nonuniform refinement31 followed by local nonuniform refinement with a soft mask around either the ECD or 7TM regions (Extended Data Figs. 3, 4). For the CaSR–NAM–Ca2+–Trp, local refinement without symmetry at the 7TMs yielded a fully symmetric map at 3.4 Å, and C2 symmetry was then applied to subsequent refinement of this region improving the resolution to 3.3 Å (Extended Data Fig. 4).
We carried out 3D variability analysis32 in cryoSPARC v3.0 with particles after local motion correction (inactive-state CaSR dataset) or after local and global CTF refinement (dataset of active-state CaSR with evocalcet and etelcalcetide). The particles were subjected to one round of 2D classification and then subjected to nonuniform refinement to generate the 3D reference and mask for the 3D variability analysis with three principal components. The series of frames from motions corresponding to each principal component were visualized as movies in UCSF Chimera33 (Supplementary Videos 1–3 for inactive CaSR and Supplementary Videos 4–6 for active CaSR). In the inactive state, CaSR is relatively flexible, and our structure reveals an asymmetric open-closed conformation of the ECD stabilized by what appears to be an aromatic amino acid or its derivatives. Given that a previous crystal structure of the inactive CaSR ECD depicts a symmetric open-open conformation, it is possible that the receptor exists in an equilibrium of these two conformations under low calcium conditions (Extended Data Fig. 10). Indeed, our 3D variability analysis of inactive-state CaSR reveals significant breathing of the VFTs accompanied by back-and-forth flexing relative to the 7TMs (Supplementary Videos 1–3). The same analysis for the active state shows that the VFTs adopt a rigid closed-closed conformation and flex around the CRDs (Supplementary Videos 4–6). Interestingly, the first principal component of the movements in the active state (Supplementary Video 4) reveals a tug-of-war like motion of the 7TMs alternatively pushing each other to adopt a tilted conformation, reminiscent to the bent PAM protomer in our structures that disfavours G protein-coupling. This motion suggests that 7TMs may stochastically alternate to activate one G protein at a time, a mechanism previously proposed for various family C GPCRs based on cell signaling studies20,21,34.
Model building and refinement
The crystal structures of active and inactive CaSR ECD6 (PDB: 5K5S and 5K5T) together with homology models of CaSR 7TM based on the active and inactive mGlu5 cryo-EM structures8 (PDB: 6N51 and 6N52) calculated with SWISS-MODEL35 were used as initial models and manually docked into cryo-EM densities with Chimera33. The models were then subjected to iterative rounds of automated refinement using Phenix real space refine36, and manual building in Coot37. Poses of small molecule PAMs and NAM were generated with GemSpot18 and the model of the poly-D peptide etelcalcetide was manually built in Coot. The final models were subjected to global refinement and minimization in real space in Phenix. Validation was performed in MolProbity38 and EMRinger39. The refinement statistics are provided in Extended Data Table 1.
BRET2 assays for CaSR–Gq signalling
BRET2 assays were performed using TRUPATH reagents as previously described40 with some modifications. HEK 293S cells in FreeStyle suspension media (Thermo Fisher, authenticated by supplier, not tested for mycoplasma) were transiently transfected at a density of 1 million cells·per ml with a 1:1:1:1 ratio of CaSR (pcDNA 3.1 (+) construct described in the first method section): Gα–RLuc8: Gβ: Gγ–GFP, using polyethyleneimine. Cells were harvested by centrifugation 48 h later and resuspended in assay buffer (HBSS + 20 mM HEPES pH 7.5) at a density of 1.25 million cells·ml−1, which was then plated in white 96-well assay plates (Corning) at 40 μl per well. After the addition of 20 μl of freshly prepared 30 μM coelenterazine 400a (GoldBio), plates were incubated for five minutes, treated with 30 μl of ligand for an additional 5 min, and read in a SpectraMax iD5 plate reader (Molecular Devices) with 410-nm and 515-nm emission filters with a 1 s per well integration time. BRET2 ratios (Net BRET) were calculated as the ratio of GFP2 emission (515 nm) to RLuc8 emission (410 nm) and analysed in GraphPad Prism version 9.0.0 for Mac (GraphPad Software).
IP1 assay for profiling of allosteric modulators
HEK 293 cells (ATCC CRL-1573, authenticated by supplier, routinely tested for mycoplasma) were cultured in DMEM (Gibco, Thermo Fisher Scientific) supplemented with 10% v/v dFBS and 1% v/v at 37 °C, and 5% CO2. The cells were transiently transfected with the pcDNA 3.1 (+) construct encoding human CaSR (20–894 with N-terminal HA signal sequence, Flag tag and a three-Ala linker) using linear PEI as transfection reagent (250 ng vector DNA per million cells; 1:4 ratio with PEI). 24 h post transfection, cells (40,000 cells per well) were seeded in poly-D-lysine treated 96-well tissue culture plates (Corning) and incubated overnight at 37 °C and 5% CO2. The IP1 experiments were performed using the IP-One assay (Cisbio) as previously described21. In brief, cells were washed once with HBSS (no Ca, Mg, Gibco 14175) supplemented with 20 mM HEPES pH 7.4 and then incubated with compounds prepared in the same buffer additionally supplemented with 20 mM LiCl for 30 min at 37 °C. After incubation, the cells were washed with assay buffer and lysed using IP-One Conjugate & Lysis buffer (Cisbio). Cell lysates (10 μl per well) were subsequently transferred to a 384-well Optiplate (Perkin Elmer), after which (10 μl per well) detection solution (lysis buffer, 2.5% v/v anti-IP1 antibody–cryptate Terbium conjugate, 2.5% v/v IP1–d2 conjugate) was added to the cell lysates. The plate was incubated for 1 h at room temperature (in the dark) and subsequently measured on the Envision plate reader (Perkin Elmer).
Generation of forced CaSR dimer constructs and mutagenesis
The pcDNA 3.1(+) construct encoding human CaSR as described in the first method section was used as the template for the generation of CaSR constructs with either GABAB1 or GABAB2 C terminus (C1 or C2). For the CaSR-C1 construct, DNA encoding the sequence of TGSSTNNNEEEKSRLLEKENRELEKIIAEKEERVSELRHQLQSRQQLKKTN (KKTN is the endoplasmic reticulum retention sequence) was inserted in between CaSR residue 894 and the stop codon with restriction-free (rf) cloning41. For the CaSR-C2, a TSTSVTSVNQASTSRLEGLQSENHRLRMKITELDKDLEEVTMQLQDTPEKKTN sequence was inserted in between CaSR residue 894 and the stop codon and the N-terminal Flag tag was replaced with a HA epitope tag (YPYDVPDYA). Point mutations used in this study were generated with rf cloning41.
IP1 assay for expression of forced CaSR dimers
To determine the functional response of specific combinations of CaSR dimer mutants at the cell surface, HEK293 cells (ATCC CRL-1573, authenticated by supplier, routinely tested for mycoplasma) were transfected with Flag-tagged CaSR-C1 and HA-tagged CaSR-C2 constructs using FuGene6 (Promega E2692) transfection reagent essentially as described previously42. The absolute amounts of DNA used for each Flag-tagged CaSR-C1 or HA-tagged CaSR-C2 constructs or their combinations were varied to obtain equal expression levels of the respective CaSR dimer mutants at the cell surface (amounts given in Extended Data Fig. 8b). For the Q681A mutation experiments, DNA amount used for the Flag-tagged wild-type and Q681A constructs were 0.015 μg. The total amount of DNA was always 1 μg DNA for each 1 ml of transfected cell suspension and was, if needed, supplemented to 1 μg using empty vector DNA. HEK293 cells were detached and resuspended to 0.28 million cells per ml in growth medium (D-MEM, Gibco 10566016; supplemented with 10% Fetal Bovine Serum, Gibco 10270106; 1% Sodium Pyruvate, Gibco 11360039; 1% MEM Non-Essential Amino Acids, Gibco 11140068; and 1% Penicillin-Streptomycin Solution, Gibco 15140122). Following dilution of 3 μl FuGene6 into 57 μl OptiMEM (Gibco 51985) for each 1 ml of cell suspension to be transfected, the 60 μl OptiMEM/FuGene6 mixture was added to a total of 1 μg DNA in 25 μl OptiMEM and incubated for 20 min at room temperature. Then, the mixture of FuGene6 and DNA in OptiMEM was added directly to the cell suspension and seeded in poly-D-lysine coated 96-well plates at a density of 28.000 cells per well in 100 μl. The IP1 assay was performed as described above for PAM and NAM profiling, except that cells were incubated with Ca2+ in absence or presence of PAM for 45 min at 37 °C, and cells were lysed in 40 μl IP-One Conjugate & Lysis buffer (Cisbio).
Cell surface ELISA assay
Following transfection of the Flag-tagged CaSR-C1, HA-tagged CaSR-C2 constructs, their combinations, or Flag-tagged WT or Q681A mutant as described above, cells were seeded in white clear bottom poly-D-lysine coated 96-well plates, and assayed after 48 h. The cell-surface enzyme-linked immunosorbent assay (ELISA) to quantify the relative surface expression levels of each of the protomers of the forced mutant CaSR dimers was performed as described previously42 by detecting the relative surface expression levels of Flag-tagged C1-mutant protomers and/or HA-tagged C2-mutant protomers relative to high-expressing Flag–CaSR-WT–C1 and HA–CaSR-F801A-C2 forced dimer (Extended Data Fig. 8b). For the Flag-tagged WT and Q681A mutant surface expression levels were determined relative to the cell surface ELISA signal of an identical transfection of Flag-tagged WT (Extended Data Fig. 8a).
Reporting summary
Further information on research design is available in the Nature Research Reporting Summary linked to this paper.
Data availability
All data generated or analysed during this study are included in the Article and its Supplementary Information. Cryo-EM maps of active-state CaSR–cinacalcet, active-state CaSR–etelcalcetide–evocalcet, inactive-state CaSR–NPS2143 and CaSR–NPS2143–Ca2+–Trp have been deposited in the Electron Microscopy Data Bank under accession codes EMD-23653, EMD-23654, EMD-23655 and EMD-23652, respectively. The atomic coordinates of active-state CaSR–cinacalcet, active-state CaSR–etelcalcetide–evocalcet, inactive-state CaSR–NPS2143 and CaSR–NPS2143–Ca2+–Trp have been deposited in the Protein Data Bank under the accession codes 7M3F, 7M3G, 7M3J and 7M3E, respectively.
Extended Data
Extended Data Fig. 1 |. Functional characterizations of human CaSR and structures of NAM-bound CaSR.
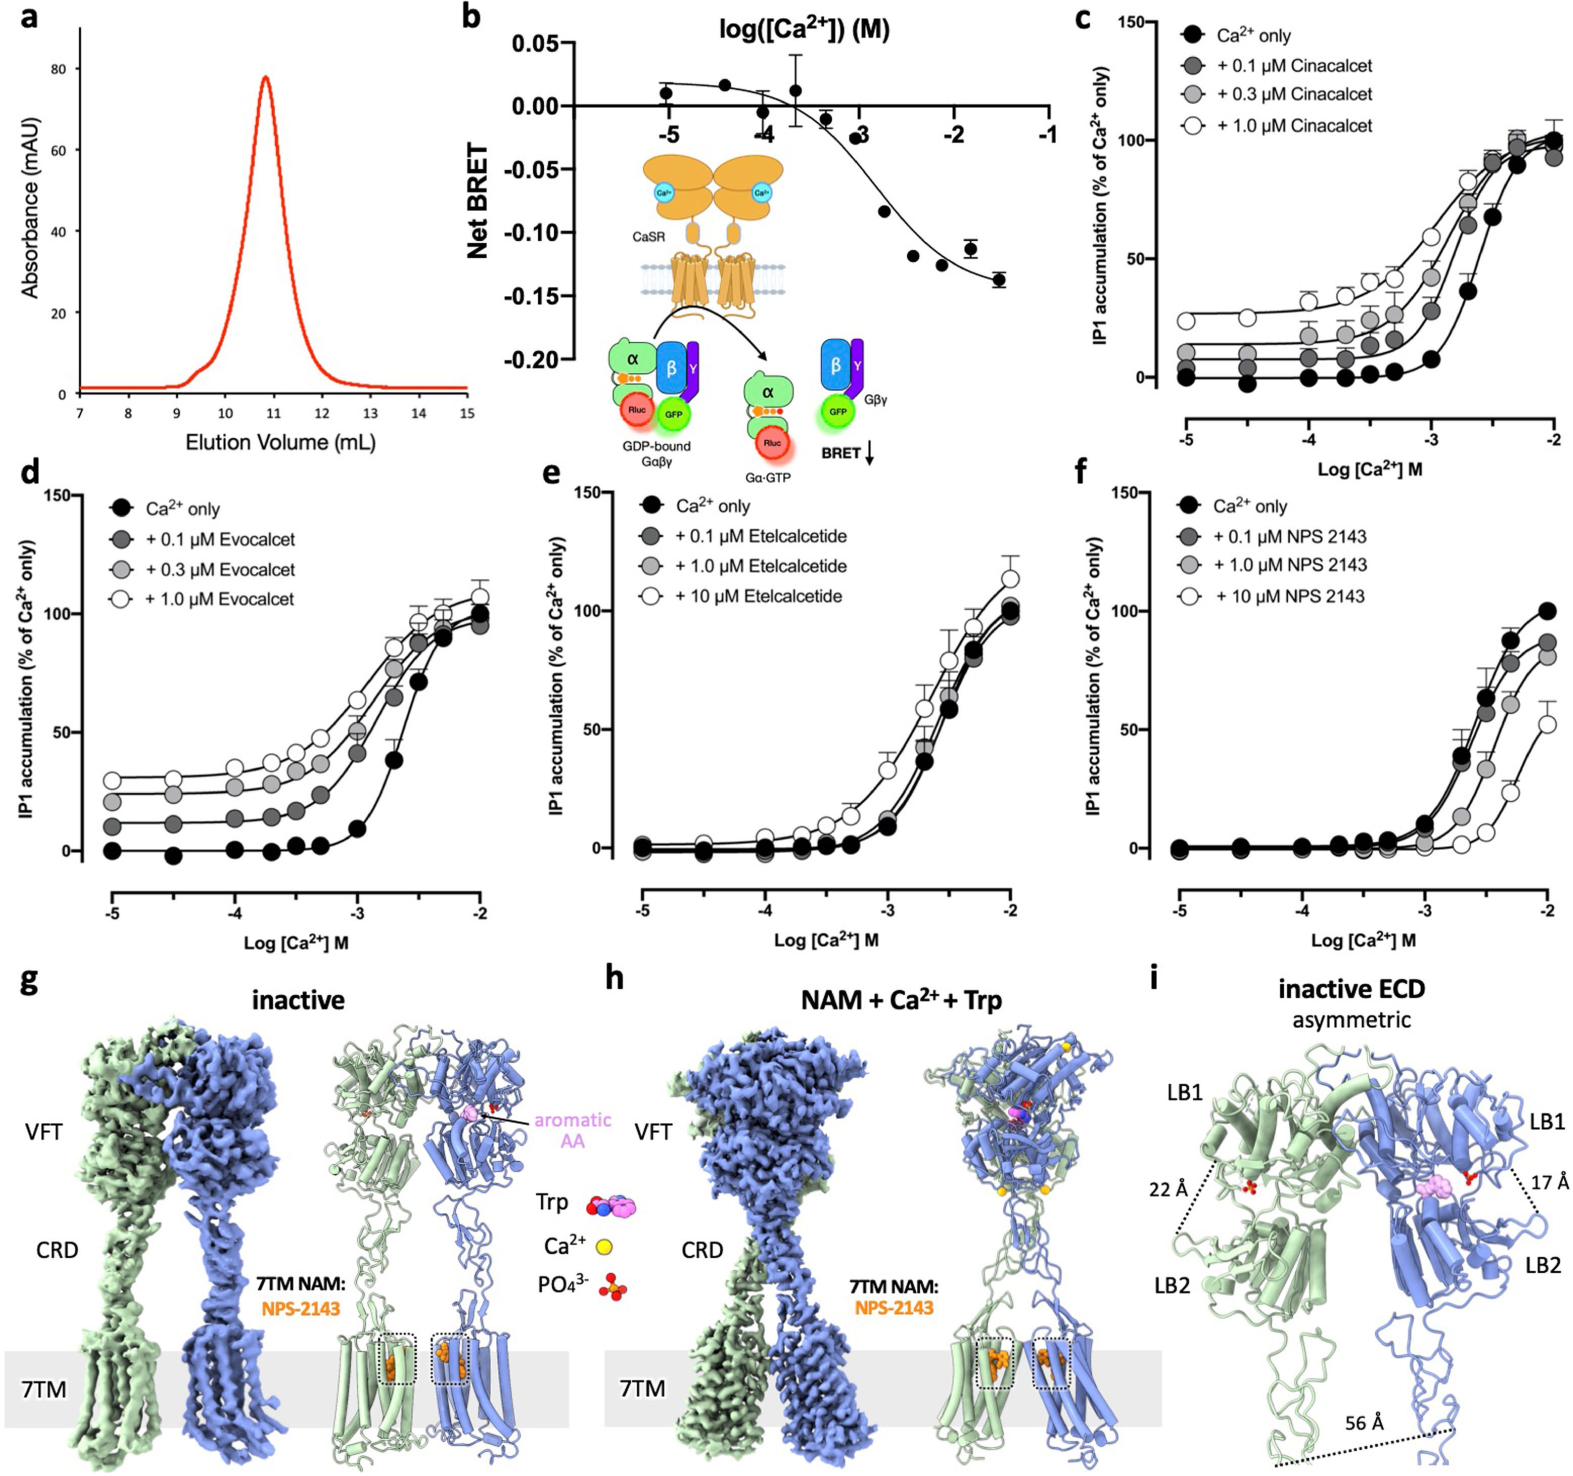
a, size-exclusion chromatography profile of purified CaSR. b, BRET-based assay40 monitoring Gq activation by CaSR upon Ca2+ addition. n = 3 independent experiments, data represent mean ± s.e.m. c–f, Functional responses of CaSR to Ca2+ alone or in combination with PAMs or NAM measured by IP1 accumulation assays. n = 3 independent experiments, data represent mean ± s.e.m. g, Cryo-EM map and model of inactive state CaSR complexed with NAM. h, Cryo-EM map and model of the CaSR-NAM-Ca2+-Trp complex. i, Structure of the inactive-state CaSR ECD region showing an open-closed inactive VFT configuration.
Extended Data Fig. 2 |. Cryo-EM data processing workflow.
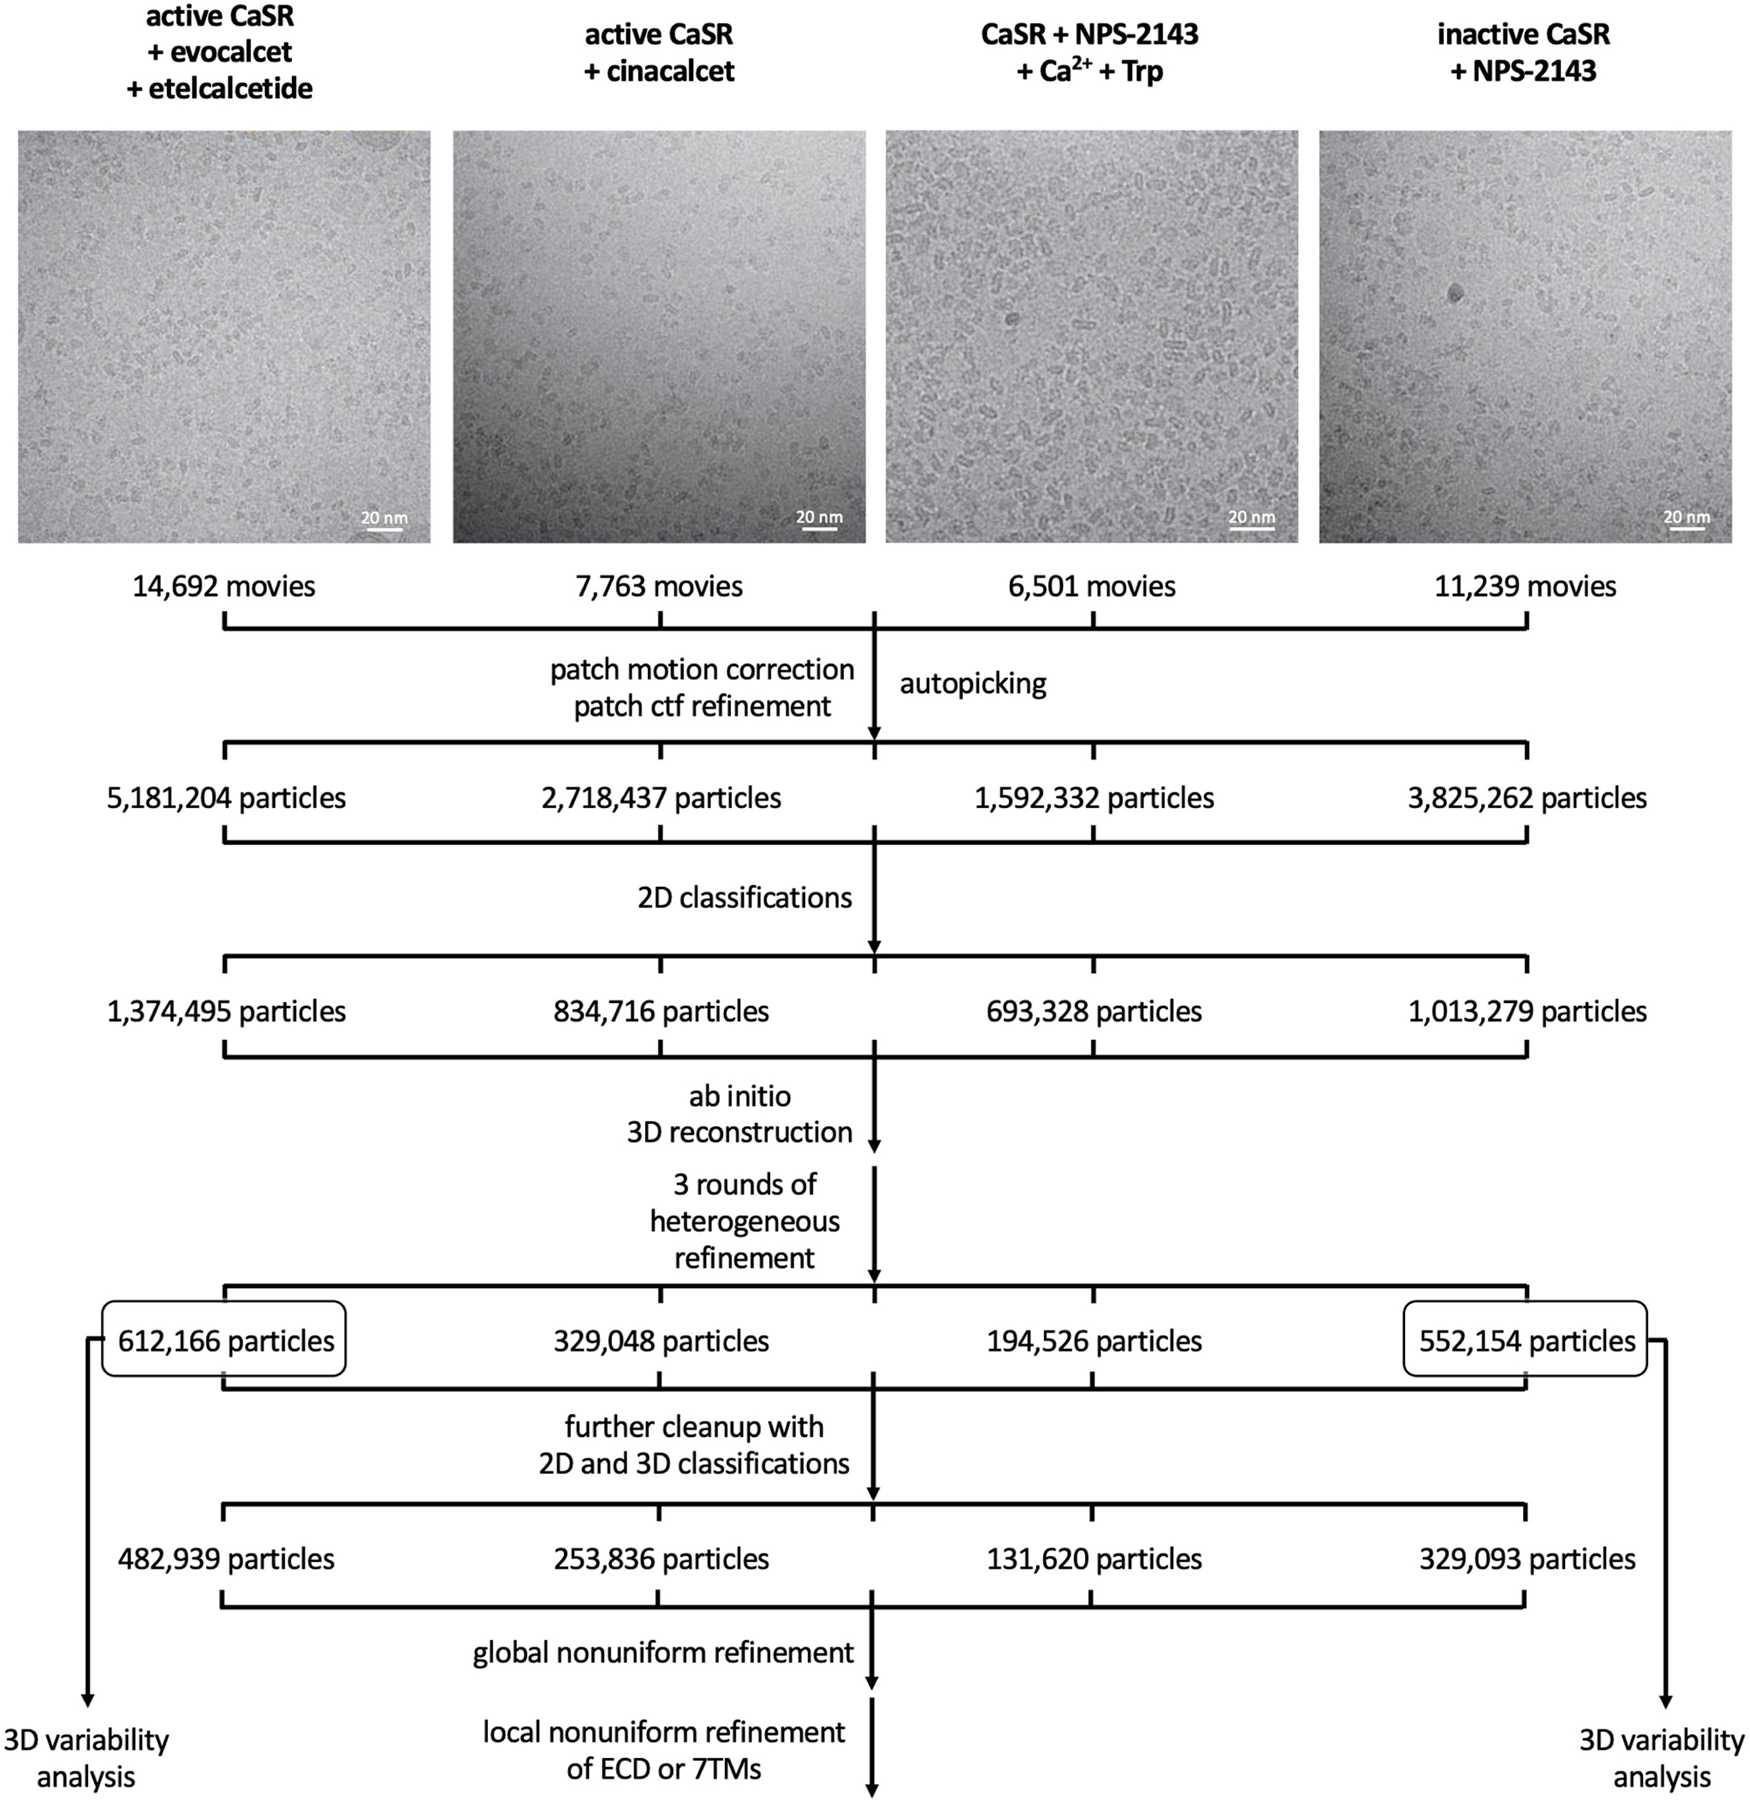
Representative cryo-EM micrographs of different CaSR complexes and flowcharts detailing data processing procedures.
Extended Data Fig. 3 |. Cryo-EM maps and FSC curves of active-state CaSR complexes.
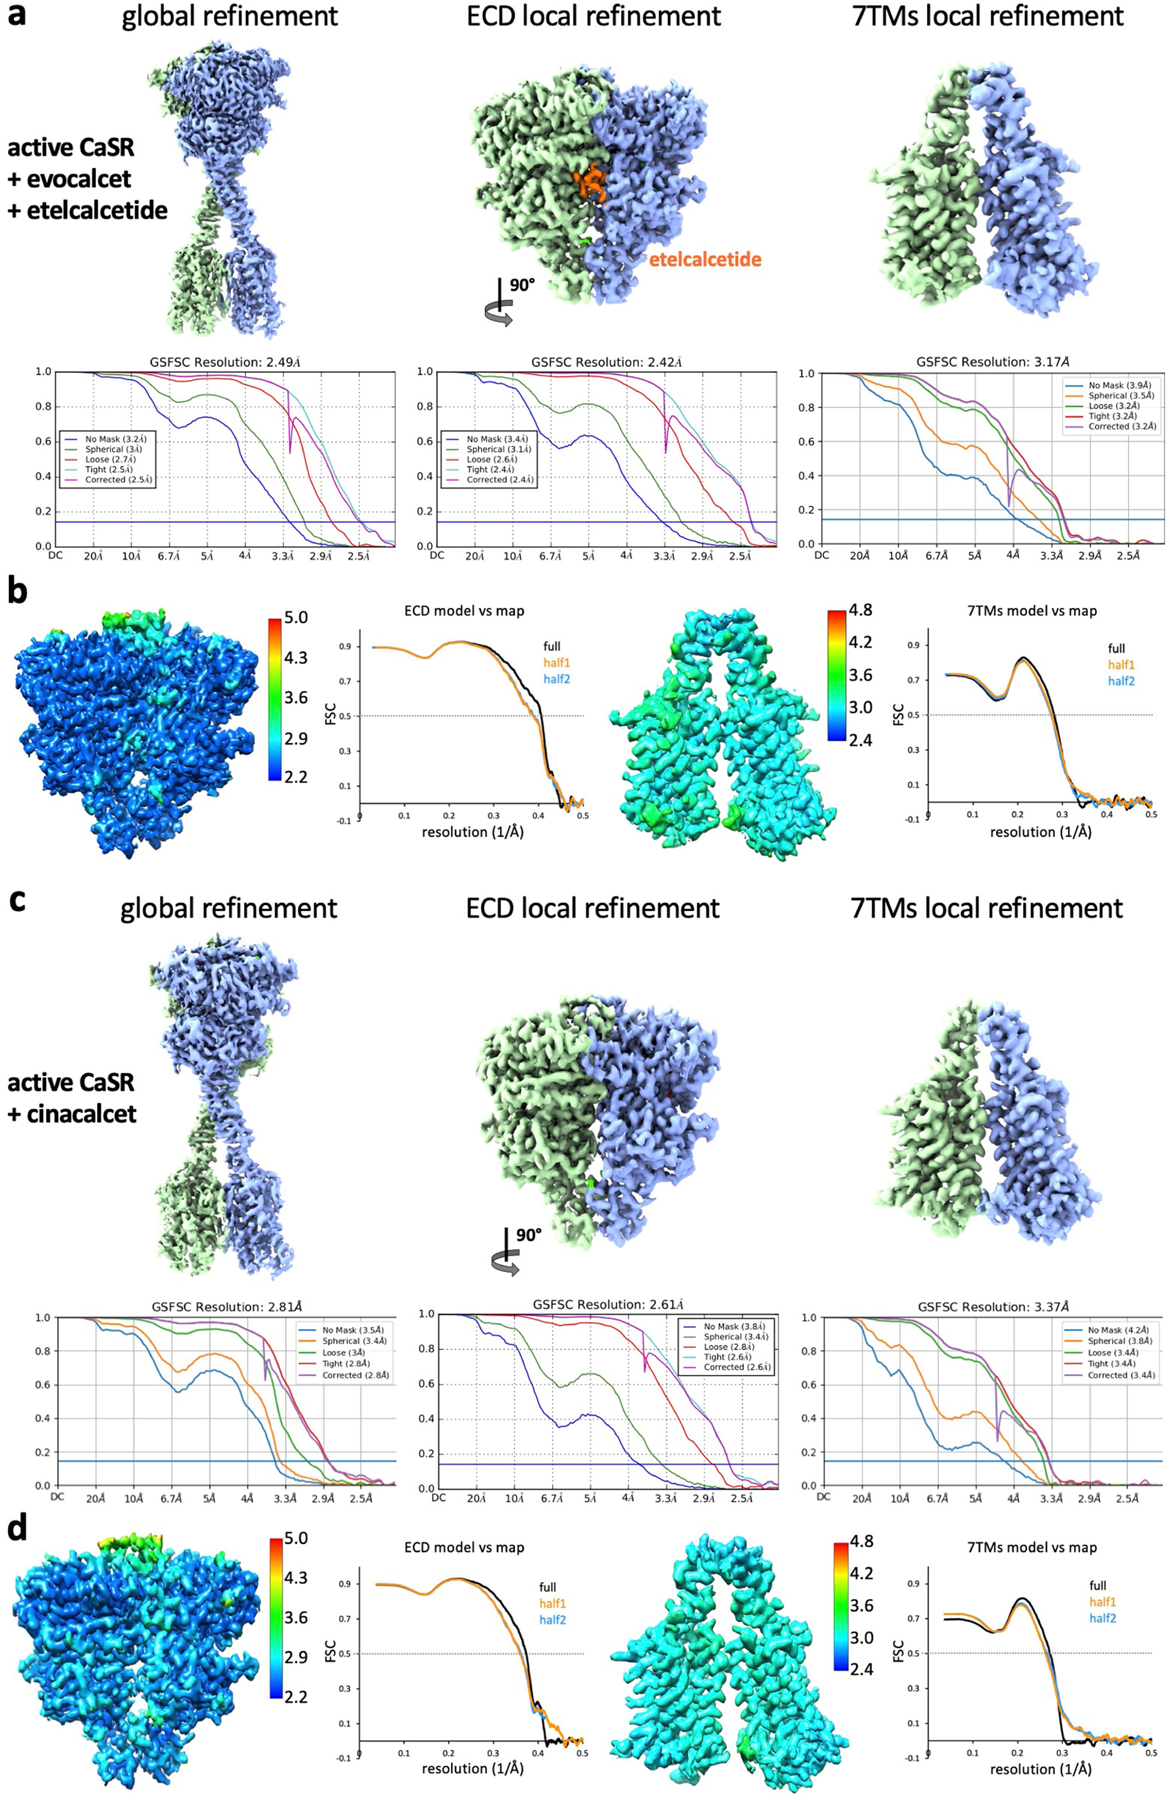
a–d, Global and local refinement maps with corresponding FSC curves indicating nominal resolutions using the FSC = 0.143 criterion, model-vs-map FSC curves and local resolution maps of CaSR-etelecacetide-evocalcet (a, b) and CaSR-cinacalcet (c, d).
Extended Data Fig. 4 |. Cryo-EM maps and FSC curves of NAM-bound CaSR complexes.
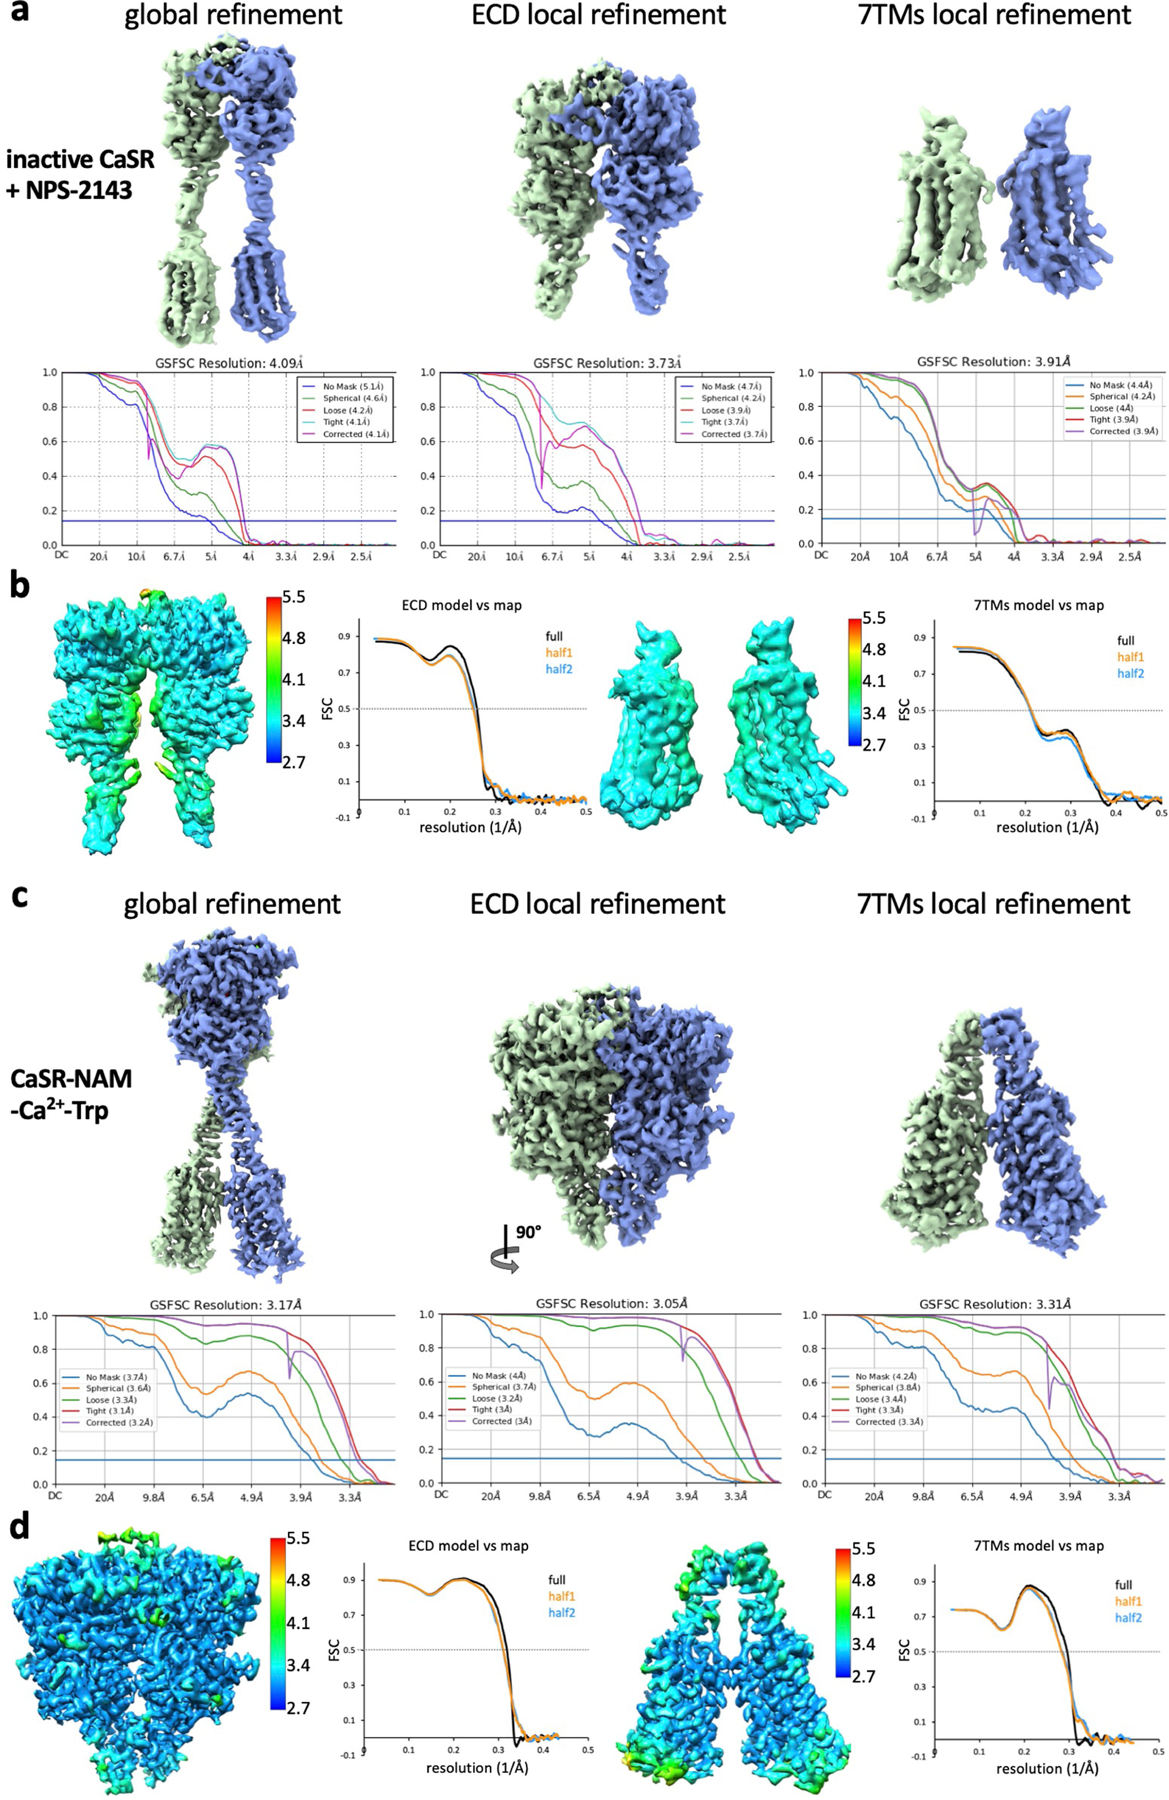
a–d, Global and local refinement maps with corresponding FSC curves indicating nominal resolutions using the FSC = 0.143 criterion, model-vs-map FSC curves and local resolution maps of inactive-state CaSR (a, b) and CaSR-NAM-Ca2+-Trp (c, d).
Extended Data Fig. 5 |. Comparisons between CaSR cryo-EM structures and previous family C GPCR structures.
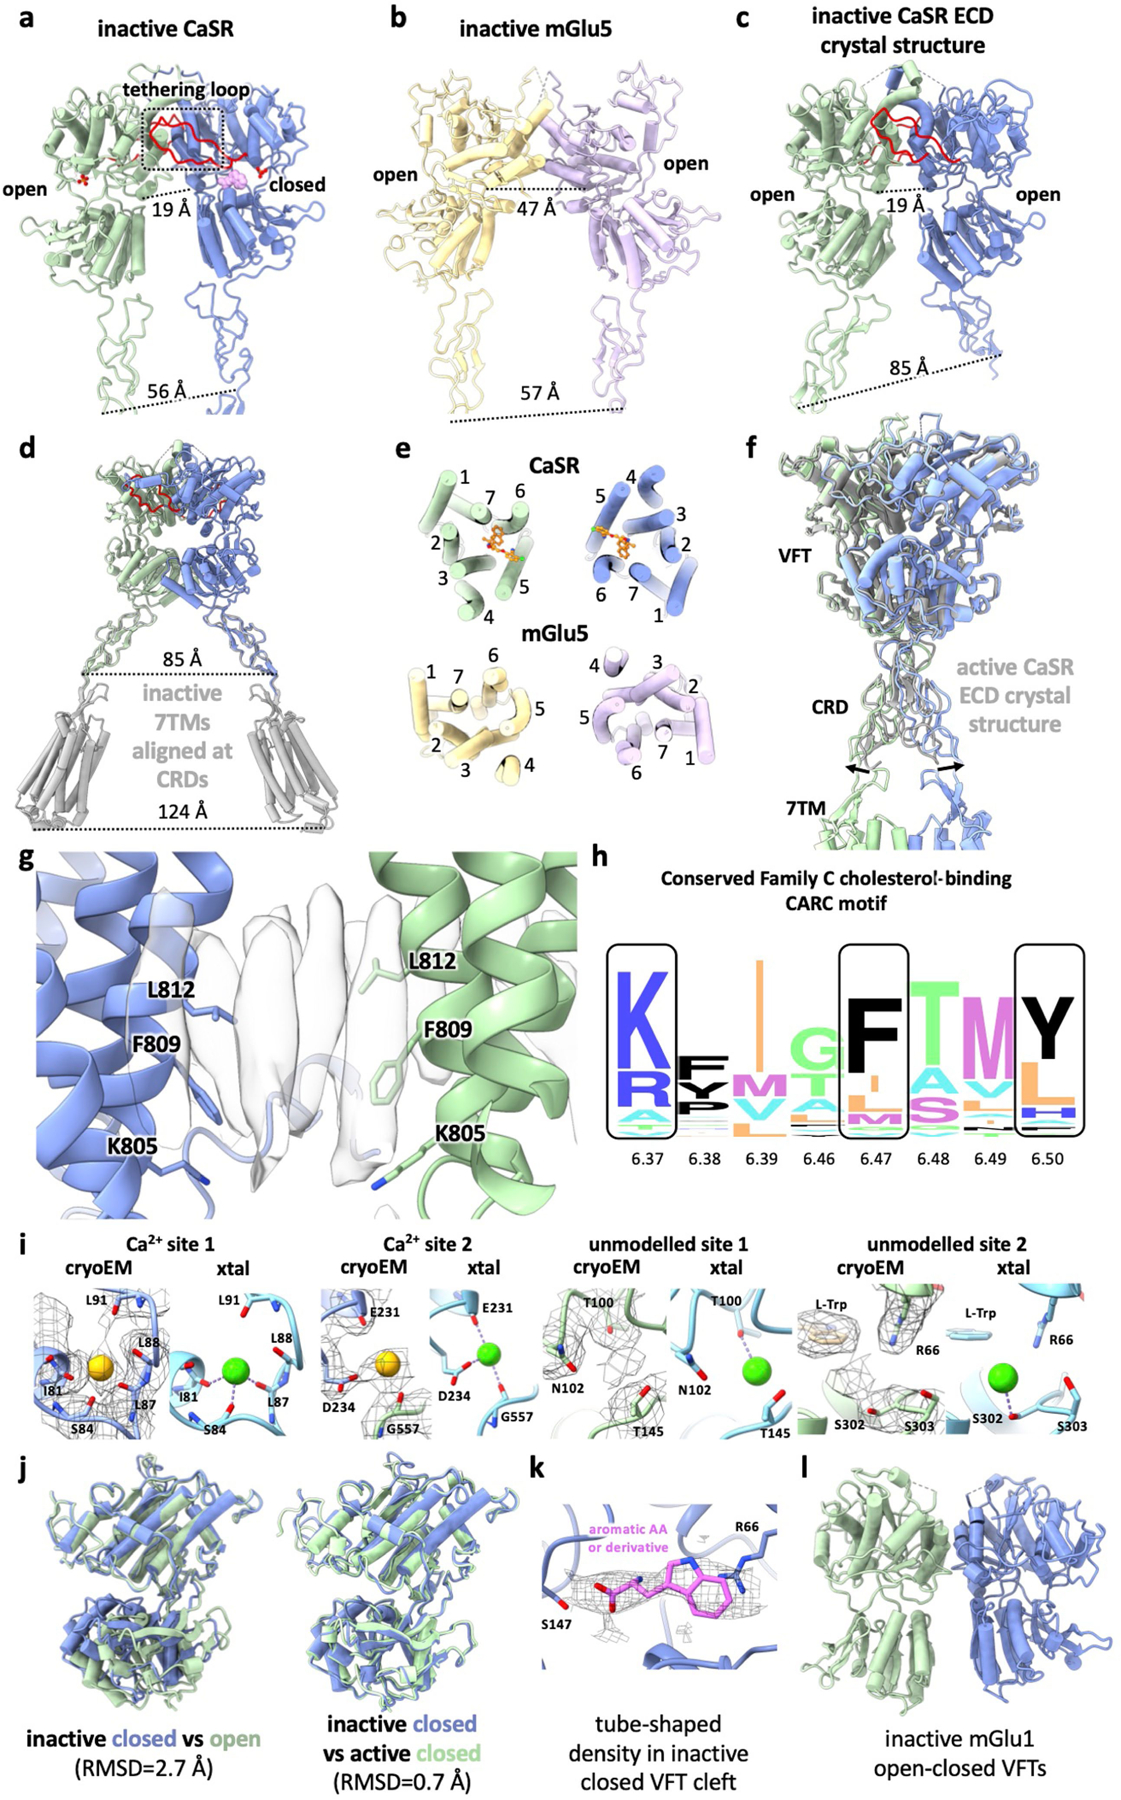
a, ECD from inactive-state CaSR cryo-EM structure with the loop tethering the opposing LB1 colored in red. b, ECD from inactive-state mGlu5 cryo-EM structure8 (PDB: 6N51). c, inactive-state CaSR ECD crystal structure6 (PDE: 5K5T). d, 7TMs from inactive-state CaSR cryo-EM structure (grey) superposed onto inactive CaSR ECD crystal structure based on CRD alignment. e, Comparison of inactive 7TMs orientations between CaSR and mGlu5. f, Active-state CaSR cryo-EM structure aligned with the active CaSR ECD crystal structure6 (grey, PDB: 5K5S) illustrating the difference in CRD orientations. g, Elongated densities observed at the TM6-TM6 interface in cryo-EM maps of active-state CaSR shown with TM6 residues forming the cholesterol-binding CARC motif. h, Sequence alignment logo showing the conservation of CARC motif residues among family C GPCRs (generated using alignment from GPCRdb43 with WebLogo44). i, Comparison of Ca2+ sites in active-state cryo-EM structures with Ca2+ sites in active CaSR ECD crystal structure (PDB: 5K5S)6. j, Alignment of the closed VFT protomer (dark blue) observed in our inactive-state CaSR structure with either the inactive open protomer (left, dark green) or the active closed protomer (right, light green). k, The tube shaped density observed in closed inactive CaSR VFT with L-Trp docked in. l, Crystal structure of open-closed mGlu1 VFTs13 (PDB: 1EWV).
Extended Data Fig. 6 |. PAM and NAM models and TM6-TM6 interfaces in cryo-EM densities.
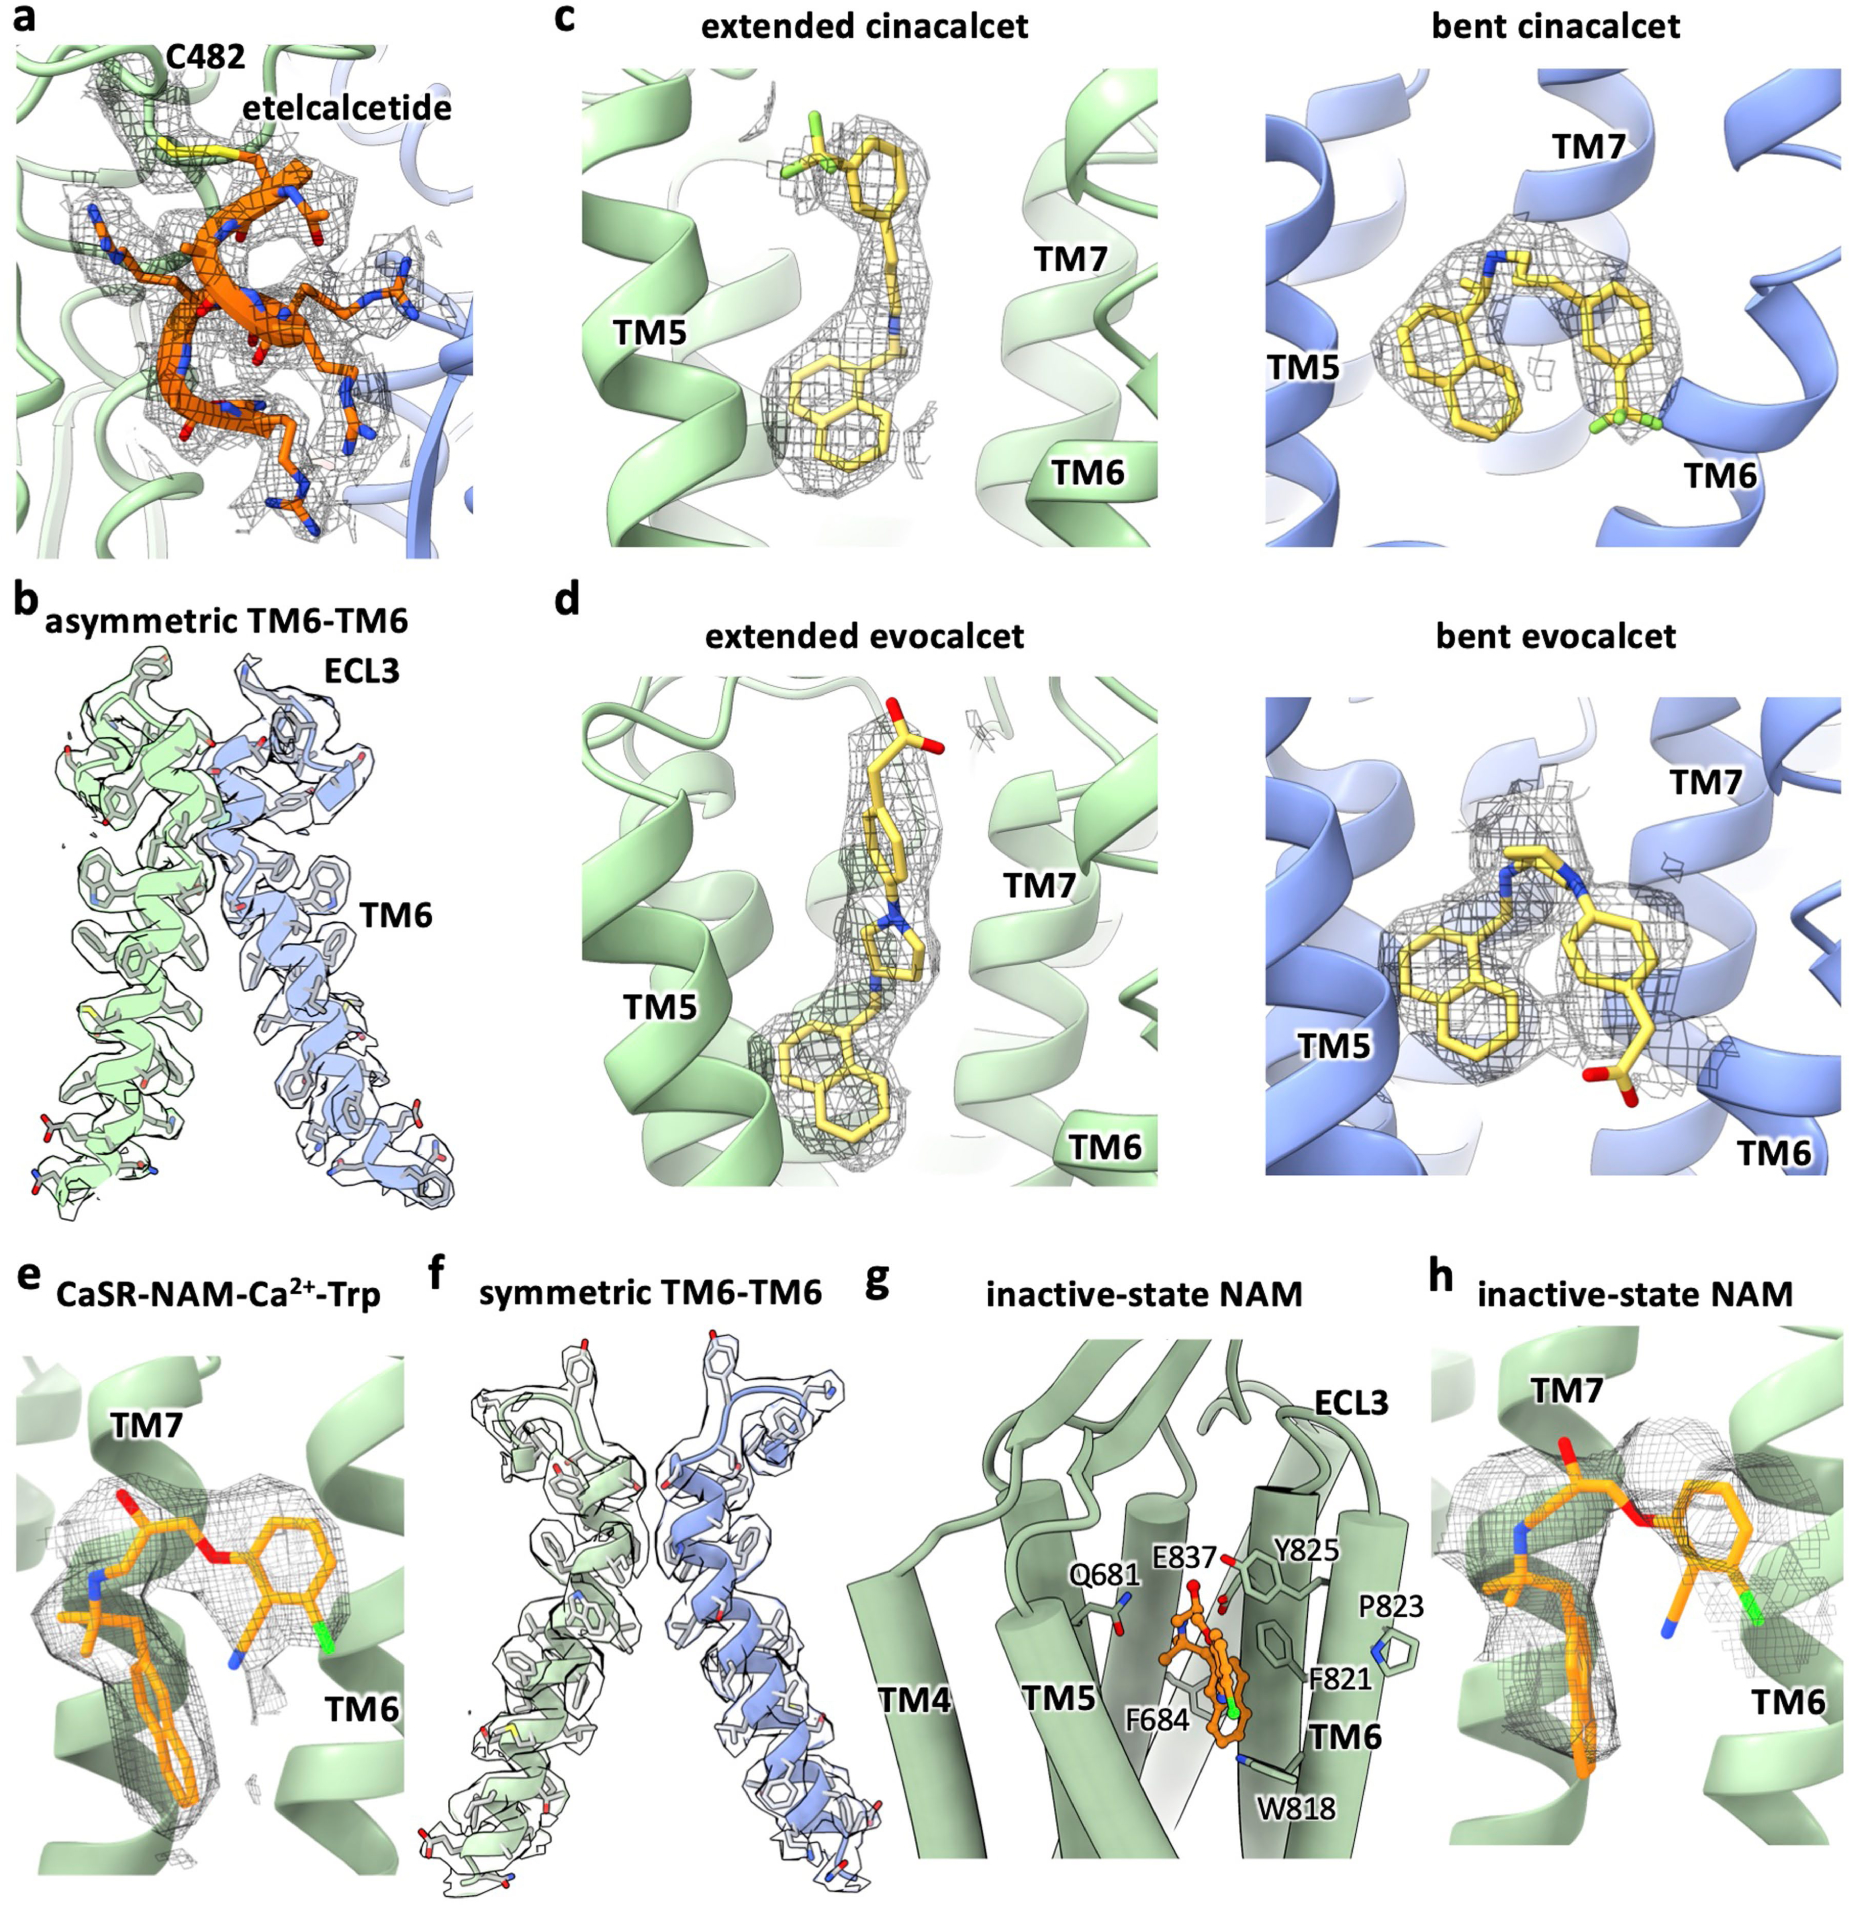
a, Etelcalcetide model in cryo-EM density. b, Active-state CaSR TM6-TM6 interface model in cryo-EM density (shown here is CaSR-cinacalcet. The TM6-TM6 interface of CaSR-evocalcet-etelcalcetide is highly similar). c, Cinacalcet models in cryo-EM densities. d, Evocalcet models in cryo-EM densities. e, NAM model in cryo-EM density for the CaSR-NAM-Ca2+-Trp complex. f, CaSR-NAM-Ca2+-Trp complex TM6-TM6 interface model in cryo-EM density. g, Inactive-state NAM binding pocket. h, Inactive-state NAM model in cryo-EM density.
Extended Data Fig. 7 |. Binding modes of cinacalcet and evocalcet.
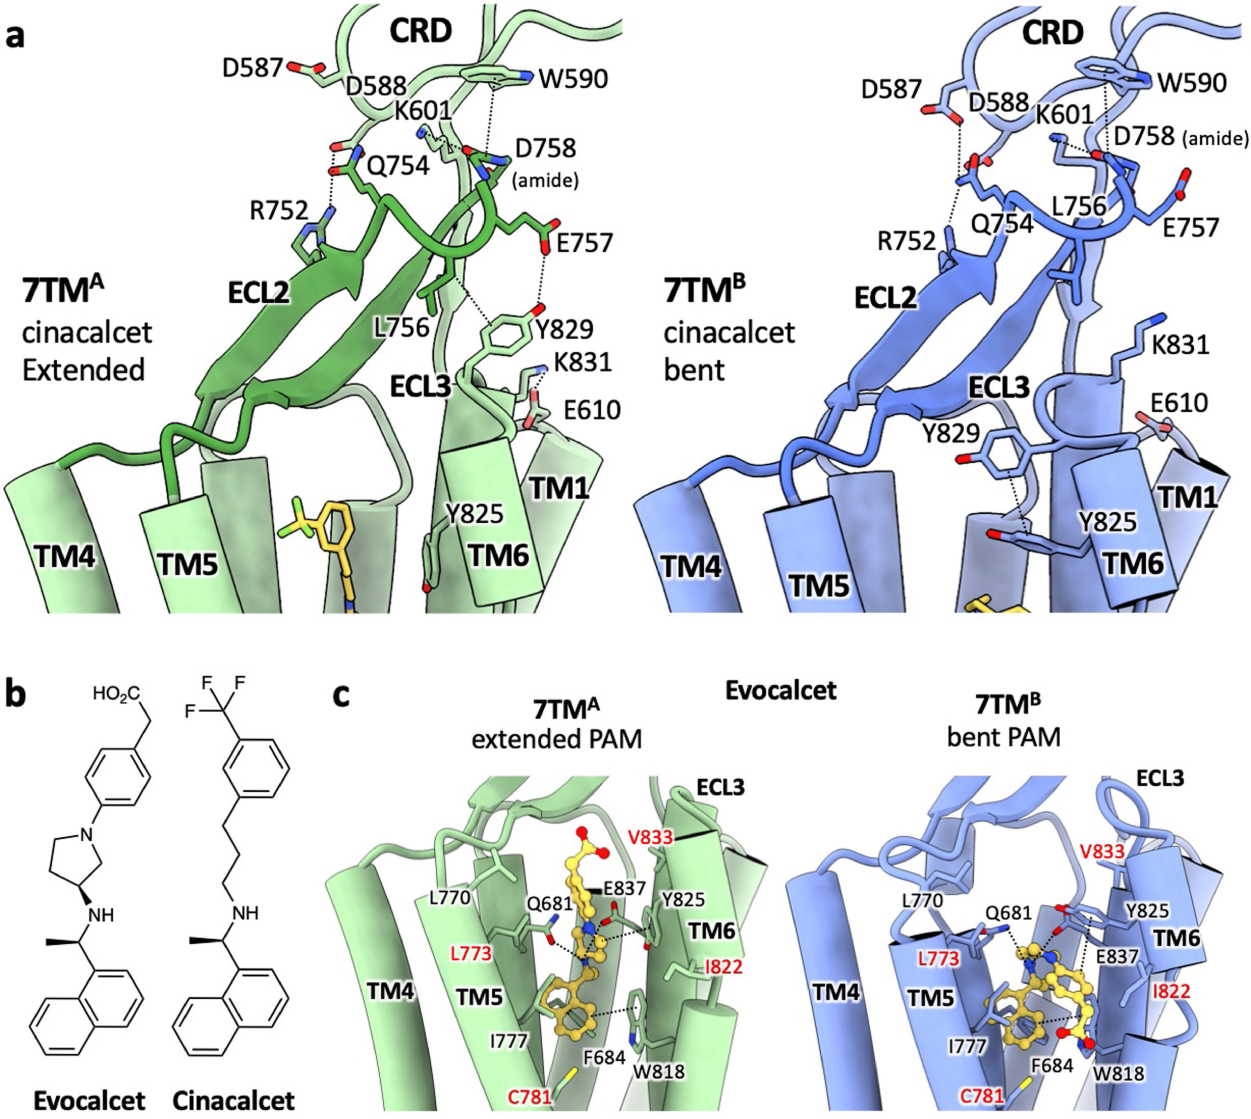
a, Interaction network in the CRD-ECL2-ECL3 region of cinacalcet-bound active-state CaSR. b, Chemical structures of evocalcet and cinacalcet. c, Structure of active-state CaSR 7TMs complexed with evocalcet. Similar to cinacalcet (Fig. 3a), evocalcet adopts an extended conformation in 7TMA (green) and a bent conformation in 7TMB (blue), making distinct interactions with the two protomers.
Extended Data Fig. 8 |. Cell surface expression levels and calcium response curves of various CaSR constructs.
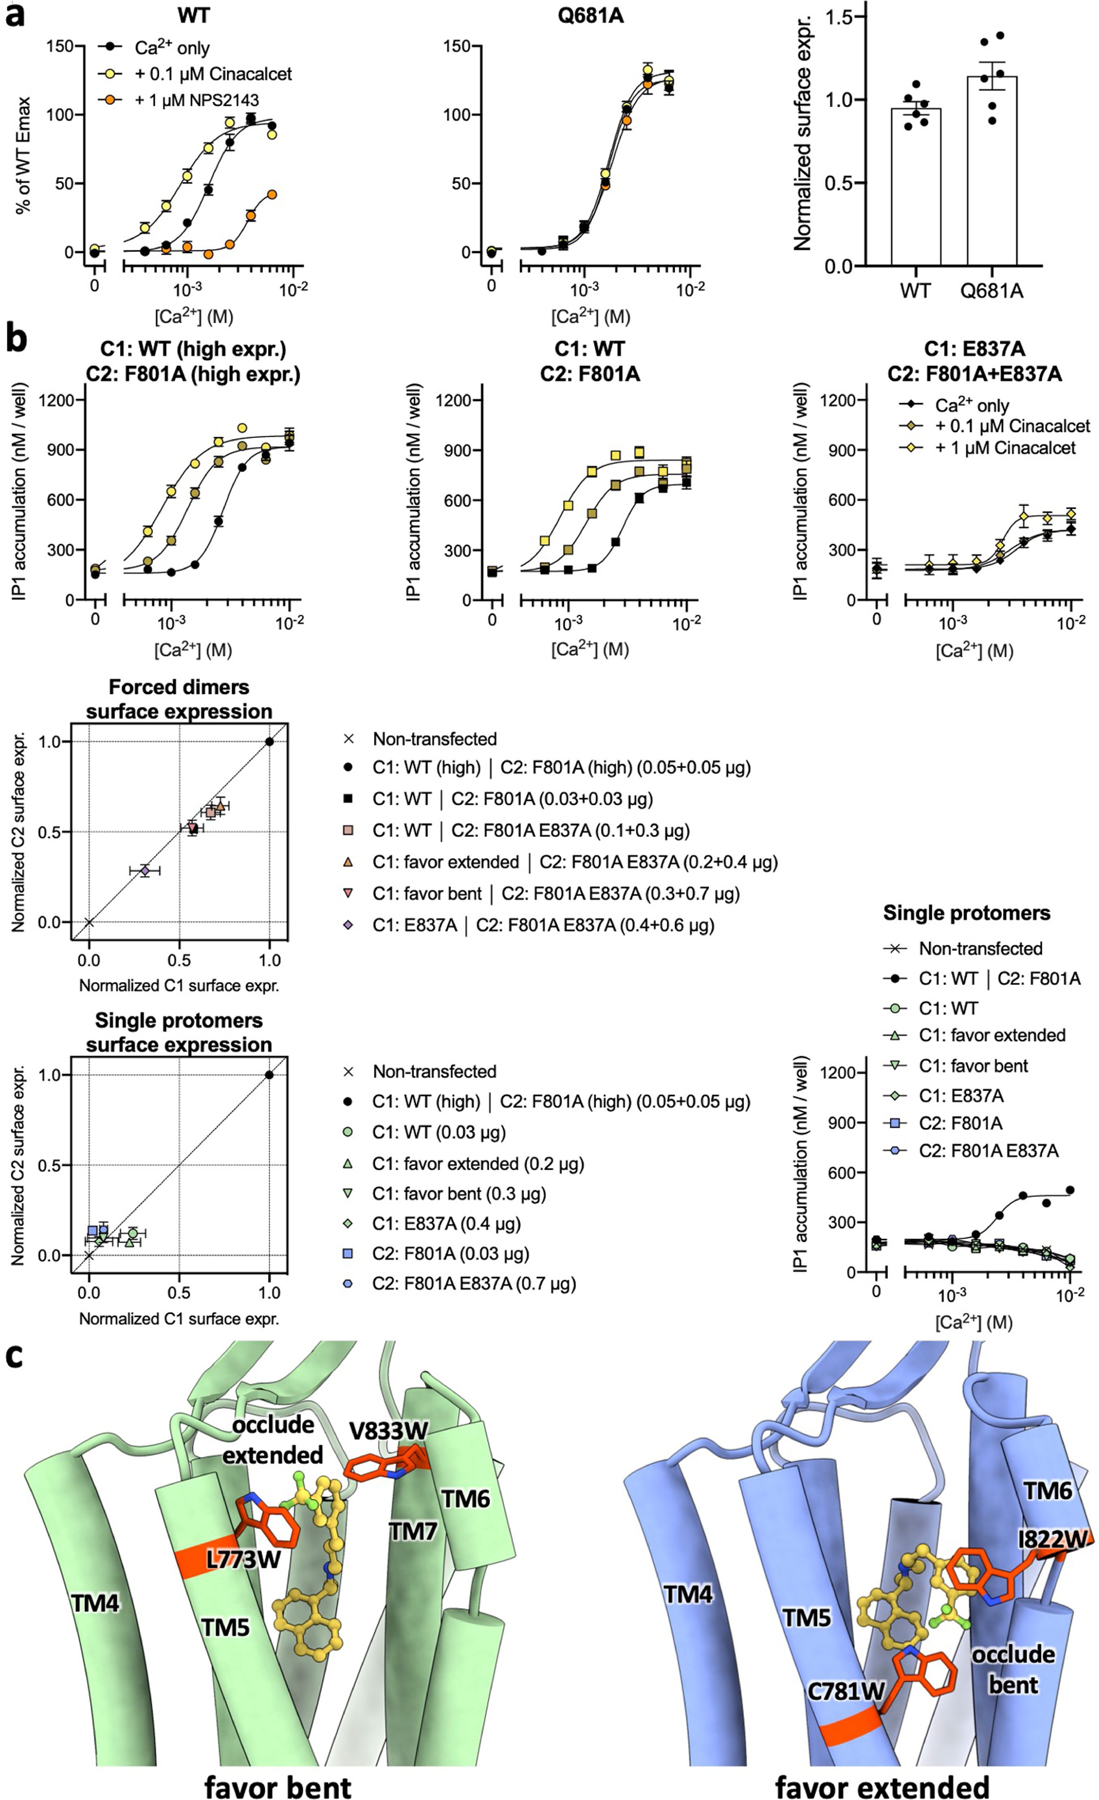
a, Ca2+ response curves (left and middle panels) of the wild-type or Q6813.33A mutant CaSR expressed at similar levels (plasma membrane expression levels shown on the right panel) in HEK293 cells in the absence or presence of the PAM cinacalcet or NAM NPS-2143 as monitored by IP1 accumulation assays. Data represent mean ± s.e.m. from six independent experiments each performed in duplicate. b, Top three panels depict results from IP1 accumulation assays monitoring the Ca2+ responses of the CaSR heterodimer without or with the PAM-binding deficient mutant E837A in both protomers. Middle and bottom left panels show results from cell surface ELISA assays verifying the different C1 and C2 construct combinations yield similar expression levels of CaSR heterodimer at the plasma membrane. Bottom right panel shows the transfection with only one protomer containing either a C1 or C2 tail results in no IP1 accumulation signals in response to stimulation with Ca2+. Functional IP1 data represent mean ± s.e.m. from 5 independent experiments (top row) or 3 independent experiments (3rd row) each performed in duplicate, whereas cell surface ELISA data represent mean ± s.e.m. from 3 independent experiments performed in triplicate. c, Structural illustrations of how the introduced mutations would occlude extended or bent PAM conformations.
Extended Data Fig. 9 |. Ordered C terminus in CaSR and structural comparison between CaSR and mGlu2.
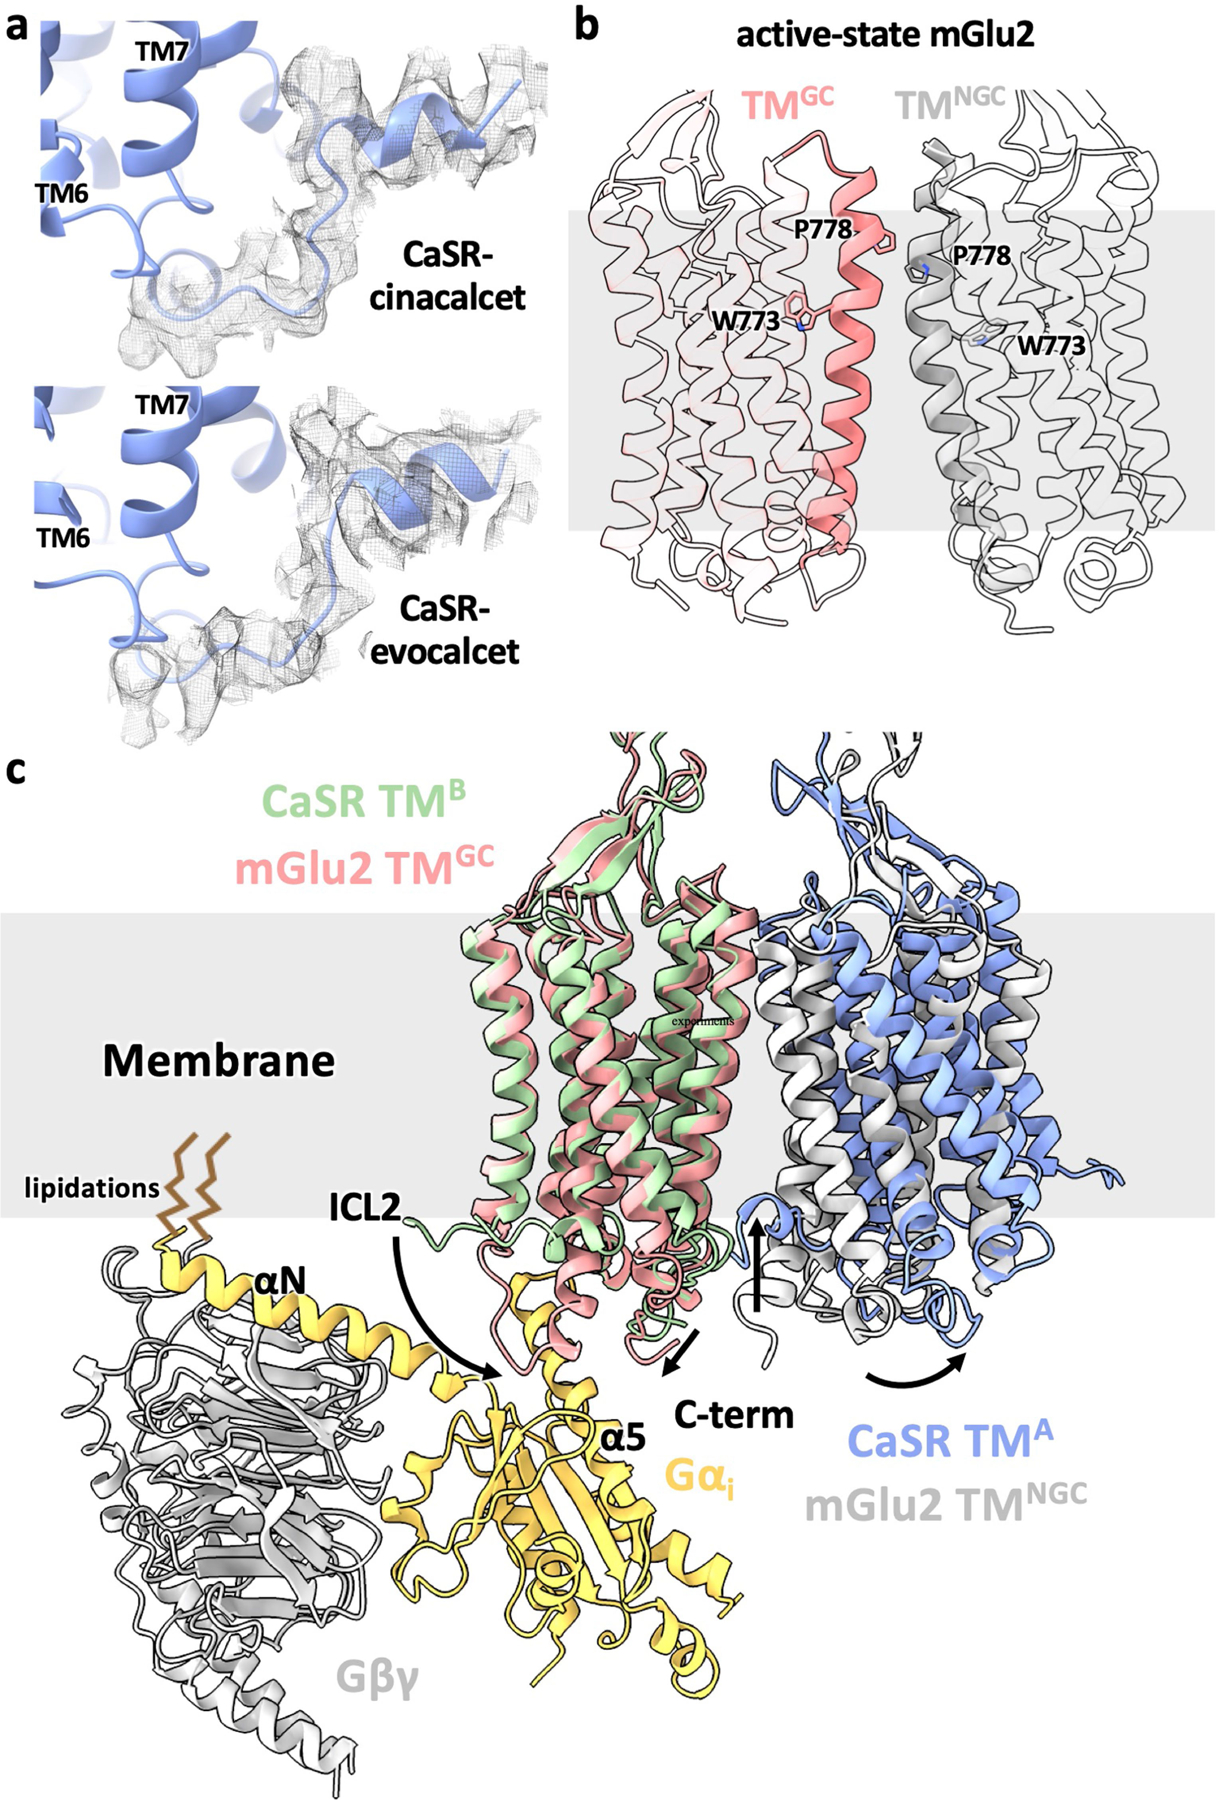
a, The ordered C terminus from the 7TM with a bent PAM (7TMB) shown in cryo-EM densities with unsharpened maps. b, Asymmetric 7TMs in the active-state mGlu2 alone structure (accompanying manuscript). TM6 are shown as solid cartoon with representative residues shown as sticks to highlight the asymmetry. c, Superposition of the G protein-coupling 7TM (7TMGC) from mGlu2-Gi complex structure (accompanying manuscript) onto the active-state CaSR 7TM with a straight PAM (7TMA) showing that the G protein would fit well on the membrane plane and the tilt of CaSR 7TMB leads to the sequestration of its C terminus in the membrane. The comparison between mGlu 7TMGC and CaSR 7TMA illustrates that the receptor likely would couple to G proteins through downward extensions of both ICL2 and C terminus.
Extended Data Fig. 10 |. Schematic of CaSR activation mechanism.
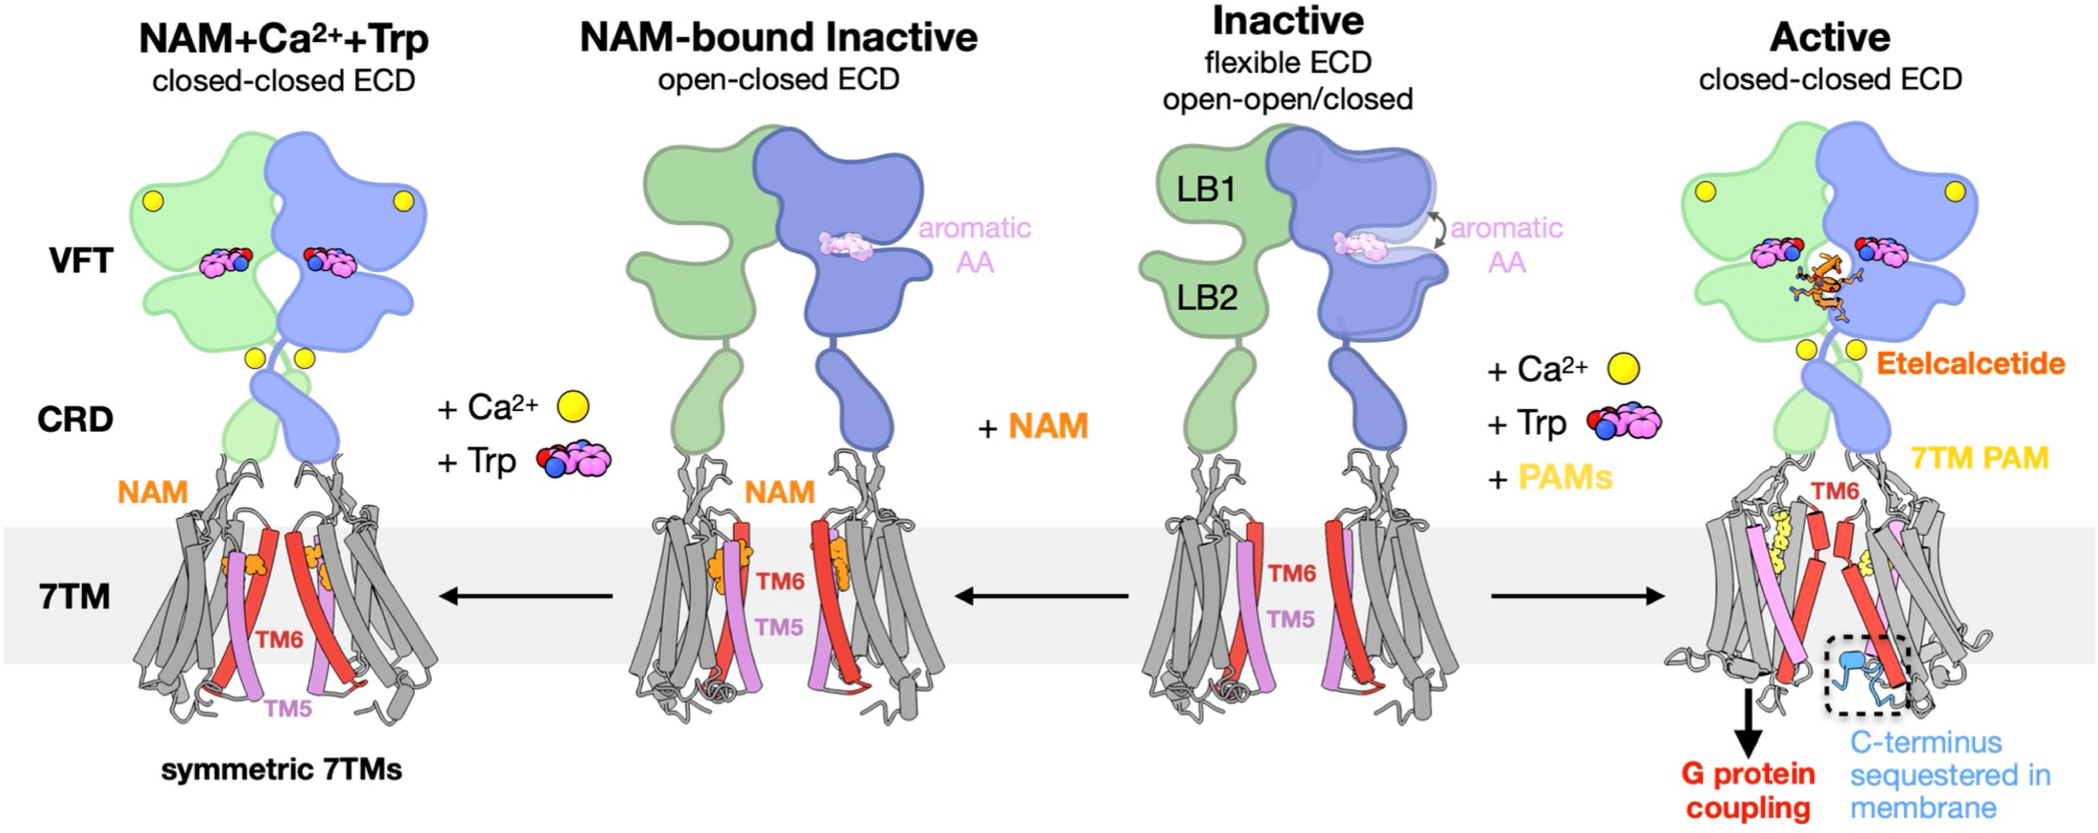
In the inactive state, CaSR is relatively flexible and the 7TMs are separated facing each other at the TM5-TM6 plane. The VFTs adopt inactive open-open/closed conformations. The open-closed conformation can be stabilized by aromatic amino acids (AAs) or their derivatives, thus priming the receptor for activation. NAM binds at both 7TMs with the same conformation and locks the TM6 toggle switch in an inactive conformation. Under high Ca2+ and high Trp conditions, the ECD adopts a closed-closed active conformation, while the presence of the NAM prevents the 7TMs from adopting the active asymmetric configuration. Upon activation by high Ca2+ concentration, the VFTs adopt an active closed-closed conformation, which is stabilized by L-Trp bound at the cleft of each VFT and the ECD PAM etelcalcetide further stabilizes the interface between LB2 of the closed-closed VFTs. Closure of the VFTs leads to rearrangement of the CRDs, bringing the 7TMs together to form an asymmetric TM6-TM6 interface. The asymmetric configuration is stabilized by 7TM PAMs adopting distinct poses. The 7TM with a bent PAM is more tilted than the opposing 7TM with its C terminus sequestered in the membrane, and likely unable to couple to G protein.
Extended Data Table 1 |.
Cryo-EM data collection, refinement and validation statistics
| CaSR+evocalcet+etelcalcetide | CaSR+cinacalcet | CaSR+NPS2143 | CaSR+NPS2143+Ca2++L-Trp | |
|---|---|---|---|---|
|
| ||||
| Data collection and processing | ||||
| Magnification | 81,000 | 81,000 | 81,000 | 105,000 |
| Voltage (kV) | 300 | 300 | 300 | 300 |
| Electron exposure (e−/Å2) | 64.9 | 64.9 | 64.9 | 60.9 |
| Defocus range (μm) | −0.7∼−1.5 | −0.7∼−1.5 | −0.7∼−1.5 | −0.8∼−1.8 |
| Pixel size (Å) | 1.11 | 1.11 | 1.11 | 0.8677 |
| Symmetry imposed | C1 | C1 | C1 | C1 (ECD) C2 (TMD) |
| Initial particle images (no.) | 5,181,204 | 2,718,437 | 3,825,262 | 1,592,332 |
| Final particle images (no.) | 482,939 | 253,836 | 329,093 | 131,620 |
| Map resolution (Å) | 2.5 | 2.8 | 4.1 | 3.2 |
| FSC threshold | (0.143) | (0.143) | (0.143) | (0.143) |
| Refinement | ||||
| Initial model used (PDB code) | 5K5S, 6N51 | 5K5S, 6N51 | 5K5T, 6N52 | 5K5S, 6N51 |
| Model composition | ||||
| Non-hydrogen atoms | 13298 | 13084 | 10997 | 13092 |
| Protein residues | 1627 | 1631 | 1562 | 1624 |
| Ligands | EVO: 2 etelcalcetide: 2 TRP: 2 Ca2+: 4 PO43−: 2 NAG: 15 |
CIN: 2 TRP: 2 Ca2+: 4 PO43−: 2 NAG: 15 |
NPS: 2 PO43−: 2 NAG: 7 |
NPS: 2 TRP: 2 Ca2+: 4 PO43−: 2 NAG: 11 |
| B factors (Å2) | ||||
| Protein | 57.4 | 56.2 | 69.3 | 21.2 |
| Ligands | Evocalcetbent: 94.0 Evocalcetextd: 93.0 Etelcalcetide: 52.2 TRP: 31.1 Ca2+ (site 1): 42.0 Ca2+ (site 2): 66.9 PO43−: 27.0 NAG: 54.9 |
Cinacalcetbent: 82.0 Cinacalcetextd: 83.1 TRP: 32.7 Ca2+ (site 1): 41.9 Ca2+ (site 2): 75.8 PO43−: 35.4 NAG: 55.8 |
NPS-2143: 137.8 PO43−: 32.6 NAG: 76.9 |
NPS-2143: 31.2 Ca2+ (site 1): 22.2 Ca2+ (site 2): 49.8 PO43−: 3.8 NAG: 23.2 TRP: 1.9 |
| R.m.s. deviations | ||||
| Bond lengths (Å) | 0.006 | 0.008 | 0.009 | 0.006 |
| Bond angles (°) | 0.935 | 1.008 | 1.085 | 0.931 |
| Validation | ||||
| MolProbity score | 1.18 | 1.39 | 1.45 | 1.24 |
| Clashscore | 2.25 | 2.56 | 2.66 | 1.94 |
| Poor rotamers (%) | 0.93 | 0.00 | 0.12 | 0.00 |
| CaBLAM outliers (%) | 1.69 | 1.88 | 2.94 | 2.83 |
| EMRinger score | 3.70 | 4.26 | 2.90 | 3.66 |
| Ramachandran plot | ||||
| Favored (%) | 96.95 | 94.98 | 93.98 | 95.89 |
| Allowed (%) | 3.05 | 5.02 | 6.02 | 4.11 |
| Outliers (%) | 0.00 | 0.00 | 0.00 | 0.00 |
Supplementary Material
Acknowledgements
We thank E. Montabana at the Stanford-SLAC cryo-EM facility for support with data collection and B. Kobilka for comments on the manuscript. This work was supported, in part, by R01 NS092695 (G.S. and J.M.M.) and a grant from the Mathers Foundation (G.S.); a Wellcome Trust Investigator Award (grant number 106995/Z/15/Z) (R.V.T); National Institute for Health Research (NIHR) Oxford Biomedical Research Centre Programme (R.V.T.); NIHR Senior Investigator Award (R.V.T.) (grant number NF-SI-0514–10091); T32-GM089626 (J.G.M.); and funding from the Faculty of Health and Medical Sciences (H.B.-O.).
Footnotes
Competing interests The authors declare no competing interests.
Additional information
Supplementary information The online version contains supplementary material available at https://doi.org/10.1038/s41586-021-03691-0.
Peer review information Nature thanks Alexandru Aricescu and the other, anonymous, reviewer(s) for their contribution to the peer review of this work. Peer reviewer reports are available.
Reprints and permissions information is available at http://www.nature.com/reprints.
Publisher’s note Springer Nature remains neutral with regard to jurisdictional claims in published maps and institutional affiliations.
References
- 1.Hannan FM, Kallay E, Chang W, Brandi ML & Thakker RV The calcium-sensing receptor in physiology and in calcitropic and noncalcitropic diseases. Nat. Rev. Endocrinol. 15, 33–51 (2018). [DOI] [PMC free article] [PubMed] [Google Scholar]
- 2.Møller TC, Moreno-Delgado D, Pin J-P & Kniazeff J Class C G protein-coupled receptors: reviving old couples with new partners. Biophys. Rep. 3, 57–63 (2017). [DOI] [PMC free article] [PubMed] [Google Scholar]
- 3.Conigrave AD, Quinn SJ & Brown EM L-amino acid sensing by the extracellular Ca2+-sensing receptor. Proc. Natl Acad. Sci. USA 97, 4814–4819 (2000). [DOI] [PMC free article] [PubMed] [Google Scholar]
- 4.Riccardi D & Martin D The role of the calcium-sensing receptor in the pathophysiology of secondary hyperparathyroidism. NDT Plus 1 (Suppl 1), i7–i11 (2008). [DOI] [PMC free article] [PubMed] [Google Scholar]
- 5.Nemeth EF, Van Wagenen BC & Balandrin MF in Progress in Medicinal Chemistry Vol. 57 (eds Witty DR & Cox B) 1–86 (Elsevier, 2018). [DOI] [PubMed] [Google Scholar]
- 6.Geng Y et al. Structural mechanism of ligand activation in human calcium-sensing receptor. eLife 5, e13662 (2016). [DOI] [PMC free article] [PubMed] [Google Scholar]
- 7.Zhang C et al. Structural basis for regulation of human calcium-sensing receptor by magnesium ions and an unexpected tryptophan derivative co-agonist. Sci. Adv. 2, e1600241 (2016). [DOI] [PMC free article] [PubMed] [Google Scholar]
- 8.Koehl A et al. Structural insights into metabotropic glutamate receptor activation. Nature 566, 79–84 (2019). [DOI] [PMC free article] [PubMed] [Google Scholar]
- 9.Fantini J & Barrantes FJ How cholesterol interacts with membrane proteins: an exploration of cholesterol-binding sites including CRAC, CARC, and tilted domains. Front. Physiol. 4, 31 (2013). [DOI] [PMC free article] [PubMed] [Google Scholar]
- 10.Isberg V et al. Generic GPCR residue numbers—aligning topology maps while minding the gaps. Trends Pharmacol. Sci. 36, 22–31 (2015). [DOI] [PMC free article] [PubMed] [Google Scholar]
- 11.Kifor O, Diaz R, Butters R, Kifor I & Brown EM The calcium-sensing receptor is localized in caveolin-rich plasma membrane domains of bovine parathyroid cells. J. Biol. Chem. 273, 21708–21713 (1998). [DOI] [PubMed] [Google Scholar]
- 12.Timmers HJLM, Karperien M, Hamdy NA, de Boer H & Hermus ARMM Normalization of serum calcium by cinacalcet in a patient with hypercalcaemia due to a de novo inactivating mutation of the calcium-sensing receptor. J. Intern. Med. 260, 177–182 (2006). [DOI] [PubMed] [Google Scholar]
- 13.Kunishima N et al. Structural basis of glutamate recognition by a dimeric metabotropic glutamate receptor. Nature 407, 971–977 (2000). [DOI] [PubMed] [Google Scholar]
- 14.Liu H et al. Illuminating the allosteric modulation of the calcium-sensing receptor. Proc. Natl Acad. Sci. USA 117, 21711–21722 (2020). [DOI] [PMC free article] [PubMed] [Google Scholar]
- 15.Bushinsky DA et al. One-year safety and efficacy of intravenous etelcalcetide in patients on hemodialysis with secondary hyperparathyroidism. Nephrol. Dial. Transplant. 35, 1769–1778 (2020). [DOI] [PMC free article] [PubMed] [Google Scholar]
- 16.Alexander ST et al. Critical cysteine residues in both the calcium-sensing receptor and the allosteric activator AMG 416 underlie the mechanism of action. Mol. Pharmacol. 88, 853–865 (2015). [DOI] [PubMed] [Google Scholar]
- 17.Hannan FM et al. Identification of 70 calcium-sensing receptor mutations in hyper- and hypo-calcaemic patients: evidence for clustering of extracellular domain mutations at calcium-binding sites. Hum. Mol. Genet. 21, 2768–2778 (2012). [DOI] [PubMed] [Google Scholar]
- 18.Robertson MJ, van Zundert GCP, Borrelli K & Skiniotis G GemSpot: a pipeline for robust modeling of ligands into cryo-EM maps. Structure 28, 707–716.e3 (2020). [DOI] [PMC free article] [PubMed] [Google Scholar]
- 19.Leach K et al. Towards a structural understanding of allosteric drugs at the human calcium-sensing receptor. Cell Res. 26, 574–592 (2016). [DOI] [PMC free article] [PubMed] [Google Scholar]
- 20.Hlavackova V et al. Evidence for a single heptahelical domain being turned on upon activation of a dimeric GPCR. EMBO J. 24, 499–509 (2005). [DOI] [PMC free article] [PubMed] [Google Scholar]
- 21.Jacobsen SE, Gether U & Bräuner-Osborne H Investigating the molecular mechanism of positive and negative allosteric modulators in the calcium-sensing receptor dimer. Sci. Rep. 7, 46355 (2017). [DOI] [PMC free article] [PubMed] [Google Scholar]
- 22.Seven AB et al. G protein activation by a metabotropic glutamate receptor. Nature (in the press). [DOI] [PMC free article] [PubMed] [Google Scholar]
- 23.Huang S et al. Interdomain movements in metabotropic glutamate receptor activation. Proc. Natl Acad. Sci. USA 108, 15480–15485 (2011). [DOI] [PMC free article] [PubMed] [Google Scholar]
- 24.Ray K, Fan G-F, Goldsmith PK & Spiegel AM The carboxyl terminus of the human calcium receptor. Requirements for cell-surface expression and signal transduction. J. Biol. Chem. 272, 31355–31361 (1997). [DOI] [PubMed] [Google Scholar]
- 25.Hu J et al. A region in the seven-transmembrane domain of the human Ca2+ receptor critical for response to Ca2+. J. Biol. Chem. 280, 5113–5120 (2005). [DOI] [PubMed] [Google Scholar]
- 26.Shiohara M et al. A novel gain-of-function mutation (F821L) in the transmembrane domain of calcium-sensing receptor is a cause of severe sporadic hypoparathyroidism. Eur. J. Pediatr. 163, 94–98 (2004). [DOI] [PubMed] [Google Scholar]
- 27.Kobilka BK G protein coupled receptor structure and activation. Biochim. Biophys. Acta 1768, 794–807 (2007). [DOI] [PMC free article] [PubMed] [Google Scholar]
- 28.Wu H et al. Structure of a class C GPCR metabotropic glutamate receptor 1 bound to an allosteric modulator. Science 344, 58–64 (2014). [DOI] [PMC free article] [PubMed] [Google Scholar]
- 29.Doré AS et al. Structure of class C GPCR metabotropic glutamate receptor 5 transmembrane domain. Nature 511, 557–562 (2014). [DOI] [PubMed] [Google Scholar]
- 30.Punjani A, Rubinstein JL, Fleet DJ & Brubaker MA cryoSPARC: algorithms for rapid unsupervised cryo-EM structure determination. Nat. Methods 14, 290–296 (2017). [DOI] [PubMed] [Google Scholar]
- 31.Punjani A, Zhang H & Fleet DJ Non-uniform refinement: adaptive regularization improves single-particle cryo-EM reconstruction. Nat. Methods 17, 1214–1221 (2020). [DOI] [PubMed] [Google Scholar]
- 32.Punjani A & Fleet DJ 3D variability analysis: resolving continuous flexibility and discrete heterogeneity from single particle cryo-EM. J. Struct. Biol. 213, 107702 (2021). [DOI] [PubMed] [Google Scholar]
- 33.Pettersen EF et al. UCSF Chimera–a visualization system for exploratory research and analysis. J. Comput. Chem. 25, 1605–1612 (2004). [DOI] [PubMed] [Google Scholar]
- 34.Goudet C et al. Asymmetric functioning of dimeric metabotropic glutamate receptors disclosed by positive allosteric modulators. J. Biol. Chem. 280, 24380–24385 (2005). [DOI] [PMC free article] [PubMed] [Google Scholar]
- 35.Waterhouse A et al. SWISS-MODEL: homology modelling of protein structures and complexes. Nucleic Acids Res. 46 (W1), W296–W303 (2018). [DOI] [PMC free article] [PubMed] [Google Scholar]
- 36.Adams PD et al. PHENIX: a comprehensive Python-based system for macromolecular structure solution. Acta Crystallogr. D 66, 213–221 (2010). [DOI] [PMC free article] [PubMed] [Google Scholar]
- 37.Emsley P & Cowtan K Coot: model-building tools for molecular graphics. Acta Crystallogr. D 60, 2126–2132 (2004). [DOI] [PubMed] [Google Scholar]
- 38.Chen VB et al. MolProbity: all-atom structure validation for macromolecular crystallography. Acta Crystallogr. D 66, 12–21 (2010). [DOI] [PMC free article] [PubMed] [Google Scholar]
- 39.Barad BA et al. EMRinger: side chain-directed model and map validation for 3D cryo-electron microscopy. Nat. Methods 12, 943–946 (2015). [DOI] [PMC free article] [PubMed] [Google Scholar]
- 40.Olsen RHJ et al. TRUPATH, an open-source biosensor platform for interrogating the GPCR transducerome. Nat. Chem. Biol. 16, 841–849 (2020). [DOI] [PMC free article] [PubMed] [Google Scholar]
- 41.Bond SR & Naus CC RF-Cloning.org: an online tool for the design of restriction-free cloning projects. Nucleic Acids Res. 40, W209–W213 (2012). [DOI] [PMC free article] [PubMed] [Google Scholar]
- 42.Papasergi-Scott MM et al. Structures of metabotropic GABAB receptor. Nature 584, 310–314 (2020). [DOI] [PMC free article] [PubMed] [Google Scholar]
- 43.Isberg V et al. GPCRdb: an information system for G protein-coupled receptors. Nucleic Acids Res. 44 (D1), D356–D364 (2016). [DOI] [PMC free article] [PubMed] [Google Scholar]
- 44.Crooks GE, Hon G, Chandonia JM & Brenner SE WebLogo: a sequence logo generator. Genome Res. 14, 1188–1190 (2004). [DOI] [PMC free article] [PubMed] [Google Scholar]
Associated Data
This section collects any data citations, data availability statements, or supplementary materials included in this article.
Supplementary Materials
Data Availability Statement
All data generated or analysed during this study are included in the Article and its Supplementary Information. Cryo-EM maps of active-state CaSR–cinacalcet, active-state CaSR–etelcalcetide–evocalcet, inactive-state CaSR–NPS2143 and CaSR–NPS2143–Ca2+–Trp have been deposited in the Electron Microscopy Data Bank under accession codes EMD-23653, EMD-23654, EMD-23655 and EMD-23652, respectively. The atomic coordinates of active-state CaSR–cinacalcet, active-state CaSR–etelcalcetide–evocalcet, inactive-state CaSR–NPS2143 and CaSR–NPS2143–Ca2+–Trp have been deposited in the Protein Data Bank under the accession codes 7M3F, 7M3G, 7M3J and 7M3E, respectively.


