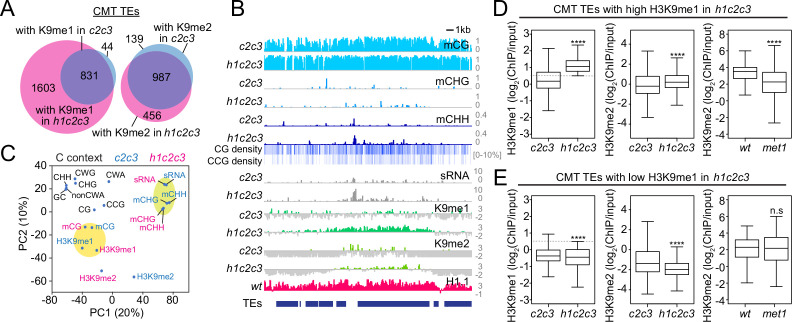
Figure 7. Non-CG DNA methylation and H3K9 methylation are decoupled in h1c2c3.
(A) Number of chromomethylase (CMT) transposable elements (TEs) with H3K9 methylation (average H3K9me1 [K9me1] or H3K9me2 [K9me2] >0.5) in cmt2cmt3 (c2c3) or h1cmt2cmt3 (h1c2c3) plants. (B) Example of DNA methylation, CG and CCG density, H1 level, H3K9 methylation, and small RNA (sRNA) expression around CMT TEs in c2c3 and h1c2c3 plants (Chr3: 14,495,000–14,520,000). (C) Principal component analysis of H3K9me, cytosine content (total GC content, CG, CCG, CHG, CHH, CWG, CWA, and non-CWA [W = A and T]), DNA methylation, and sRNA expression in c2c3 and h1c2c3 plants. (D, E) H3K9me levels at CMT TEs with high H3K9me1 (H3K9me1 ≥0.5; D) or low H3K9me1 (H3K9me1 <0.5; E) in h1c2c3 plants. **** indicates p < 0.0001.


