

Abstract
Objective
To characterize the risk of persistent and new clinical sequelae in adults aged ≥65 years after the acute phase of SARS-CoV-2 infection.
Design
Retrospective cohort study.
Setting
UnitedHealth Group Clinical Research Database: deidentified administrative claims and outpatient laboratory test results.
Participants
Individuals aged ≥65 years who were continuously enrolled in a Medicare Advantage plan with coverage of prescription drugs from January 2019 to the date of diagnosis of SARS-CoV-2 infection, matched by propensity score to three comparison groups that did not have covid-19: 2020 comparison group (n=87 337), historical 2019 comparison group (n=88 070), and historical comparison group with viral lower respiratory tract illness (n=73 490).
Main outcome measures
The presence of persistent and new sequelae at 21 or more days after a diagnosis of covid-19 was determined with ICD-10 (international classification of diseases, 10th revision) codes. Excess risk for sequelae caused by infection with SARS-CoV-2 was estimated for the 120 days after the acute phase of the illness with risk difference and hazard ratios, calculated with 95% Bonferroni corrected confidence intervals. The incidence of sequelae after the acute infection was analyzed by age, race, sex, and whether patients were admitted to hospital for covid-19.
Results
Among individuals who were diagnosed with SARS-CoV-2, 32% (27 698 of 87 337) sought medical attention in the post-acute period for one or more new or persistent clinical sequelae, which was 11% higher than the 2020 comparison group. Respiratory failure (risk difference 7.55, 95% confidence interval 7.18 to 8.01), fatigue (5.66, 5.03 to 6.27), hypertension (4.43, 2.27 to 6.37), memory difficulties (2.63, 2.23 to 3.13), kidney injury (2.59, 2.03 to 3.12), mental health diagnoses (2.50, 2.04 to 3.04), hypercoagulability 1.47 (1.2 to 1.73), and cardiac rhythm disorders (2.19, 1.76 to 2.57) had the greatest risk differences compared with the 2020 comparison group, with similar findings to the 2019 comparison group. Compared with the group with viral lower respiratory tract illness, however, only respiratory failure, dementia, and post-viral fatigue had increased risk differences of 2.39 (95% confidence interval 1.79 to 2.94), 0.71 (0.3 to 1.08), and 0.18 (0.11 to 0.26) per 100 patients, respectively. Individuals with severe covid-19 disease requiring admission to hospital had a markedly increased risk for most but not all clinical sequelae.
Conclusions
The results confirm an excess risk for persistent and new sequelae in adults aged ≥65 years after acute infection with SARS-CoV-2. Other than respiratory failure, dementia, and post-viral fatigue, the sequelae resembled those of viral lower respiratory tract illness in older adults. These findings further highlight the wide range of important sequelae after acute infection with the SARS-CoV-2 virus.
Introduction
Post-acute sequelae of SARS-CoV-2 infection has been defined as signs and symptoms that persist beyond 30 days after infection with the SARS-CoV-2 virus. Emerging data suggest that individuals affected by the disease might have many signs and symptoms across a wide range of organ systems after the acute infection. Therefore, the natural course of post-acute sequelae of SARS-CoV-2 infection needs to be precisely defined. The accumulated data have mainly been from individuals who were admitted to hospital because of covid-19, with only a few reports from a large more general population of outpatients.1 2 3 4 5 6 7 Also, little is known about the incidence of persistent and new clinical sequelae caused by SARS-CoV-2 infection among adults aged ≥65 years, who might have worse outcomes than younger adults after the acute infection.1 Few studies have been powered to evaluate whether factors such as advancing age, sex, race, and admission to hospital for covid-19 modify the risk of clinical sequelae in the post-acute phase of the illness in older individuals.
We have estimated the excess risk and hazard ratios of persistent and new clinical sequelae caused by SARS-CoV-2 infection among adults aged ≥65 years during the post-acute phase of infection. This analysis of a large generalizable sample of Medicare patients used ICD-10 (international classification of diseases, 10th revision) codes in claims that provided the power to evaluate associations across subgroups of older individuals.
Methods
Data source
We used two data sources within the UnitedHealth Group Clinical Research Database: deidentified administrative outpatient and inpatient claims, and outpatient laboratory results for SARS-CoV-2 infection. All data were for individuals who were enrolled in a Medicare Advantage plan with coverage of prescription drugs through one large national health insurance provider in the US.
Study population
SARS-CoV-2 infection group
Individuals were aged ≥65 years in 2020 and had: a primary, secondary, or tertiary diagnosis of covid-19, identified by an administrative claim with an ICD-10 code of U07.1, or B34.2 or B97.29 before 1 April 2020; or a report of a positive SARS-CoV-2 polymerase chain reaction (PCR) test in the outpatient laboratory dataset. We included ICD-10 codes B34.2 and B97.29 because many physicians used these codes early in the pandemic to clinically diagnose infection before the US Centers for Disease Control and Prevention recommended U07.1 as the primary code for clinical diagnosis on 1 April 2020.
Group members were required to have continuous enrollment in Medicare Advantage with coverage of prescription drugs from 1 January 2019 to the index date, which was the date of the first diagnosis of covid-19 or the date of a positive PCR test. If an individual had both dates, we took the earliest of these as the index date.
A preliminary analysis indicated that individuals on Medicare Special Needs Plans were different from most members who were diagnosed as having covid-19, and therefore we excluded individuals who were enrolled in Special Needs Plans in the calendar month before their index date (n=32 584). We also excluded individuals with a positive SARS-CoV-2 antibody serology test without a reported infection (n=4667) because an index date for covid-19 was not possible. Finally, we excluded individuals with a diagnosis ICD-10 code of only B34.2 or B97.29 (n=5264) on or after 1 April 2020. The study period for the primary analysis was from 1 January 2020 to 31 December 2020.
2020 comparison group
Individuals were enrolled in Medicare Advantage with coverage of prescription drugs, were aged ≥65 years in 2020, and did not have a clinical diagnosis related to covid-19 or a positive PCR test in 2020. Continuous enrollment in the health plan was required from 1 January 2019 to a randomly assigned index date drawn from the SARS-CoV-2 infection group. Individuals enrolled in Special Needs Plans in the calendar month before their assigned index date were excluded (n=178 647).
2019 comparison group
We created this historical comparison group to account for ascertainment bias as a result of reduced use of healthcare services during the 2020 pandemic (eFigure 1a). Individuals aged ≥65 years in 2019 were required to have been continuously enrolled in Medicare Advantage with coverage of prescription drugs from 1 January 2018 to a randomly assigned index month and day in 2019 drawn from the corresponding 2020 dates in the SARS-CoV-2 infection group. Individuals participating in Special Needs Plans in the calendar month before their assigned index date were excluded (n=192 705).
Viral lower respiratory tract illness
We created this historical comparison group to evaluate the clinical sequelae specific to SARS-CoV-2 infection because many serious viral illnesses carry a risk of developing morbidity after the acute illness (eFigure 1b). The viral lower respiratory tract illness group included individuals aged ≥65 years in the year they were diagnosed as having a viral lower respiratory tract illness, defined as any of the following: influenza (J09, J10, J11), non-bacterial pneumonia (J12, J18.9), acute bronchitis (J20), acute lower respiratory infection (J22), or chronic obstructive pulmonary disease with acute lower respiratory infection (J44.0), between 1 January and 31 December 2017; 1 January and 31 December 2018; or 1 January and 31 December 2019. We included exacerbation of chronic obstructive pulmonary disease because in these patients the disease is typically induced by a virus and identified only with code J44.0. Observations from each of these time periods were combined to form a viral lower respiratory tract illness comparison group. We defined the index date as the date of the first diagnosis of a viral lower respiratory tract illness. Individuals were required to have been continuously enrolled in Medicare Advantage with coverage of prescription drugs from 1 January of the year before the index date. Individuals participating in Special Needs Plans in the calendar month before their assigned index date were excluded (n=96 821).
Main outcomes
We used ICD-10 codes to identify diagnoses from the administrative claims data from 1 January to 31 December for each group (see eTable 1 for ICD-10 classification details). We grouped clinically similar diagnoses to examine potential associations between covid-19 and different organ systems or disease groups, and included atopic dermatitis as a negative control.8 For each event, we identified a population that was at risk for the diagnosis, defined as those who had no record of that diagnosis in the year before the index date up to 14 days before the index date. We used 14 days before the index date to account for a possible time lag from having covid-19 to getting a test, and the time lag of having a diagnosis of covid-19 (eTable 3 and eFigure 3). We identified persistent events as diagnoses that were reported in both the acute period (from 14 days before the index date to 20 days after the index date) and the post-acute period (≥21 days after the index date), and new events as new diagnoses reported during the post-acute period. We considered all diagnoses to be binary.
Study variables
To assess the health status of individuals, we looked at the calendar year before the index date up to 14 days before the index date and identified: Charlson and Elixhauser comorbidities; previous clinical conditions; and previous visits to a primary care physician, cardiologist, or nephrologist. We also determined total hospital length of stay within the previous calendar year; information on race (non-Hispanic white, non-Hispanic black, non-Hispanic Asian, Hispanic, and other races); and other demographic information (age, sex, and socioeconomic status) in the previous calendar year. Information on race for individuals was current up to June 2019. Index scores for socioeconomic status specific to zip codes9 were derived from the 2017 American Community Survey five year estimate data.10 For predicting propensity scores, missing values for socioeconomic status scores were imputed with population medians, and missing values for sex, US state, and race were imputed with reference categories (female, not belonging to the top 10 US states with the most individuals infected with SARS-CoV-2, and multi-racial, respectively). For subsequent subgroup statistical inference, individuals with corresponding missing values were excluded. We also accounted for the month of the actual or assigned index dates of individuals to adjust for seasonality effects.
Follow-up periods
After a diagnosis of covid-19 or a positive PCR test, patients were observed for persistent or new diagnoses. The follow-up period started 21 days after the index date and continued to a persistent or new event, disenrollment from the insurance plan (as a result of death or withdrawal), or the end of the study period (31 December 2020 for the SARS-CoV-2 infection group and the 2020 comparison group, 31 December 2019 for the 2019 comparison group, or 31 December of each year used to construct the viral lower respiratory tract illness group), whichever occurred first.
Statistical analysis
Propensity score matching
We used matching by propensity score to create three comparison groups (2020 and 2019 comparison groups, and the viral lower respiratory tract illness group) that were similar to the SARS-CoV-2 group in terms of baseline characteristics and relevant confounders.11 We estimated a propensity score for each individual based on 120 variables by logistic regression with ridge penalty,12 13 as explained in the methods (study variables).
Because of the large study sample (n=2 895 943) of the SARS-CoV-2 and 2020 comparison groups, we did not perform conventional 1:1 nearest neighbor matching. Instead, we generated 40 000 bins based on propensity scores, and in each small bin, we created sets of individuals of equal size from the SARS-CoV-2 and 2020 comparison groups. We matched within the bins and then combined all sets to form the propensity matched 2020 group. This process was repeated for the 2019 comparison group, but we reduced the bin count to 1000 to improve the matching rate. A bin count of 1000 allows a high matching rate such that the results from the 2020 and 2019 control groups were comparable. We also included a sensitivity analysis (eTable 4c-d and eFigure 2d) by exactly matching the condition of dementia as well as matching by propensity score, because we found imbalance issues with dementia and other related neurological disorders when matching by propensity score only for the 2019 comparison group. For the viral lower respiratory tract illness comparison group, we used 1:1 nearest neighbor matching with a caliper of 0.2 because the sample size of the this group was much smaller than the 2020 comparison group and 1:1 nearest neighbor matching was less computationally intensive. We assessed covariate balance after matching by absolute standardized mean difference. Plots of absolute standardized mean difference for selected important variables (eFigure 2a-d) and for all 120 variables (eTable 2) showed that the three comparison groups were well matched to the SARS-CoV-2 infection group.
Data analysis
We evaluated differences in demographic and clinical factors between the SARS-CoV-2 infected group and the comparator group before matching (with the two sided Student’s t test and Pearson χ2 test to compare numeric and categorical factors, respectively). We also determined the proportion of individuals in the SARS-CoV-2 and comparison groups matched by propensity score with none, one, or more than one persistent or new diagnosis in the period after the acute infection. Individuals in the SARS-CoV-2 group with less than 21 days of data from the index date were excluded from our analyses, along with their matched pairs. A similar investigation was performed to look at individuals with persistent or new diagnoses by subgroup (age, race, sex, and admitted to hospital for covid-19). We also evaluated the significance of the interaction between SARS-CoV-2 infection status and these subgroups in having at least one new or persistent sequela after the acute infection. We used McNemar’s test to evaluate the difference in proportion from these analyses after matching.
In our main analysis, we evaluated the risk for each new or persistent clinical diagnosis in the period after the acute infection in the at risk population by computing risk difference and hazard ratios. We applied the Kaplan-Meier estimator to obtain the cumulative incidence14 of a given diagnosis for the SARS-CoV-2 and comparison groups in the 141 days after the index date. We defined the risk difference as the difference between the cumulative incidence of the SARS-CoV-2 group and the comparison group. Statistical inference to estimate the risk difference was conducted with bootstrapping. We sampled matched pairs of individuals with replacement from the SARS-CoV-2 group and the comparison group to construct the 95% confidence interval of the risk difference. Corresponding bootstrapped statistical tests for the Kaplan-Meier based risk difference were one sided:
| Ho: SARS-CoV-2 cumulative incidence − comparison group cumulative incidence ≤0 |
| Hα: SARS-CoV-2 cumulative incidence − comparison group cumulative incidence >0 |
We also tested the proportional hazards assumption with Schoenfeld residuals,15 and estimated hazard ratios with 95% confidence intervals with Cox proportional hazards models and robust variance estimation with clustering for matched pairs.16 Corresponding statistical tests for hazard ratios were also one sided.
To overcome the problem of multiple comparisons, we applied the Bonferroni correction for P values and confidence intervals by multiplying P values by N and estimating confidence intervals (calculated as ((1−(0.05÷N))×100%), where N=53 was the number of outcomes tested in the main analysis. For all data analyses, we used R with survminer,17 survival,18 glmnet,19 and stats20 libraries.
Subgroup analysis
We performed stratified analyses by four demographic and clinical factors with the SARS-CoV-2 cohort and the 2020, 2019, and viral lower respiratory tract illness comparison groups, looking at age (65–74, ≥75), sex (men, women), race (non-Hispanic white, non-Hispanic black), and admission to hospital for covid-19 (yes, no). The analysis was limited to white and black races because the other racial groups were small. We performed matching by propensity score within each group for age, race, and sex before calculating the risk difference. The original full sample propensity score matching was maintained when we evaluated the interaction between infection status and admission to hospital for covid-19. To test for interactions, we evaluated the significance of the fitted coefficient for the interaction term (the interaction between the exposure and a dummy variable of each subgroup) in a linear model including main effect variables, with a Bonferroni correction (n=53 × number of levels in each subgroup).
Patient and public involvement
Patients and the public were not directly involved in the study. Several members of the public who had recovered from covid-19 read and provided feedback on our manuscript.
Results
We identified 133 366 individuals aged ≥65 years infected with the SARS-CoV-2 virus in 2020 who met our study criteria (fig 1). After matching by propensity score, we identified 132 847 matched pairs for the primary (2020) comparison group (99.6% of SARS-CoV-2 individuals matched), 133 266 matched pairs for the secondary (2019) comparison group (99.9% of SARS-CoV-2 individuals matched), and 113 190 matched pairs for the viral lower respiratory tract illness comparison group (84.9% of SARS-CoV-2 individuals matched) (eFigure 1a and eFigure 1b). Individuals (or their match) with less than 21 days of data after the index date were excluded, resulting in a final analytic dataset of 87 337 SARS-CoV-2 individuals matched to 2020 individuals, 88 070 SARS-CoV-2 individuals matched to 2019 individuals, and 73 490 SARS-CoV-2 individuals matched to individuals in the viral lower respiratory tract illness group.
Fig 1.
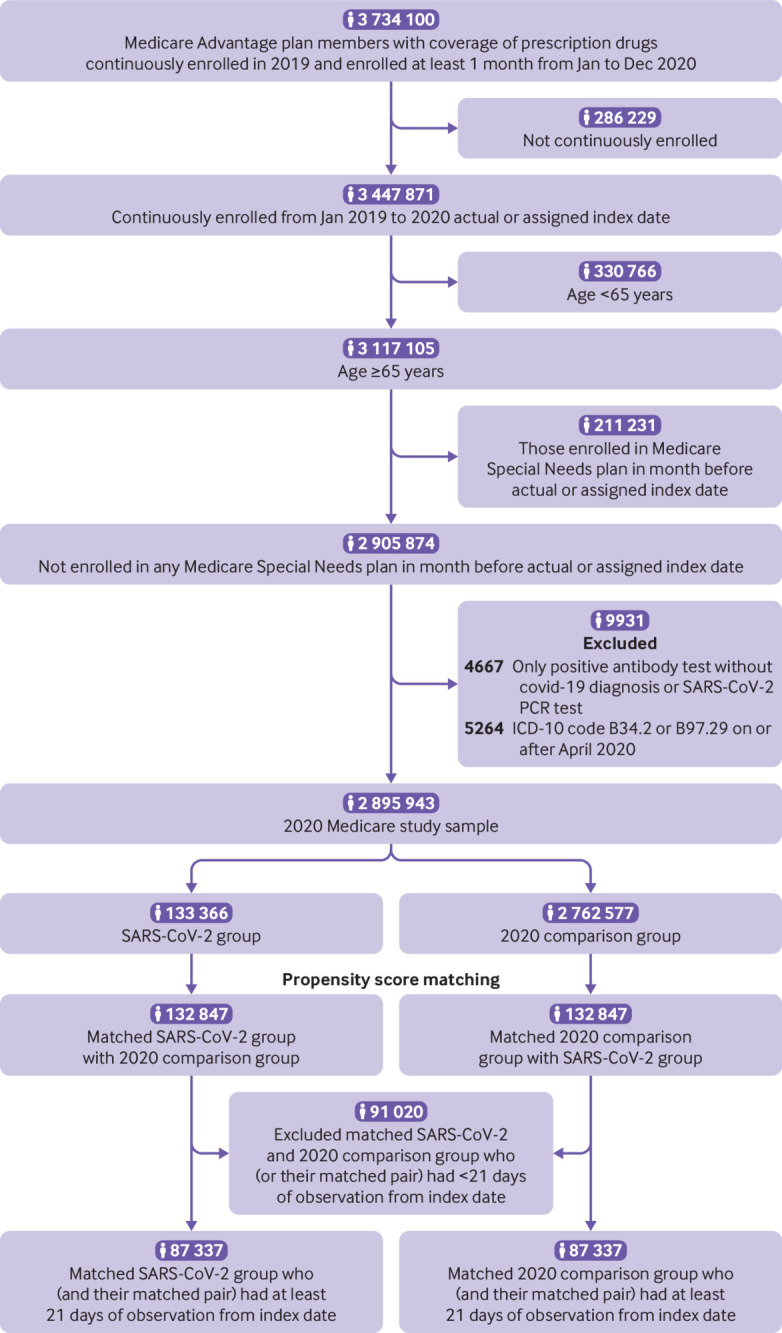
Flowchart of 2020 cohort sample. PCR=polymerase chain reaction; ICD-10=international classification of diseases, 10th revision
Relative to their unmatched 2020 and 2019 comparison groups, individuals with SARS-CoV-2 infection were more likely to be older, men, have a lower socioeconomic status index, be of black or Hispanic race, live in midwestern and northeastern US states, have had a pre-existing comorbidity, have had a longer inpatient hospital stay during the preceding year, and have visited a primary care physician, cardiologist, or nephrologist more often (all P≤0.05). We found similar patterns between the SARS-CoV-2 individuals and those with viral lower respiratory tract illness although the lower respiratory tract illness group was more likely to smoke and have asthma (table 1).
Table 1.
Demographics, previous comorbidities and conditions, and clinical factors among Medicare adults aged ≥65 years matched by propensity score. Data are number (%) of participants unless stated otherwise
| Characteristic | Total 2020 population | 2020 SARS-CoV-2 infected | 2020 comparison | 2019 comparison | vLRTI |
|---|---|---|---|---|---|
| Total No | 2 895 943 | 133 366 | 2 762 577 | 2 756 247 | 829 042 |
| Median (IQR) No of observation days | 78 (30-175) | 56 (27-148) | 79 (30-176)* | 80 (30-176)* | 233 (84-317)* |
| Mean (SD) age (years) | 75.7 (7.0) | 76.9 (7.7) | 75.7 (6.9)* | 75.7 (7.0)* | 77.1 (7.7)* |
| Median (IQR) age (years): | 74 (70-80) | 75 (71-82) | 74 (70-80)* | 74 (70-80)* | 76 (71-82)* |
| 65-74 | 1 498 232 (52) | 61 641 (46) | 1 436 591 (52)* | 1 419 088 (52)* | 367 063 (44)* |
| >74 | 1 397 711 (48) | 71 725 (54) | 1 325 986 (48)* | 1 337 159 (49)* | 461 979 (56)* |
| Male sex | 1 227 545 (42) | 58 110 (44) | 1 169 435 (42)* | 1 163 549 (42)* | 342 992 (41)* |
| SES index: | |||||
| Mean (SD) | 53 (2.8) | 52 (2.9) | 53 (2.8)* | 53 (2.8)* | 52 (2.8)* |
| Median (IQR) | 53 (51-54) | 52 (51-54) | 53 (51-54)* | 53 (51-54)* | 52 (51-54)* |
| Race: | |||||
| White | 2 317 481 (80) | 103 918 (78) | 2 213 563 (80)* | 2 214 307 (80)* | 692 232 (84)* |
| Black | 262 336 (9.1) | 14 498 (11) | 247 838 (9.0)* | 262 483 (9.5)* | 69 592 (8.4)* |
| Asian | 60 403 (2.1) | 1926 (1.4) | 58 477 (2.1)* | 58 459 (2.1)* | 14 981 (1.8)* |
| Hispanic | 53 458 (1.8) | 4559 (3.4) | 48 899 (1.8)* | 50 932 (1.8)* | 15 458 (1.9)* |
| Other | 202 265 (7.0) | 8465 (6.3) | 193 800 (7.0)* | 170 066 (6.2)* | 36 779 (4.4)* |
| Index month: | |||||
| Before March | — | 219 (0.2) | — | — | 283746 (34)* |
| March | — | 2776 (2.1) | — | — | 93 663 (11)* |
| April | — | 7561 (5.7) | — | — | 69 058 (8.3)* |
| May | — | 6617 (5.0) | — | — | 58 561 (7.1)* |
| June | — | 8441 (6.3) | — | — | 45 576 (5.5)* |
| July | — | 14 145 (11) | — | — | 36 040 (4.3)* |
| August | — | 9319 (7.0) | — | — | 34 320 (4.1)* |
| September | — | 7843 (5.9) | — | — | 38 780 (4.7)* |
| October | — | 13 675 (10) | — | — | 44 873 (5.4)* |
| November | — | 26 464 (20) | — | — | 51 150 (6.2)* |
| December | — | 36 306 (27) | — | — | 73 275 (8.8)* |
| Previous comorbidity: | |||||
| Any comorbidity† | 2 617 399 (90) | 127 379 (96) | 2 490 020 (90)* | 2 505 137 (91)* | 789 892 (95)* |
| 1 comorbidity† | 374 310 (13) | 10 535 (7.9) | 363 775 (13)* | 346 231 (13)* | 70 360 (8.5)* |
| 2 comorbidities† | 394 851 (14) | 12 622 (9.5) | 382 229 (14)* | 369 691 (13)* | 87 796 (11)* |
| 3 comorbidities† | 368 671 (13) | 13 282 (10) | 355 389 (13)* | 350 749 (13)* | 94 924 (11)* |
| 4 comorbidities† | 343 162 (12) | 14 110 (10) | 329 052 (12)* | 326 126 (12)* | 95 725 (12)* |
| ≥5 comorbidities† | 1 136 405 (39) | 76 830 (57) | 1 059 575 (38)* | 1 112 340 (40)* | 441 087 (53)* |
| AIDS/HIV | 3650 (0.1) | 233 (0.2) | 3417 (0.1)* | 3251 (0.1)* | 1067 (0.1)* |
| Alcohol abuse | 42 132 (1.5) | 2267 (1.7) | 39 865 (1.4)* | 39 219 (1.4)* | 11 636 (1.4)* |
| Anemia | 484 980 (17) | 35 128 (26) | 449 852 (16)* | 483 675 (18)* | 197 044 (24)* |
| Cerebrovascular disease | 364 782 (13) | 25 470 (19) | 339 312 (12)* | 367 388 (13)* | 141 848 (17)* |
| Chronic pulmonary disease | 578 650 (20) | 35 527 (27) | 543 123 (20)* | 582 790 (21)* | 311 533 (38)* |
| Coagulopathy | 94 781 (3.3) | 6473 (4.9) | 88 308 (3.2)* | 94 093 (3.4)* | 39 986 (4.8) |
| Congestive heart failure | 334 654 (12) | 26 306 (20) | 308 348 (11)* | 325 547 (12)* | 168 163 (20)* |
| Dementia | 145 766 (5.0) | 18 971 (14) | 126 795 (4.6)* | 142 945 (5.2)* | 64 367 (7.8)* |
| Depression | 348 236 (12) | 24 260 (18) | 323 976 (12)* | 333 307 (12)* | 118 630 (14)* |
| Drug abuse | 54 651 (1.9) | 3137 (2.4) | 51 514 (1.9)* | 50 905 (1.8)* | 17 710 (2.1)* |
| Fluid and electrolyte disorders | 343 320 (12) | 26 401 (20) | 316 919 (12)* | 344 712 (13)* | 149 004 (18)* |
| Hypertension | 2 081 772 (72) | 107 473 (81) | 1 974 299 (72)* | 2 011 264 (73)* | 651 432 (79)* |
| Hypothyroidism | 605 081 (21) | 32 165 (24) | 572 916 (21)* | 585 973 (21)* | 193 899 (23)* |
| Liver disease | 172 336 (6.0) | 10 226 (7.7) | 162 110 (5.9)* | 164 101 (6.0)* | 54 011 (6.5)* |
| Lymphoma | 30 599 (1.1) | 1926 (1.4) | 28 673 (1.0)* | 29 313 (1.1)* | 15 068 (1.8)* |
| Metastatic cancer | 50 143 (1.7) | 2934 (2.2) | 47 209 (1.7)* | 47 237 (1.7)* | 23 588 (2.8)* |
| Moderate to severe liver disease | 11 522 (0.4) | 866 (0.6) | 10 656 (0.4)* | 10 958 (0.4)* | 4892 (0.6)* |
| Myocardial infarction | 110 805 (3.8) | 7989 (6) | 102 816 (3.7)* | 109 485 (4.0)* | 48 262 (5.8)* |
| Obesity | 478 902 (17) | 27 967 (21) | 450 935 (16)* | 469 062 (17)* | 135 145 (16)* |
| Other neurological disorders | 359 978 (12) | 31 807 (24) | 328 171 (12)* | 356 072 (13)* | 148 387 (18)* |
| Paralysis | 53 159 (1.8) | 5260 (3.9) | 47 899 (1.7)* | 52 773 (1.9)* | 23 659 (2.9)* |
| Peptic ulcer disease | 37 722 (1.3) | 2650 (2.0) | 35 072 (1.3)* | 39 164 (1.4)* | 15 315 (1.8)* |
| Peripheral vascular disease | 570 440 (20) | 38 078 (29) | 532 362 (19)* | 547 994 (20)* | 203 550 (25)* |
| Psychoses | 113 191 (3.9) | 8284 (6.2) | 104 907 (3.8)* | 103 805 (3.8)* | 34 503 (4.2)* |
| Pulmonary circulation disorder | 46 502 (1.6) | 3693 (2.8) | 42 809 (1.5)* | 48 096 (1.7)* | 26 252 (3.2)* |
| Renal failure | 528 314 (18) | 33 785 (25) | 494 529 (18)* | 489 941 (18)* | 180 270 (22)* |
| Rheumatoid arthritis | 197 050 (6.8) | 11 002 (8.2) | 186 048 (6.7)* | 195 281 (7.1)* | 70 021 (8.4)* |
| Solid tumor without metastasis | 368 557 (13) | 18 995 (14) | 349 562 (13)* | 355 669 (13)* | 128 946 (16)* |
| Valvular disease | 391 782 (14) | 24 336 (18) | 367 446 (13)* | 386 419 (14)* | 147 694 (18)* |
| Weight loss | 130 719 (4.5) | 10 194 (7.6) | 120 525 (4.4)* | 129 398 (4.7)* | 55 951 (6.7)* |
| Previous conditions: | |||||
| Alzheimer’s dementia | 165 953 (5.7) | 20 761 (16) | 145 192 (5.3)* | 162 413 (5.9)* | 73 722 (8.9)* |
| Asthma | 184 855 (6.4) | 11 222 (8.4) | 173 633 (6.3)* | 182 913 (6.6)* | 94 302 (11)* |
| Cystic fibrosis | 240 (0.0) | 15 (0.0) | 225 (0.0) | 259 (0.0) | 150 (0.0) |
| Immunodeficiency | 32 836 (1.1) | 2024 (1.5) | 30 812 (1.1)* | 30 174 (1.1)* | 12 802 (1.5) |
| Pulmonary fibrosis | 43 809 (1.5) | 2992 (2.2) | 40 817 (1.5)* | 43 218 (1.6)* | 23 922 (2.9)* |
| Sickle cell disease | 1214 (0.0) | 87 (0.1) | 1127 (0.0)* | 1216 (0.0)* | 355 (0.0)* |
| Smoking | 157 912 (5.5) | 5878 (4.4) | 152 034 (5.5)* | 152 473 (5.5)* | 61 085 (7.4)* |
| Thalassemia | 3818 (0.1) | 167 (0.1) | 3651 (0.1) | 3732 (0.1) | 1125 (0.1) |
| Type 1 diabetes | 38 290 (1.3) | 3042 (2.3) | 35 248 (1.3)* | 43 634 (1.6)* | 20 476 (2.5)* |
| Type 2 diabetes | 845 195 (29) | 51 516 (39) | 793 679 (29)* | 818 570 (30)* | 282 907 (34)* |
| Mean (SD) previous inpatient length of stay (days) | 1.3 (7.0) | 3.6 (14) | 1.2 (6.5)* | 1.4 (7.4)* | 3.6 (14) |
| Previous primary care physician visit (yes) | 2 458 360 (85) | 114 867 (86) | 2 343 493 (85)* | 576 228 (21)* | 186 810 (23)* |
| Mean (SD) No of previous primary care physician visit days | 4.1 (4.2) | 4.9 (4.9) | 4.1 (4.2)* | 1 (2.7)* | 1.4 (3.6)* |
| Previous cardiology visit (yes) | 888 432 (31) | 54 460 (41) | 833 972 (30)* | 188 419 (6.8)* | 76 411 (9.2)* |
| Mean (SD) No of previous cardiology visit days | 1 (2.7) | 1.6 (4.1) | 0.9 (2.6)* | 0.2 (1.2)* | 0.3 (1.7)* |
| Previous nephrology visit (yes) | 120 015 (4.1) | 9810 (7.4) | 110 205 (4.0)* | 35 979 (1.3)* | 16 579 (2.0)* |
| Mean (SD) No of previous nephrology visit days | 0.2 (1.8) | 0.5 (3.5) | 0.2 (1.6)* | 0 (0.7)* | 0.1 (1.3)* |
| Region: | |||||
| South | 1 123 526 (39) | 53 607 (40) | 1 069 919 (39)* | 1 117 232 (41)* | 368 255 (44)* |
| Midwest | 552 853 (19) | 28 356 (21) | 524 497 (19)* | 500 534 (18)* | 152 618 (18)* |
| Northeast | 396 474 (14) | 21 609 (16) | 374 865 (14)* | 379 921 (14)* | 105 980 (13)* |
| West | 820 433 (28) | 29 684 (22) | 790 749 (29)* | 756 550 (27)* | 201 635 (24)* |
| Unknown | 2657 (0.1) | 110 (0.1) | 2547 (0.1) | 2010 (0.1) | 554 (0.1)* |
| Clinical characteristics‡: | |||||
| Covid ICU visit (yes) | — | 8569 (6.4) | — | — | — |
| Covid hospital admission status (yes) | — | 35 939 (27) | — | — | — |
| Diagnostic method§: | |||||
| PCR test positive | — | 26 151 (20) | — | — | — |
| Clinical diagnosis (not PCR test) | — | 107 215 (80) | — | — | — |
IQR=interquartile range; SD=standard deviation; SES=socioeconomic status; vLRTI=viral lower respiratory tract illness; ICU=intensive care unit; PCR=polymerase chain reaction; observation days=measured from the index date to the end of the member observation period.
All P values ≤0.05 comparing SARS-CoV-2 individuals with three comparison groups with two sided Student’s t test or Pearson χ2 test.
Includes all comorbidities and conditions listed.
Covid ICU visit=having an inpatient claim with a clinical diagnosis related to covid-19 and a revenue code related to intensive care (0200, 0201, 0202, 0209); Covid hospital admission status=having an inpatient claim with a clinical diagnosis related to covid-19.
Presented as hierarchical (ie, those with a positive PCR test positive are shown first, even if they had a clinical diagnosis, and then those that had only a clinical diagnosis and no positive PCR test), although individuals might have more than one diagnostic method recorded.
Among individuals infected with SARS-CoV-2 matched to the 2020 cohort, 68% did not have new or persistent diagnoses in the post-acute phase that required medical attention during the follow-up period, 16% had one diagnosis that required medical attention, and 16% had two or more diagnoses in the post-acute phase that required medical attention (table 2).) Overall, >70% of patients in the post-acute phase had new onset compared with persistent sequelae. Pulmonary embolism and respiratory failure were the exceptions, where the majority of events occurred during the acute phase and therefore were considered persistent during the post-acute phase (eTable 6a-c).
Table 2.
Number (%) of adults aged ≥65 years with sequelae after acute covid-19 infection within matched cohorts per 100 individuals
| Sequelae* | SARS-CoV-2 infected (n=87 337) | 2020 comparison group (n=87 337) | 2020 comparison group difference (95% CI) | SARS-CoV-2 infected (n=88 070) | 2019 comparison group (n=88 070) | 2019 comparison group difference (95% CI) | SARS-CoV-2 infected (n=73 490) | vLRTI comparison group (n=73 490) | vLRTI comparison group difference (95% CI) |
|---|---|---|---|---|---|---|---|---|---|
| None | 59 639 (68) | 69 218 (79) | −11 (−11.4 to −10.6)† | 60 021 (68) | 67 000 (76) | −7.9 (−8.3 to −7.5)† | 49 508 (67) | 48 462 (66) | 1.4 (0.9 to 1.9)† |
| 1 | 13 992 (16) | 11 382 (13) | 3 (2.7 to 3.3)† | 14 075 (16) | 12 361 (14) | 1.9 (1.6 to 2.3)† | 11 962 (16) | 11 993 (16) | 0 (−0.4 to 0.3) |
| ≥2 | 13 706 (16) | 6737 (7.7) | 8 (7.7 to 8.3)† | 13 974 (16) | 8709 (9.9) | 6 (5.7 to 6.3)† | 12 020 (16) | 13 035 (18) | −1.4 (−1.8 to −1)† |
vLRTI=viral lower respiratory tract illness. Only matched SARS-CoV-2 and comparison group pairs are included, both having at least 21 days of observation from the index date.
Sequelae are new or persistent clinical diagnoses determined 21 or more days after the index date and were not present up to 14 days before the index date.
P≤0.001 (McNemar test).
The proportion of individuals with one or more sequelae in the SARS-CoV-2 group was 11% higher than the 2020 comparison group, 7.9% higher than the 2019 comparison group, and 1.4% lower than the viral lower respiratory tract illness infection group. For the subgroup of individuals admitted to hospital because of covid-19, estimated risk differences for at least one sequela were 23.6%, 19%, and 8.9% relative to the 2020, 2019, and viral lower respiratory tract illness comparison groups, respectively (table 3).
Table 3.
Number/total Number (%) of adults aged ≥65 years with sequelae* after acute covid-19 infection in the SARS-CoV-2 infected cohort, and the 2020, 2019, and viral lower respiratory tract illness comparison cohorts, and subpopulation cohorts per 100 individuals
| Cohort | SARS-CoV-2 infected (n=87 337) | 2020 comparison group (n=87 337) | 2020 comparison group difference (95% CI) | SARS-CoV-2 infected (n=88 070) | 2019 comparison group (n=88 070) | 2019 comparison group difference (95% CI) | SARS-CoV-2 infected (n=73 490) | vLRTI comparison group (n=73 490) | vLRTI comparison group difference (95% CI) |
|---|---|---|---|---|---|---|---|---|---|
| Overall | 27 698/87 337 (32) | 18 119/87 337 (21) | 11 (10.6 to 11.4)† | 28 049/88 070 (32) | 21 070/88 070 (24) | 7.9 (7.5 to 8.3)† | 23 982/73 490 (33) | 25 028/73 490 (34) | −1.4 (−1.9 to −0.9)† |
| Age (years): | |||||||||
| >74 | 15 946/46 350 (34) | 10 537/46 350 (23) | 11.7 (11.1 to 12.2)†‡ | 16 315/47 400 (34) | 12 630/47 400 (27) | 7.8 (7.2 to 8.4)† | 14 333/40 937 (35) | 15 468/40 937 (38) | −2.8 (−3.4 to −2.1)†‡ |
| 65-74 | 11 495/40 051 (29) | 7266/40 051 (18) | 10.6 (10 to 11.1)†‡ | 11 689/40 750 (29) | 8233/40 750 (20) | 8.5 (7.9 to 9.1)† | 9445/31 793 (30) | 9306/31 793 (29) | 0.4 (−0.3 to 1.1)‡ |
| Race: | |||||||||
| Black | 3827/10 292 (37) | 2624/10 292 (26) | 11.7 (10.5 to 12.9)† | 3399/9320 (37) | 2757/9320 (30) | 6.9 (5.5 to 8.2)† | 2431/6475 (38) | 2661/6475 (41) | −3.6 (−5.2 to −1.9)†‡ |
| White | 20 793/67 027 (31) | 13 466/67 027 (20) | 10.9 (10.5 to 11.4)† | 21 171/68 009 (31) | 15 875/68 009 (23) | 7.8 (7.3 to 8.3)† | 18 192/56 338 (32) | 18 840/56 338 (33) | −1.2 (−1.7 to −0.6)†‡ |
| Sex: | |||||||||
| Women | 15 552/49 054 (32) | 10 389/49 054 (21) | 10.5 (10 to 11.1)†‡ | 15 844/49 853 (32) | 12 256/49 853 (25) | 7.2 (6.6 to 7.8)†‡ | 13 421/41 363 (32) | 13 920/41 363 (34) | −1.2 (−1.8 to −0.6)† |
| Men | 11 898/37 503 (32) | 7580/37 503 (20) | 11.5 (10.9 to 12.1)†‡ | 12 183/38 208 (32) | 8947/38 208 (23) | 8.5 (7.8 to 9.1)†‡ | 10 469/31 941 (33) | 11 017/31 941 (35) | −1.7 (−2.4 to −1)† |
| Covid-19 hospital admission: | |||||||||
| Admitted for covid-19 | 10 906/23 486 (46) | 5359/23 486 (23) | 23.6 (22.8 to 24.5)†‡ | 11 082/23 887 (46) | 6538/23 887 (27) | 19 (18.2 to 19.9)†‡ | 10 750/22 861 (47) | 8721/22 861 (38) | 8.9 (8 to 9.8)†‡ |
| Not admitted for covid | 16 798/63 690 (26) | 12 710/63 690 (20) | 6.4 (6 to 6.9)†‡ | 16 859/64 194 (26) | 14 618/64 194 (23) | 3.5 (3 to 4)†‡ | 13 661/50 512 (27) | 17 383/50 512 (34) | −7.4 (−7.9 to −6.8)†‡ |
vLRTI=viral lower respiratory tract illness. Only matched SARS-CoV-2 and comparison group pairs are included, both having at least 21 days of observation from the index date.
Sequelae are new or persistent clinical diagnoses determined 21 or more days after the index date and were not present up to 14 days before the index date.
P≤0.001 (McNemar test).
Significant (P≤0.05) interaction term between subgroup and SARS-CoV-2 infection status.
Increased risks for clinical sequelae after acute covid-19 infection were consistently seen for many diagnoses compared with the 2020 and 2019 comparison groups. Figure 2 summarizes the most common diagnoses, and eTables 4a-b the less common diagnoses. Compared with the 2020 comparison group, estimates for risk difference for post-acute sequelae caused by SARS-CoV-2 infection ranged from 0.55 per 100 people for liver test abnormalities (95% confidence interval 0.29 to 0.80), to 4.43 for hypertension (2.27 to 6.37), and 7.55 for respiratory failure (7.18 to 8.01) (eTable 4a). Estimates for hazard ratios ranged from 1.76 (95% confidence interval 1.58 to 1.97) for mental health disorders up to 7.55 (6.70 to 8.51) for respiratory failure compared with the 2020 comparison group (eTable 4b). For the most frequently reported symptoms of fatigue and myalgias in the post-acute infection phase, the estimated risk differences were 5.80 (95% confidence interval 5.19 to 6.57) per 100 people and 2.25 (1.57 to 2.95), respectively. eTables 4a-b show other sequelae after the acute infection with significant risk differences and hazard ratios relative to the 2020 comparison group.
Fig 2.

SARS-CoV-2 group versus 2020 comparison group for risk difference per 100 individuals (left) and hazard ratio (right) for clinical sequelae in post-acute phase. Clinical sequelae are diagnoses with incidence ≥ 1 per 100 in the SARS-CoV-2 group at 120 days after the start of the post-acute phase (index date +21 days) and highest in hierarchy if an aggregate or group diagnosis is noted. This rule was adopted to avoid confidence intervals that were too wide to display. Symptoms are not displayed. eTables 4a-b list all associations for each of the 53 outcomes. Symbols indicate significant risk difference or hazard ratio (Bonferroni corrected P value ≤0.05); atopic dermatitis=negative control. *Aggregate diagnosis includes all subdiagnoses (eTable 1). DVT=deep vein thrombosis; PE=pulmonary embolism; PAO=peripheral arterial occlusion; CHF=congestive heart failure
Those aged ≥75 years and infected with SARS-CoV-2 had a larger risk difference than those aged 65-74 years for several neurological sequelae, including dementia, encephalopathy, and amnesia (fig 3 and eTable 5a) (all Pinteractions≤0.001). Black individuals had a significantly increased risk difference for respiratory failure and acute kidney injury (fig 3 and eTable 5b) (all Pinteractions≤0.001). We found the same pattern for sex, with men having a significantly higher risk difference for respiratory failure and acute kidney injury (fig 3 and eTable 5c) (all Pinteractions≤0.001). The 2020 cohort admitted to hospital for covid-19 had significantly higher risks (all Pinteractions≤0.001) for sequelae after the acute infection than those not requiring hospital admission for most of the diagnoses, including cardiovascular, cerebrovascular, respiratory, and neurological sequelae, diabetes, kidney injury, mental health, and fatigue (fig 3 and eTable 5d).
Fig 3.

Risk difference per 100 individuals for clinical sequelae in post-acute phase by age, race, sex, and admission to hospital for covid-19 in the 2020 cohort. Clinical sequelae are diagnoses with incidence ≥ 1 per 100 in the SARS-CoV-2 group for any subgroup at 120 days after the start of the post-acute phase (index date +21 days) and highest in hierarchy if an aggregate or group diagnosis is noted. This rule was adopted to avoid confidence intervals that were too wide to display. Symptoms are not displayed. eTables 5a-d list all associations for each of the 53 outcomes. Filled symbols indicate significant interaction term (Bonferroni corrected P value ≤0.05); atopic dermatitis=negative control. *Aggregate diagnosis includes all subdiagnoses (eTable 1)
Discussion
Although research on sequelae after acute SARS-CoV-2 infection is now available for large general populations of patients and cohorts of patients who were admitted to hospital for covid-19,1 2 3 4 5 6 7 few data are available for older adults. In a recent large meta-analysis of 45 studies examining sequelae after acute SARS-CoV-2 infection, only three studies had a median age >65 years (n=251 patients).1
We estimated that during the post-acute period, 32 of every 100 individuals aged ≥65 years infected with SARS-CoV-2 had a diagnosis of one or more new clinical sequelae that required medical attention. These outcomes included chronic respiratory failure, cardiac sequelae (including cardiac rhythm disorders and acute coronary syndromes), hypercoagulability, neurological disorders (such as encephalopathy, dementia, memory difficulties, and stroke), kidney injury, diabetes, and anemia. Comparing individuals with SARS-CoV-2 with those with viral lower respiratory tract illness, however, differences in post-acute sequelae were small and significant only for an increased risk of respiratory failure, post-viral fatigue, and dementia. Although admission to hospital for covid-19 was associated with a markedly increased risk of persistent and new sequelae for almost all clinical conditions, the larger population of patients aged ≥65 years who did not require admission to hospital for covid-19 were still at risk for persistent or new clinical sequelae in the post-acute phase.
Comparison with other studies
The incidence of sequelae after acute SARS-CoV-2 infection seemed to be much lower in patients with less severe disease. An analysis of data from the US Veterans Affairs compared incident sequelae at six months in 73 435 survivors of covid-19 who were not admitted to hospital for covid-19 with almost five million patients cared for in the Veterans Affairs health system who did not have a diagnosis of covid-19.3 Similarly, we conducted a retrospective analysis of 266 586 adults aged 18-65 years who were commercially insured and infected with SARS-CoV-2 and from the same data warehouse as this study.7 Although the estimated risk differences were smaller in both of these studies compared with the older population in this study, the types of sequalae found in excess among patients infected with SARS-CoV-2 were similar, and the most common were respiratory disease, hypertension, sleep disorders, nervous system disorders, myalgias, and fatigue.
Several other studies have examined the long term sequelae of infection with SARS-CoV-2 but not specifically in an older population. Cirulli et al looked at sequelae after SARS-CoV-2 infection in an adult cohort of 357 individuals compared with controls matched by propensity score.21 Patients tended to have mild disease, with <3% of individuals requiring admission to hospital. At 90 days from the onset of infection, 14.8% still had symptoms. Symptom burden correlated with the severity of the initial infection and the most common sequelae were anosmia or ageusia, or both, cognitive difficulties and memory loss, dyspnea, and chest pain. A study by Lund et al compared 8983 Danish outpatients two weeks to six months after SARS-CoV-2 infection with a cohort matched by propensity score.22 The SARS-C0V-2 cohort had an increased risk of having a new diagnosis of dyspnea and venous thromboembolism. The authors did not identify an increased risk of other serious sequelae of SARS-CoV-2 infection. We reported an increased risk for multiple serious sequelae in our cohort who did not require admission to hospital for covid-19 (eTable 5d). Stavem et al looked at 451 individuals in Norway 1.5-6 months after the onset of SARS-C0V-2 infection23: 53% of women and 67% of men were symptom free, whereas 16% reported dyspnea, 12% loss or disturbance of smell, and 10% loss or disturbance of taste. Persistent symptoms were related to the severity of the initial illness and the number of comorbidities. The higher risk of persistent and new sequelae in our study compared with these previous studies is probably because of our focus on those aged ≥65 years, inclusion of those who did and did not require admission to hospital, and inclusion of incident and persistent sequelae.
Other studies have examined the natural course and clinical sequelae after infection with SARS-CoV-2 predominantly, but not exclusively, in patients admitted to hospital for covid-19.1 2 3 4 5 6 These studies included symptoms reported by patients and therefore had higher incidences of sequelae. The most common sequelae reported were fatigue, muscle weakness, behavioral health complaints, and respiratory symptoms, including persistent dyspnea. The overall rates of having at least one late sequela in these studies ranged from 51% to 76%.
Strengths and limitations of this study
ICD-10 codes have been shown to be valid for many clinical conditions24 but unreliable for codes based on symptoms.25 Therefore, we anticipate that the true incidence of symptoms is not accurately reflected in ICD-10 codes and would be better determined by surveys where patients report their symptoms, as in some of the previous studies.1 2 3 4 5 6 Other potential limitations of ICD-10 codes are that individuals might be misclassified because of the retrospective nature of the study and the inherent limitation of using claims to define variables. We might not have captured all ICD-10 codes for each outcome, although the most common ones were included. Also, the excess risk for some chronic disease sequelae in the post-acute phase, such as hypertension and dementia, could be because of the increased medical attention after SARS-CoV-2 infection. In these patients, the diagnosis might not truly represent a new condition triggered by SARS-CoV-2 infection. Lastly, many lower respiratory tract illnesses and exacerbations of chronic obstructive pulmonary disease cannot be definitively classified as viral versus bacterial by the treating physician. Therefore, our viral lower respiratory tract illness group probably included individuals with bacterial infections, making this group seem more ill.
One of the strengths of this retrospective analysis was the large sample size that allowed us to assess multiple and infrequent outcomes overall and across multiple comparison groups. Another strength was the standardization and level of precision offered by the use of ICD-10 codes to determine the diagnoses. Also, we used a broad definition of SARS-CoV-2 infection (positive PCR result or clinical diagnosis) which helped to minimize the likelihood of missed patients, thereby producing a more generalizable sample of older adults than has been previously studied.
Policy implications
With more than 357 million people infected with SARS-CoV-2 worldwide, the number of survivors with sequelae after the acute infection will continue to grow. Our data showed that individuals aged ≥65 years had a higher risk of persistent and new clinical sequelae than younger populations.7 To best manage these patients, understanding the incidence and clinical course of these post-acute sequelae is important. Our results provide clinicians with a comprehensive understanding of the excess risk for the most important sequelae of SARS-CoV-2 infection in the post-acute phase, affecting adults aged ≥65 years who were admitted to hospital for covid-19 and those who did not require admission to hospital. Understanding the magnitude of risk for the most important clinical sequelae might enhance their diagnosis and the management of individuals with sequelae after acute SARS-CoV-2 infection. Also, our results can help providers and other key stakeholders anticipate the scale of future health complications and improve planning for the use of healthcare resources.
Conclusion
In a population of adults aged ≥65 years after acute infection with the SARS-CoV-2 virus, we found that 32% of individuals were diagnosed as having one or more persistent or new clinical sequelae that required medical attention during the post-acute phase of the illness, 11 percentage points higher than a comparator cohort. An increased risk for these sequelae was evident among those who were admitted to hospital for covid-19 disease, but the risk of several sequelae was also increased for men, for those of black race, and for those aged ≥75. These data can help to define the sequelae of SARS-CoV-2 infection in the post-acute phase in the older adult population, and to evaluate and manage these patients appropriately.
What is already known on this topic
Studies characterizing the incidence and severity of sequelae of SARS-CoV-2 infection after the acute infection in covid-19 survivors have started to emerge
Few studies, however, have described the excess risk of persistent and new sequelae caused by SARS-CoV-2 infection in adults aged ≥65 years in a large generalizable sample
What this study adds
Almost a third of adults (32 of every 100) aged ≥65 years infected with SARS-CoV-2 had a diagnosis of at least one sequela during the post-acute phase of the illness, 11 more than in a control group who did not have a diagnosis of covid-19
The increased risk during the post-acute phase was found for sequelae of the respiratory, cardiovascular, neurologic, hematologic, endocrine, and kidney systems, and for diagnoses related to mental health
Web extra.
Extra material supplied by authors
Web appendix: Supplementary tables and figures
Contributors: KC, SR, KH, MCD, KGJ, YG, ML, and SED played an active role in all aspects of the development of the research, including design, conduct, and interpretation of the data; preparation, review, and approval of the manuscript; and decision to submit the manuscript for publication. YG was involved in the study design and data curation, and Amy Okaya of Optum Laboratories provided critical review and editing of the manuscript. The corresponding author attests that all listed authors meet authorship criteria and that no others meeting the criteria have been omitted. KC as guarantor accepts full responsibility for the work and the conduct of the study, had access to the data, and controlled the decision to publish.
Funding: The study was funded by Optum Laboratories, the research and development arm of UnitedHealth Group, and the authors KC, SR, KH, SED, YG, MCD, and KGJ are full time employees of UnitedHealth Group. All authors, both internal and external, had full access to all of the data in the study and can take responsibility for the integrity of the data and the accuracy of the data analysis. The funders had no role in considering the study design or in the collection, analysis, interpretation of data, writing of the report, or decision to submit the article for publication.
Competing interests: All authors have completed the ICMJE uniform disclosure form at www.icmje.org/coi_disclosure.pdf and declare: support from Optum Laboratories for the submitted work; no financial relationships with any organizations that might have an interest in the submitted work in the previous three years; no other relationships or activities that could appear to have influenced the submitted work. KC declares consulting from Pfizer. ML declares honoraria/consulting from Merck, Sanofi-Pasteur, Bristol Myers-Squibb, and Antigen Discovery; research funding (institutional) from Pfizer; and unpaid scientific advisory services to Janssen, Astra-Zeneca, One Day Sooner, and Covaxx (United Biomedical).
The lead author and manuscript’s guarantor, KC, affirms that this manuscript is an honest, accurate, and transparent account of the study being reported; that no important aspects of the study have been omitted; and that any discrepancies from the study as planned (and, if relevant, registered) have been explained.
Dissemination to participants and related patient and public communities: The content of this paper will be summarized and made publicly available on the United In Research (unitedinresearch.com) platform sponsored by Optum Laboratories.
Provenance and peer review: Not commissioned; externally peer reviewed.
Ethics statements
Ethical approval
This research was determined to be exempt from human research regulations by the UnitedHealth Group Office of Human Research Affairs (Action ID: 2020-0076-01).
Data availability statement
The data are proprietary and are not available for public use but, under certain conditions, might be made available to editors and their approved auditors under a data use agreement to confirm the findings of this study.
References
- 1. Nasserie T, Hittle M, Goodman SN. Assessment of the frequency and variety of persistent symptoms among patients with COVID-19: A systematic review. JAMA Netw Open 2021;4:e2111417. 10.1001/jamanetworkopen.2021.11417 [DOI] [PMC free article] [PubMed] [Google Scholar]
- 2. Dennis A, Wamil M, Kapur S, et al. Multi-organ impairment in low-risk individuals with long COVID. bioRxiv. 2020. 10.1101/2020.10.14.20212555 [DOI]
- 3. Al-Aly Z, Xie Y, Bowe B. High-dimensional characterization of post-acute sequelae of COVID-19. Nature 2021;594:259-64. 10.1038/s41586-021-03553-9 [DOI] [PubMed] [Google Scholar]
- 4. Carfì A, Bernabei R, Landi F, Gemelli Against COVID-19 Post-Acute Care Study Group . Persistent symptoms in patients after acute COVID-19. JAMA 2020;324:603-5. 10.1001/jama.2020.12603 [DOI] [PMC free article] [PubMed] [Google Scholar]
- 5. Huang C, Huang L, Wang Y, et al. 6-month consequences of COVID-19 in patients discharged from hospital: a cohort study. Lancet 2021;397:220-32. 10.1016/S0140-6736(20)32656-8 [DOI] [PMC free article] [PubMed] [Google Scholar]
- 6. Morin L, Savale L, Pham T, et al. Writing Committee for the COMEBAC Study Group . Four-month clinical status of a cohort of patients after hospitalization for COVID-19. JAMA 2021;325:1525-34. 10.1001/jama.2021.3331 [DOI] [PMC free article] [PubMed] [Google Scholar]
- 7. Daugherty SE, Guo Y, Heath K, et al. Risk of clinical sequelae after the acute phase of SARS-CoV-2 infection: retrospective cohort study. BMJ 2021;373:n1098. 10.1136/bmj.n1098 [DOI] [PMC free article] [PubMed] [Google Scholar]
- 8. Lipsitch M, Tchetgen Tchetgen E, Cohen T. Negative controls: a tool for detecting confounding and bias in observational studies. Epidemiology 2010;21:383-8. 10.1097/EDE.0b013e3181d61eeb [DOI] [PMC free article] [PubMed] [Google Scholar]
- 9.Agency for Healthcare Research and Quality. Creation of New Race-Ethnicity Codes and SES Indicators for Medicare Beneficiaries - Chapter 3. 2012. https://archive.ahrq.gov/research/findings/final-reports/medicareindicators/medicareindicators3.html
- 10.US Census Bureau. 2013-2017 ACS 5-year Estimates. 2019. https://www.census.gov/programs-surveys/acs/technical-documentation/table-and-geography-changes/2017/5-year.html
- 11. Austin PC. An introduction to propensity score methods for reducing the effects of confounding in observational studies. Multivariate Behav Res 2011;46:399-424. 10.1080/00273171.2011.568786 [DOI] [PMC free article] [PubMed] [Google Scholar]
- 12. Le Cessie S, Van Houwelingen JC. Ridge estimators in logistic regression. J R Stat Soc Ser C Appl Stat 1992;41:191-201. [Google Scholar]
- 13. Schaefer RL, Roi LD, Wolfe RA. A ridge logistic estimator. Commun Stat Theory Methods 1984;13:99-113 10.1080/03610928408828664. [DOI] [Google Scholar]
- 14. Altman DG, Andersen PK. Calculating the number needed to treat for trials where the outcome is time to an event. BMJ 1999;319:1492-5. 10.1136/bmj.319.7223.1492 [DOI] [PMC free article] [PubMed] [Google Scholar]
- 15. Schoenfeld D. Partial residuals for the proportional hazards regression model. Biometrika 1982;69:239-41 10.1093/biomet/69.1.239. [DOI] [Google Scholar]
- 16. Austin PC. The performance of different propensity score methods for estimating marginal hazard ratios. Stat Med 2013;32:2837-49. 10.1002/sim.5705 [DOI] [PMC free article] [PubMed] [Google Scholar]
- 17.Drawing Survival Curves using “ggplot2” [R package survminer version 0.4.9]. 2021; https://cran.r-project.org/web/packages/survminer/index.html
- 18.Therneau TM. Survival Analysis [R package survival version 3.2-13]. 2021; https://CRAN.R-project.org/package=survival
- 19. Friedman J, Hastie T, Tibshirani R. Regularization paths for generalized linear models via coordinate descent. J Stat Softw 2010;33:1-22. 10.18637/jss.v033.i01 [DOI] [PMC free article] [PubMed] [Google Scholar]
- 20.Ripley BD. The R project in statistical computing. MSOR connect. 2001;1:23-5. https://www.r-project.org/
- 21. Cirulli E, Schiabor M, Riffle S, et al. Long-term COVID-19 symptoms in a large unselected population. medRxiv 2020:2020.10.07.20208702. https://www.medrxiv.org/content/10.1101/2020.10.07.20208702v3
- 22. Lund LC, Hallas J, Nielsen H, et al. Post-acute effects of SARS-CoV-2 infection in individuals not requiring hospital admission: a Danish population-based cohort study. Lancet Infect Dis 2021;21:1373-82. 10.1016/S1473-3099(21)00211-5 [DOI] [PMC free article] [PubMed] [Google Scholar]
- 23. Stavem K, Ghanima W, Olsen MK, Gilboe HM, Einvik G. Persistent symptoms 1.5-6 months after COVID-19 in non-hospitalised subjects: a population-based cohort study. Thorax 2021;76:405-7. 10.1136/thoraxjnl-2020-216377 [DOI] [PMC free article] [PubMed] [Google Scholar]
- 24. Quan H, Li B, Saunders LD, et al. IMECCHI Investigators . Assessing validity of ICD-9-CM and ICD-10 administrative data in recording clinical conditions in a unique dually coded database. Health Serv Res 2008;43:1424-41. 10.1111/j.1475-6773.2007.00822.x [DOI] [PMC free article] [PubMed] [Google Scholar]
- 25. Crabb BT, Lyons A, Bale M, et al. Comparison of international classification of diseases and related health problems, tenth revision codes with electronic medical records among patients with symptoms of coronavirus disease 2019. JAMA Netw Open 2020;3:e2017703. 10.1001/jamanetworkopen.2020.17703 [DOI] [PMC free article] [PubMed] [Google Scholar]
Associated Data
This section collects any data citations, data availability statements, or supplementary materials included in this article.
Supplementary Materials
Web appendix: Supplementary tables and figures
Data Availability Statement
The data are proprietary and are not available for public use but, under certain conditions, might be made available to editors and their approved auditors under a data use agreement to confirm the findings of this study.