Abstract
Understanding human organ formation is a scientific challenge with strong medical implications1,2. Three-dimensional stem cell cultures have provided insights into human cell differentiation3,4. However, current approaches use scaffold-free stem-cell aggregates, which develop unreproducible tissue shapes and variable cell-fate patterns. This limits their capacity to recapitulate organ formation5. Here, we present a chip-based culture system that enables self-organization of micropatterned stem cells into precise three-dimensional cell-fate patterns and organ shapes. We use this system to recreate neural tube folding from human stem cells in a dish. Upon neural induction6,7, neural ectoderm folds into a millimeter long neural tube covered with non-neural ectoderm. Folding occurs at 90% fidelity, and anatomically resembles the developing human neural tube. We find that neural and non-neural ectoderm are necessary and sufficient for folding morphogenesis. We identify two mechanisms drive folding: 1) apical contraction of neural ectoderm, and 2) basal adhesion mediated via extracellular matrix synthesis by non-neural ectoderm. Targeting these two mechanisms using drags leads to deficits similar to neural tube defects. Finally, we show that neural tissue width determines neural tube shape, suggesting morphology along the anterior posterior axis depends on neural ectoderm geometry in addition to molecular gradients8. Our approach provides a new path to study human organ morphogenesis in health and disease.
Brain and spinal cord development begins with folding of embryonic neural tissue into a tube (Fig. 1a). Neural tube defects (NTD) have severe consequences, and are among the most common birth defects, affecting 1:1000 pregnancies2. Animal model systems have successfully recapitulated the cellular and morphological aspects of NTD1,5. However, there are human-specific genetic aspects of NTD which are not captured in animal models2,9. To address limited accessibility in human embryos, 3D human stem cell cultures (organoids) capable of recapitulating aspects of human organ formation have been developed3. Organoids have advanced our understanding of cell fate decisions, yet yield unreproducible and anatomically incorrect tissue shapes and cell-fate patterns4 (Fig. 1b). Organs-on-chip systems have been used to cast stem cells into scalable, controlled and functional form10. Such approaches differ from morphogenesis: cells are forced to assemble according to a static template, depriving the system of self-organization, a hallmark of development. Similarly, 2D micropatterned approaches recapitulate pattern formation but do not demonstrate self-organized 3D morphogenesis of a neural tissue covered by surface ectoderm6,7,11–13. New approaches are required to study human organ morphogenesis.
Figure 1. A reproducible human stem-cell model of neural-tube morphogenesis.
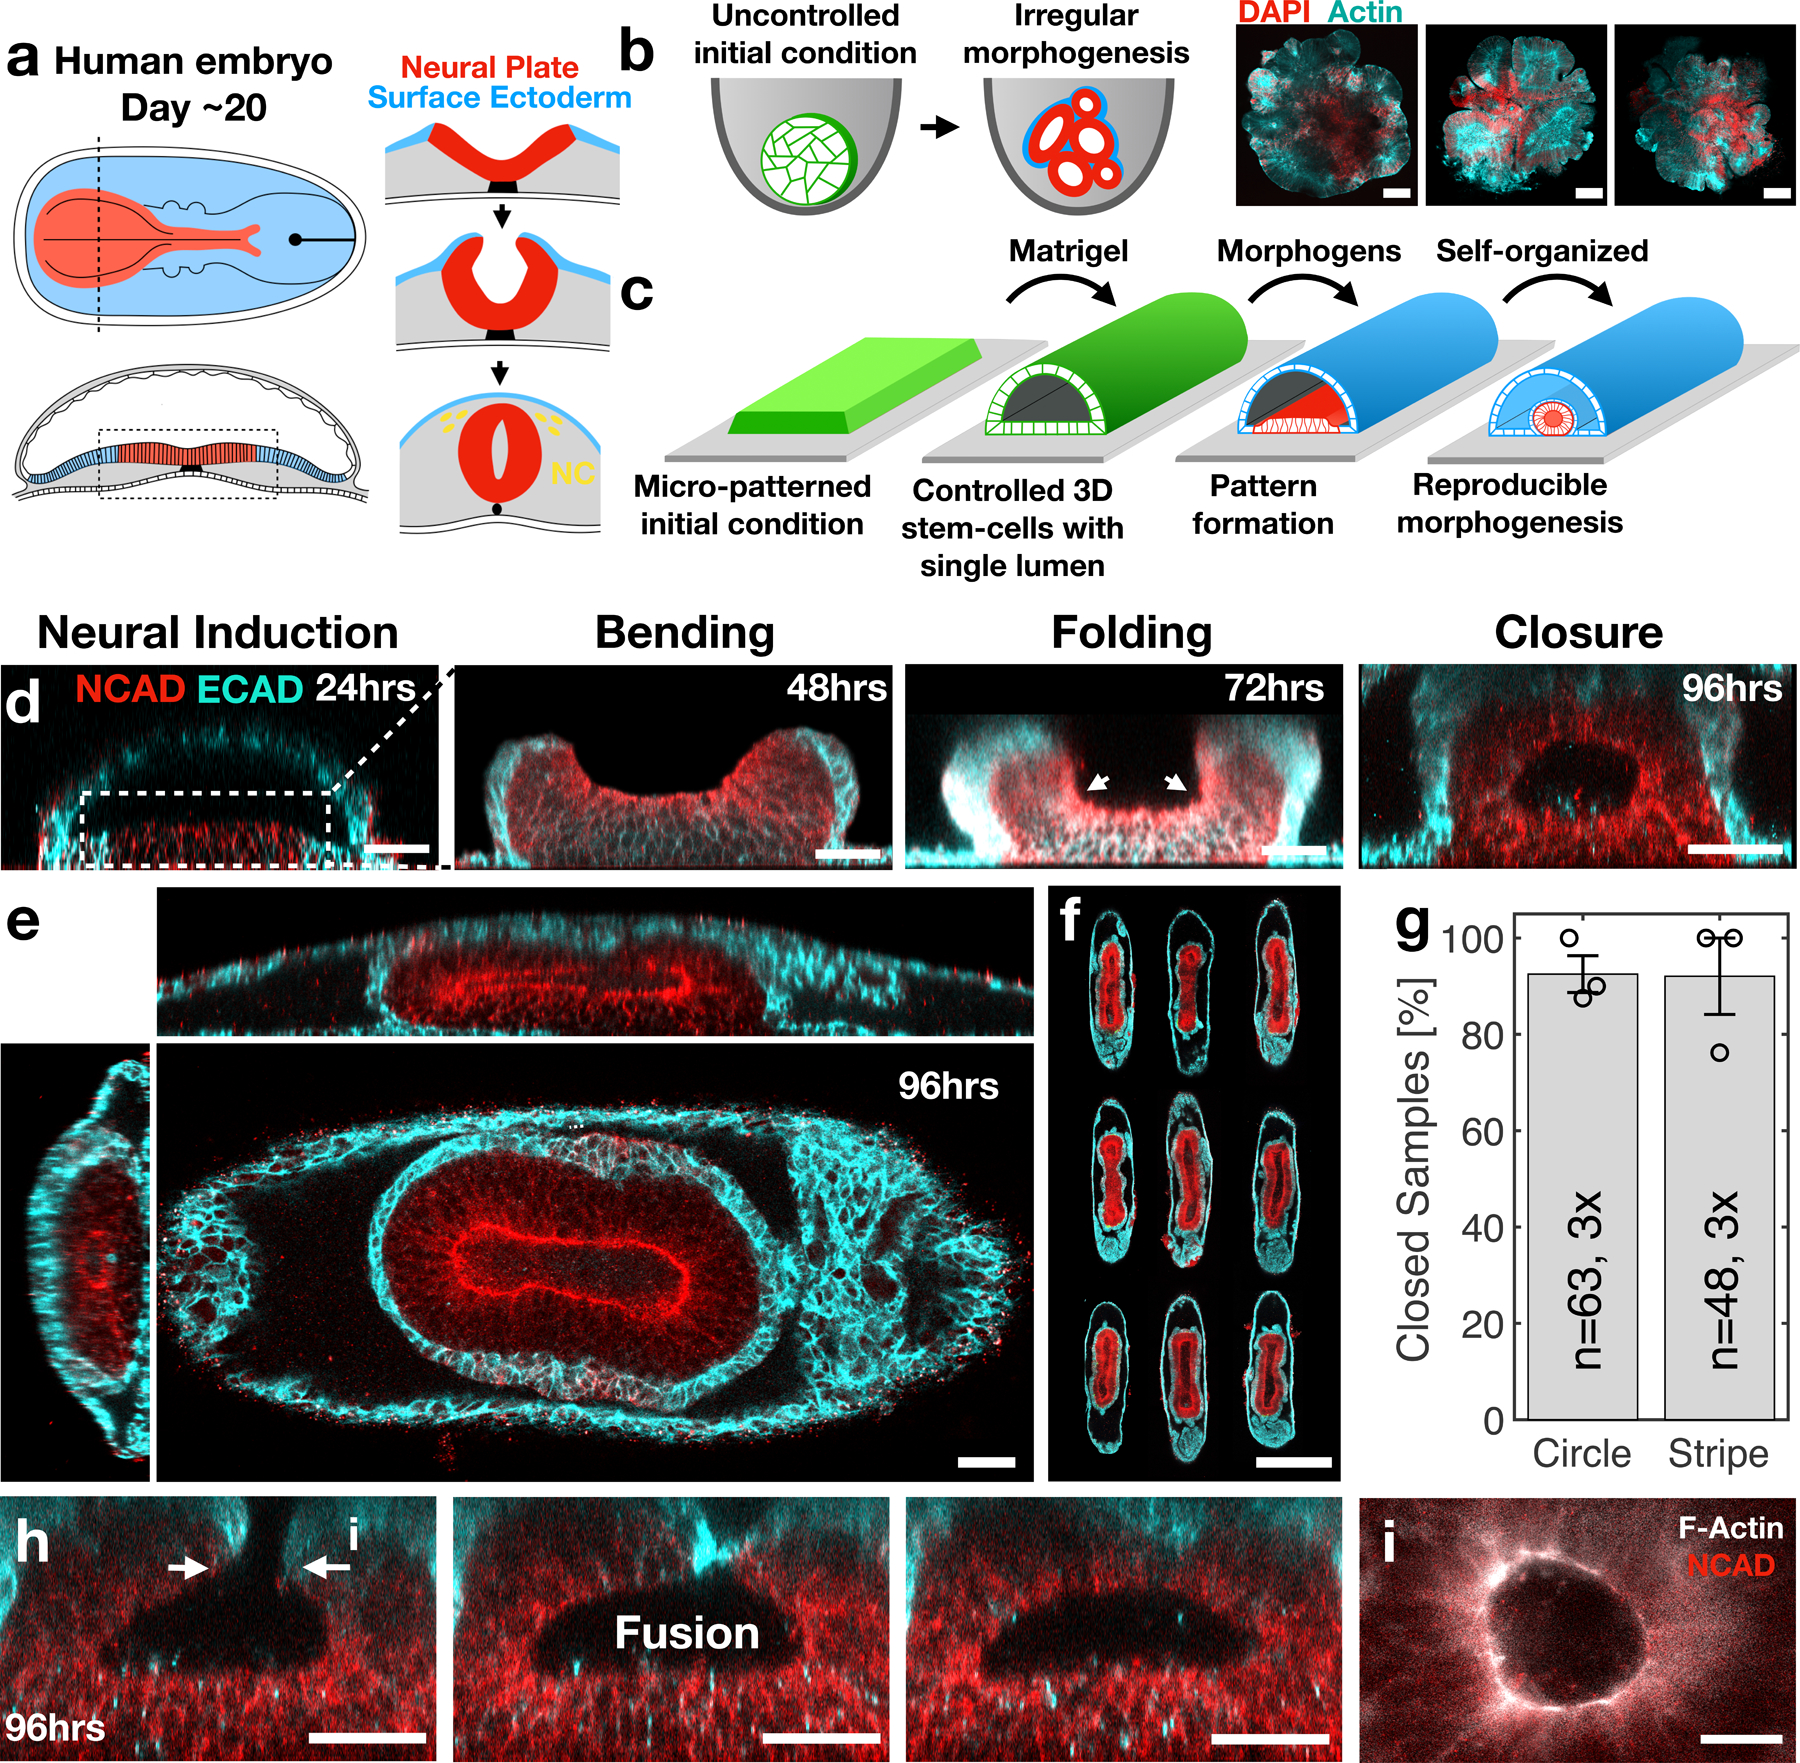
(a) Schematic of neural tube morphogenesis. (b) Conventional organoids result in irregular morphogenesis. Three genetically identical forebrain organoids are shown. (c) Experimental scheme showing controlled initial conditions lead to reproducible cell-fate pattern formation and morphogenesis. (d) Stages of neural folding in the stem cell system. Time indicated in hours following exposure to BMP4. (e) Fully closed neural tube covered with surface ectoderm. (f) Nine reproducible neural tube replicas are shown. (g) Success rate of neural closure in tubular (450μm x 1mm) and circular (450μm diameter) micropatterns is 92%. Data are presented as mean values +/- SD, N=63,48 samples, 3 biological repeats. (h) Serial sections in a fixed sample at 96hrs show that neural closure is mediated by fusion of the non-neural ectoderm layer. (i) An actin ring is observed during neural closure. Scale bars 500 μm (f), 50μm (b,d,e,h), 25μm (i).
Reproducible morphogenesis with stem cells
Here, we present an experimental system that faithfully models the self-organized dynamics of organ morphogenesis using human stem cells (Fig. 1c). Inspired by organogenesis in vivo, we set out to generate a geometrically controlled two-dimensional sheet of polarized stem-cells in contact with a lumen. This configuration provides a well-defined physical and biochemical starting point for cell-fate patterning in the 2D epithelium, that subsequently triggers 3D organ shape. By using surface micropatterning, we controlled the initial size, cell density, and shape of 2D stem-cell cultures (Extended Data Fig. 1). We then applied Matrigel to trigger a transition from the constrained 2D culture into a 3D pluripotent monolayer epithelium that wrapped around a single lumen. The 3D stem-cell culture shape and size were controlled by the micropattern geometry and formed at >95% success rate (Extended Data Fig. 1l). The 3D tissue maintained pluripotency, and thus could give rise to many cell types of the human body (Extended Data Fig. 1i,j). Moreover, the lumen was physically and chemically isolated from the environment, mirroring the in vivo situation (Extended Data Fig. 1e,f). We focused on driving neural tube formation by applying morphogens involved in early neurodevelopment. We further demonstrated that exposure to morphogens involved in the development of the human amnion, forebrain, and dorsoventral axis formation, recapitulate these morphogenetic events in our model system (Extended Data Fig. 2).
To drive neural tube morphogenesis, we exposed the 3D stem cell culture to a combination of morphogens thought to be involved in early neural development. We applied a neural induction media containing TGFβ inhibitor (SB-431542), followed by exposure to bone morphogenetic protein 4 (BMP4) (Extended Data Fig. 1a). In response, the system exhibited self-organized pattern formation and folding morphogenesis (Fig. 1d). This resulted in a tube-shaped neural tissue covered with surface ectoderm, recapitulating multiple anatomical features of the embryonic neural tube (Fig. 1e). Both folding and closure were highly reproducible, occurred with over 90% success rate (Figs. 1f,g, Extended Data Fig. 3b), and in multiple cell lines. Fold morphogenesis was not observed in 2D cultures, but required a 3D tissue surrounding a lumen as an initial condition (Extended Data Fig. 4a).
Recapitulating hallmarks of neurulation
In vitro morphogenesis followed the sequence of in vivo neurulation: neural plate formation, thickening, bending, folding, and closure (Fig. 1d). Folding and closure occurred over five days, similar to human embryos (Extended Data Fig. 3c,d). Exposure to BMP drove differentiation of the tissues from the edges into surface ectoderm, while the center differentiated into neural fate (Fig.1d, 24hrs). We next observed bending of the neural tissue (Fig. 1d, 48hrs). For 450μm wide micropattern, neural epithelia dimensions were 216±11μm width and 66±7μm thickness (Extended Data Fig. 4b,c), comparable to human neural plate in Carnegie stage 814. Live imaging revealed interkinetic nuclear motion in neural cells, typical of neuroepithelia (Supplementary Video 1). Next, the surface ectoderm curled over the neural tissue. Neural folding focused at two points, reminiscent of lateral hinge points (Fig. 1d, 72hrs, white arrows). The distance between hinge points decreased over time, suggesting that hinge points position was not fixed (Extended Data Fig. 4d). Neural closure initiated with constriction of the neural perimeter until a single actin-enriched zipper appears at 72–96hrs (Fig. 1i). Fusion of the tube was initiated by non-neural ectoderm, which made the first contact as during in vivo neural closure (Fig. 1h)15,16.
Immunostaining revealed that the stem cell system formed a bilayer of anterior neural tissue (NCAD, PAX6, OTX2, Fig. 2a,b,g,h), and non-neural surface ectoderm (ECAD, KTN8, TFAP2α, Fig. 2b,c,m,n). The neural tissue was pseudostratified and single cells extended between basal and apical surfaces (Figs. 2d, Extended Data Fig. 5f, Supplementary Video 2). The apical neural surface (Prominin-1, PKCζ, Figs. 2i) was enriched with Shroom3 and F-Actin (Extended Data Fig. 5c,d) and decorated with primary cilia (ARL13B, Figs. 2i, Extended Data Fig. 5e, Supplementary Video 3). Live imaging revealed that surface ectoderm cells undergo directional migration in parallel to the culture long axis (Supplementary Video 4). A population of neural crest cells occupied the interface between neural and non-neural ectoderm tissues (SOX10, PAX7, FOXD3, P75, Figs. 2c,j-l, Extended Data Fig. 5b, Supplementary Video 5). Live imaging revealed that neural crest cells are motile, proliferative, and organized in streams beginning at the neural top and widening towards the glass surface (Extended Data Fig. 6, Supplementary Videos 5-6). Intriguingly, the neural/non-neural interface was enriched in fibronectin and focal adhesions, whereas the glass interface contained low levels of fibronectin (Figs. 2e,o,p, Extended Data Fig. 7a-d). Differential ECM composition was also observed in vivo 17,18. No mesoderm marker was observed, suggesting that mesoderm active forces, ECM secretion, or signaling, are not required for neural folding and closure in vitro (Extended Data Fig. 9). Furthermore, no neural fold was observed in the absence of BMP or a neural induction, suggesting neural and non-neural ectoderm are both required and sufficient for neural tube formation (Extended Data Figs. 2c,9). This may be human cranial closure specific, as studies in animal models indicate that mesoderm is required for neural folding in both anterior and posterior regions5. Overall, these findings suggest that the in vitro model recapitulates key aspects of in vivo neurulation, in terms of morphology and timing, cell fate patterns, extracellular matrix, and cellular behaviors.
Figure 2. Formation of a neural and non-neural ectoderm bilayer.
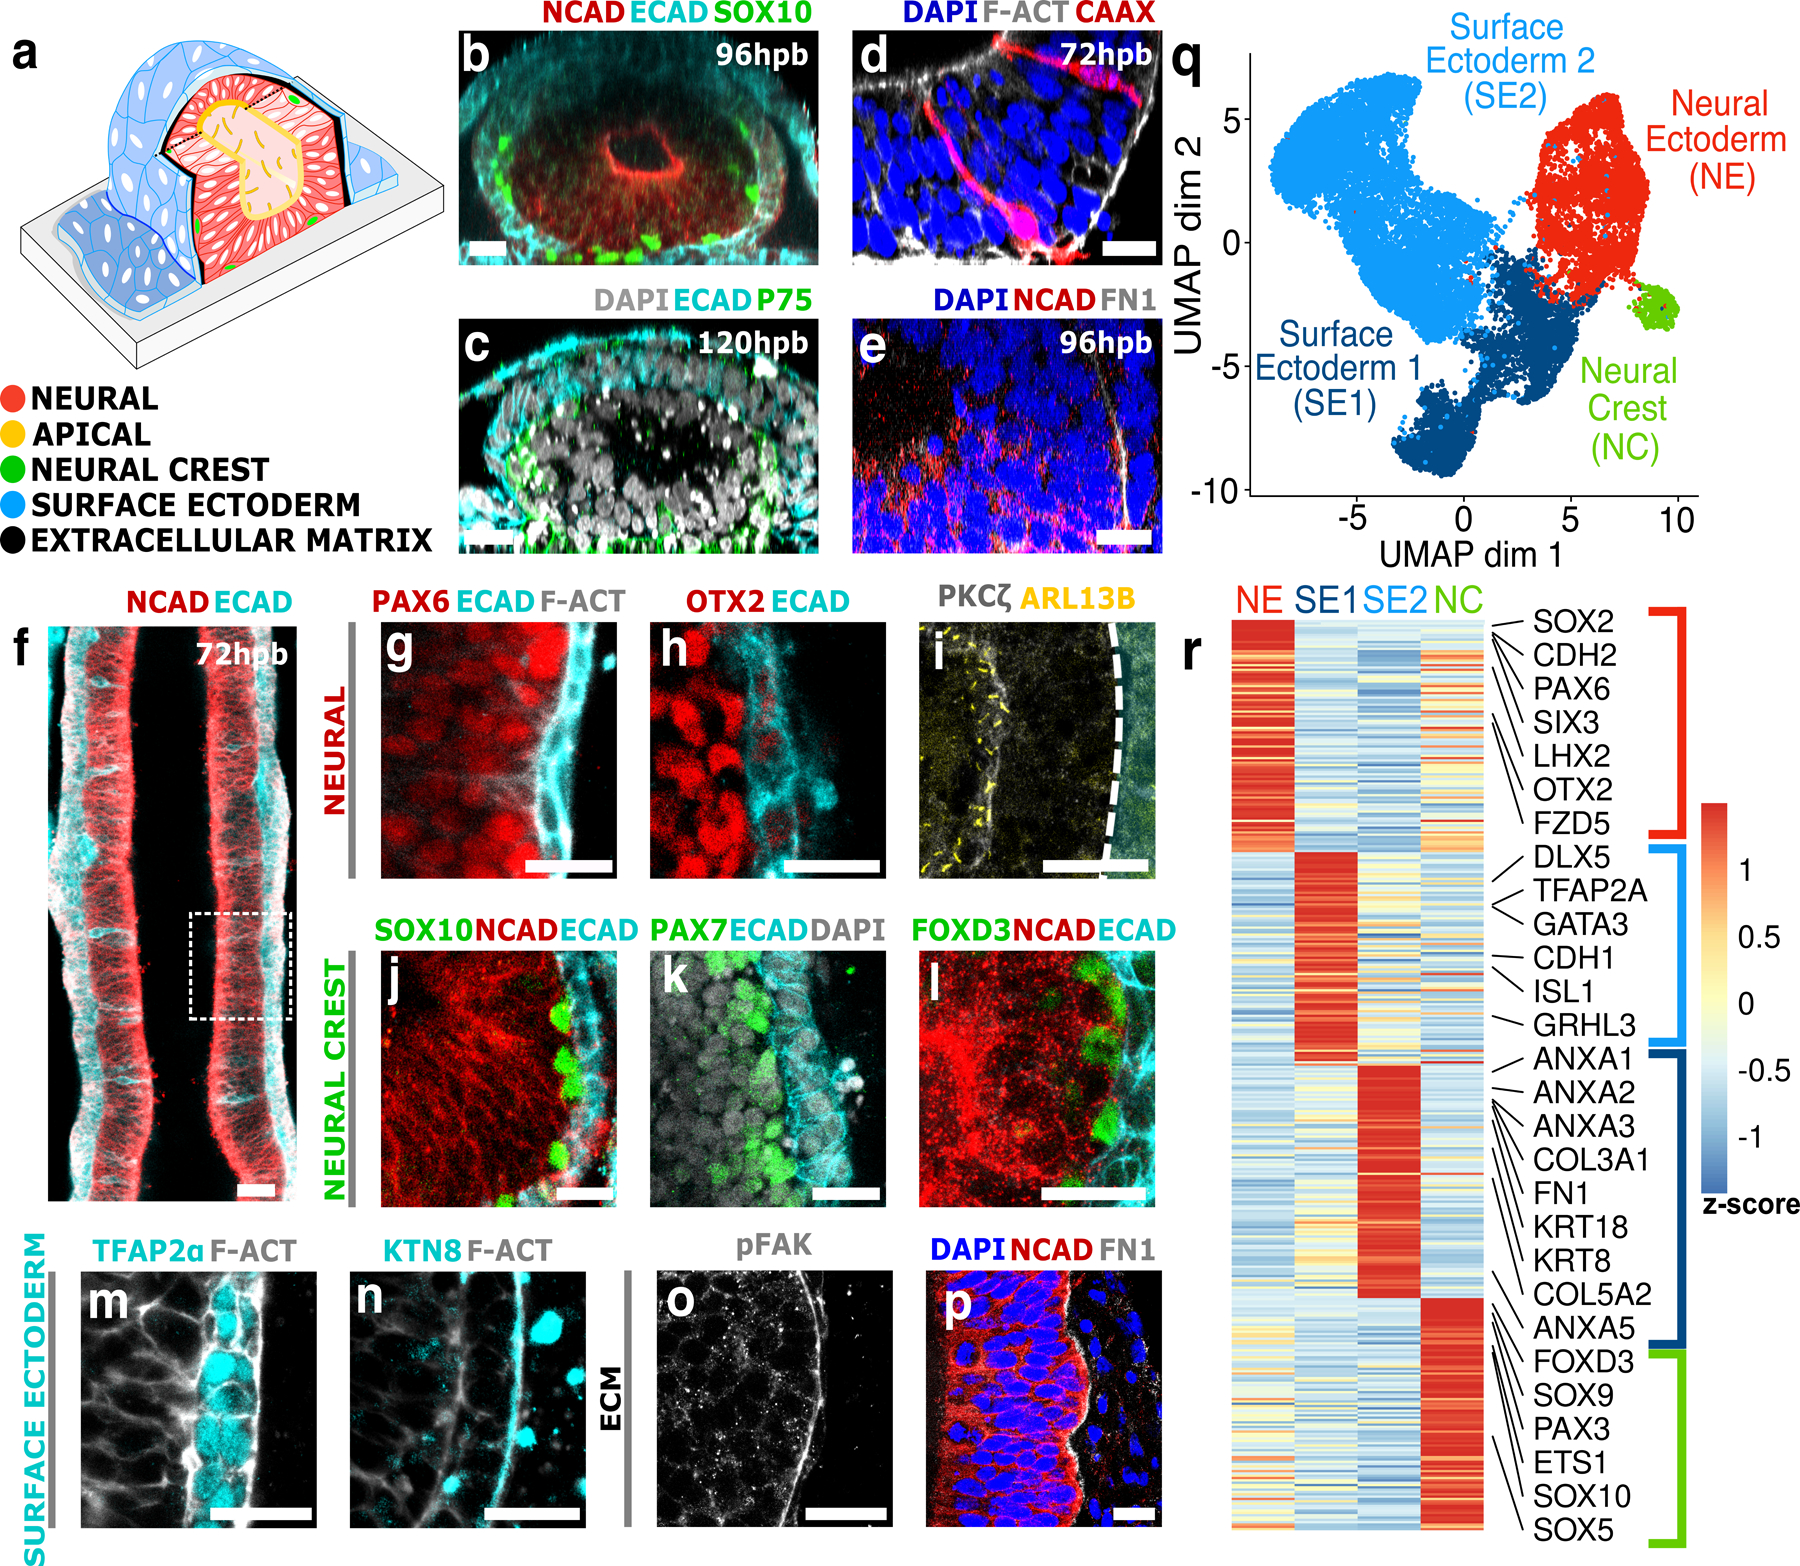
(a) Schematic of in vitro neural tube. Immunostained vertical (b-e) and horizontal (f-p) sections through the stem cell derived neural tube. Hours post BMP exposure (hpb) indicated. (d) Single cells were visualized by co-culture of CAAX:mCherry cells and non-fluorescent cells. (e) Fibronectin (FN1) is shown in relation to neural tissue (NCAD). (f) Horizontal section through ~1 millimeter elongated neural-tube culture on a rectangular micropattern of 500µm width. (g,h) Anterior neural markers PAX6 and OTX2 at 96hpb. (i) Apical marker PKCζ and primary cilia marker ARL13B at 120hpb. (j-l) Neural crest markers SOX10 (96hpb), PAX7 (72hpb), FOXD3 (96hpb). (m,n) Non-neural ectoderm markers TFAP2⍺ and Keratin8 (KTN8) at 96hpb. (o,p) Focal adhesion marker phosphorylated focal adhesion kinase (pFAK), and fibronectin (FN1) at 96hpb. (q) UMAP plot showing the main populations in single-cell RNA sequencing. (r) Top differentially expressed genes. Scale bars 25μm (b-e), 50μm (f), 10μm (g-p).
Single cell analysis of folding
Single-cell RNA sequencing (scRNAseq) was performed at 24,48,72, and 120hrs following BMP exposure. Unbiased clustering from all time points revealed four cell populations: neural ectoderm (NE), two adjacent groups of surface-ectoderm cells (SE1 and SE2), and neural crest (NC) (Figs. 2q,r, Extended Data Fig. 8, Supplementary Table 1). The neural cluster expressed forebrain markers (PAX6, OTX2, EMX2, SIX3, LHX2). Gene Ontology (GO) analysis revealed enrichment of brain and neural tube development associated genes (Supplementary Table 2). SE1 expressed transcription factors associated with non-neural ectoderm (CDH1, GRHL3, GATA3). SE2 expressed markers associated with epidermal differentiation (ANXA1–3, KRT8/18/19). Neural crest expressed genes associated with neural plate border (PAX3/7), neural crest specification (SOX10, FOXD3), migration (SNAI1/2, TWIST1, RXRG), diversification into mesenchyme (PRRX1/2, FOXC1), osteoblasts (MEF2C, DLX2), and ocular development (SOX4, PITX2, FOXE3). Plate border and specification genes were upregulated at early time points (24–48hrs), whereas migration and diversification genes were upregulated at late time points (72–120hr) (Extended Data Fig. 8b). G1 phase markers decreased over time, consistent with neural crest EMT (Extended Data Fig. 8c)19. Sub-clustering of the neural population is dominated by experimental time and cell-cycle phase (Extended Data Fig. 8e). Surface ectoderm cells sub-clusters do not cluster by cell-cycle or experimental time. This suggests that neural population undergoes synchronous differentiation, whereas non-neural cells carry more cellular variation within the cluster.
Our data revealed specific molecular and cellular processes associated with neural tube development (Extended Data Fig. 8f, Supplementary Table 2). Interestingly, surface ectoderm cells expressed genes involved in epithelial adhesion (CLDN4, EPCAM), cell motility (RHOC, CAV1, FLNA)20–22, ECM components (FN1, COL1/3/5), and ECM modulating enzymes (MMP2/9) (Extended Data Fig. 7e, Supplementary Tables 1,2). Expression of ECM components was significantly higher in the surface ectoderm than neural cells (Extended Data Fig. 7f). Together with enrichment of fibronectin (FN1) at the NE/SE bilayer (Figs. 2e,p), this suggests a novel role for the surface ectoderm in human neurulation: the surface ectoderm generates the ECM required for the formation of a neural/non-neural bilayer, and detachment of the neural plate from the underlying substrate. ECM generation is a species dependent process. The surface ectoderm expresses fibronectin in chick, but in mice it is mostly the mesoderm which expresses fibronectin18,23.
Towards modeling neural tube defects
To test suitability of the stem-cell system for modeling neural tube defects (NTDs), we applied three small molecule inhibitors (Fig. 3). First, we targeted Shroom3-Rho kinase (ROCK) signaling using a molecular inhibitor of ROCK (Y-27632). Shroom3 controls apical neural contractility, and is associated with human NTDs24,25. Second, we targeted the fibronectin matrix using the HSP-90 inhibitor novobiocin which increases fibronectin turnover. Fibronectin plays a crucial role in early neurulation, yet its role seems to be species dependent and largely unresolved5. Finally, we applied the NTD-associated drug valproic acid. ROCK inhibition, novobiocin, and valproic acid all resulted in severe folding defects with distinct morphological abnormalities (Fig. 3b-e).
Figure 3. Modeling neural tube defects.
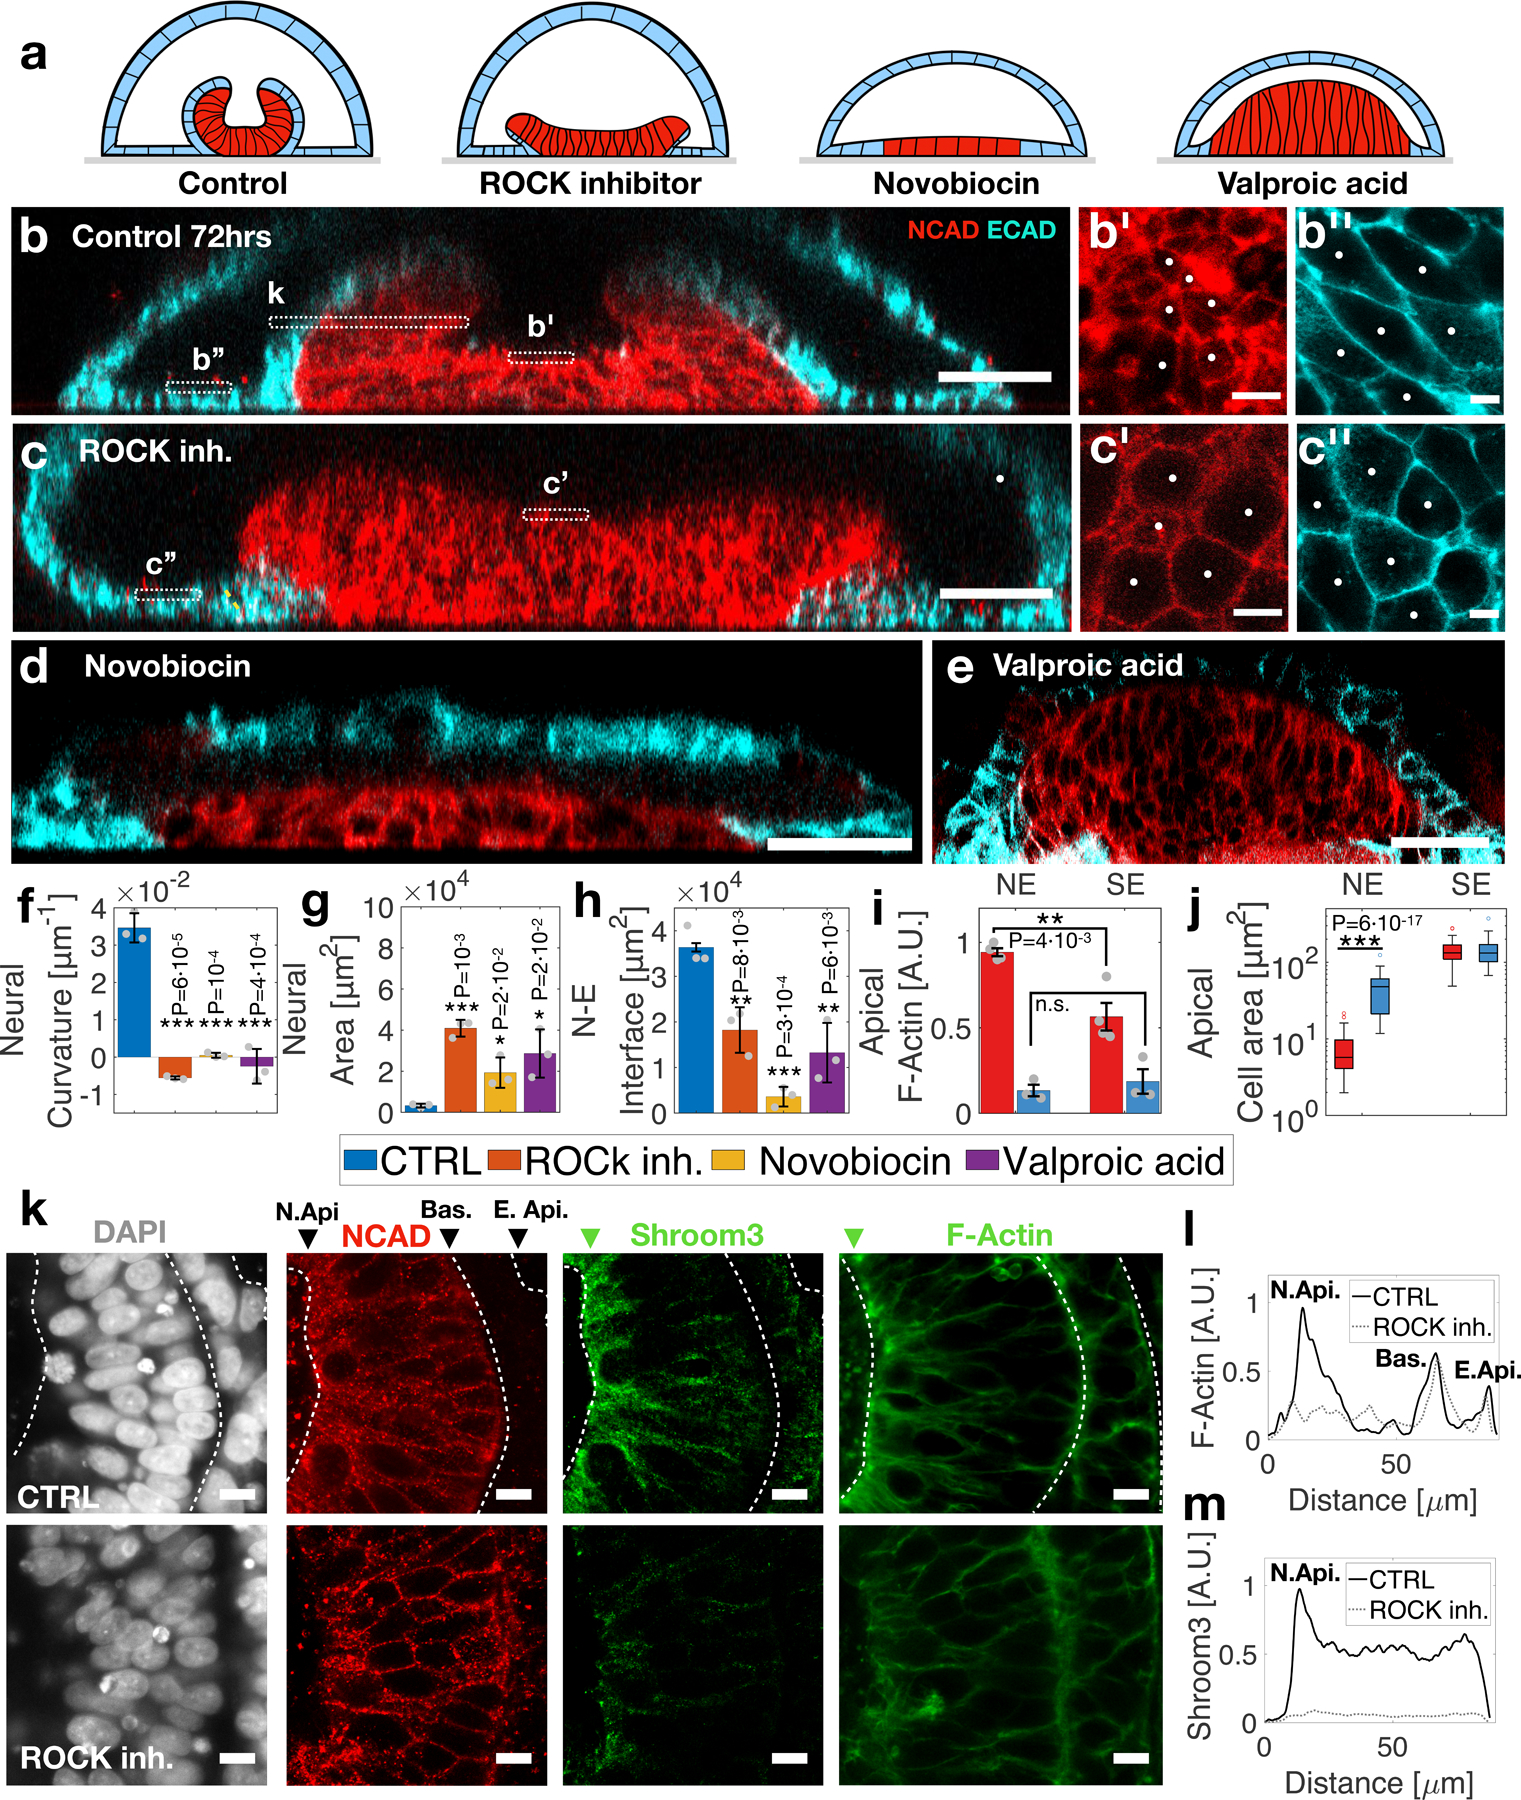
(a) Schematic of neural tube morphology in control sample and following exposure to small molecules. (b) Vertical sections show neural fold defect in control sample, (c) with ROCK inhibitor Y-27632, (d) fibronectin matrix inhibitor novobiocin, and (e) NTD-associated valproic acid. (b′) High magnification of neural (red) and (b′′) non-neural ectoderm (cyan) apical cell borders in control and (c′,c′′) ROCK inhibited samples. (f) Analysis of neural apical curvature, (g) total neural apical area, and (h) neural/non-neural (N-E) interface in control (CTRL) and treated samples. (i) Apical cell area and apical (j) F-actin quantified in CTRL and ROCK inhibited samples (k) Horizonal sections show Shroom3 and F-actin localization to neural apical surface (N. Api.). (l) F-Actin and (m) Shroom3 fluorescence intensity across the apical-basal axis in CTRL (solid black line) and ROCK inh. (grey dashed line) samples. Data are presented as mean values +/- SD, N=3 samples in (f-i), Total N=153 in (j). Two-sided t-test was applied. Scale bars 50µm (b-e), 5µm (b′, b′′, c′, c′′), 10µm (k).
ROCK inhibited samples exhibited a thick and bent neural tissue, which lacked neural hinges and was significantly less curved than control samples (Fig. 3f). The neural and total apical tissue area were expanded in ROCK inhibited samples, whereas non-neural cell areas did not change significantly (Fig. 3b’,b’’,c’,c’’,g, j). The interface between neural and non-neural tissue (N-E) was significantly reduced, but still present (Fig. 3h). Furthermore, F-actin and Shroom3 localization to the apical neural surface were disrupted in response to ROCK inhibition, indicating that our assay perturbed shroom signaling, disrupted apical actomyosin assembly, and prevented apical contraction of the neural tissue (Fig. 3i, k-m). This is consistent with ROCK inhibition during mouse neural tube closure in which ROCK inhibition reduces apical neural tension, and apical F-actin localization26. ROCK inhibition did not perturb cell motility (Extended Data Fig. 7j, Supplementary Videos 7,8).
Novobiocin resulted in a flat and thin neural plate, with an order of magnitude smaller N-E interface (Fig 3d,f-h), resembling a phenotype arrested at the neural induction stage (Fig. 1d). Immunostaining confirmed that novobiocin significantly reduced fibronectin levels (Extended Data Fig. 7g,h). This confirms that fibronectin matrix, synthesized by the non-neural ectoderm, is essential for bilayer formation and neural fold. Finally, valproic acid resulted in an inversely bent neural plate with negative curvature, larger neural area and smaller N-E interface (Fig. 3e-h). These results underscore the pathophysiological relevance of our model.
Neural plate size sets neural tube shape
Neural plate width varies along the anterior-posterior (AP) axis, from ~500μm in anterior regions to 100–200μm at the posterior end (Fig. 4a)14. Neural fold morphology also varies with AP axis, showing a broad fold with two lateral hinges at the forebrain, diamond shaped hindbrain fold with both medial and lateral hinges, and narrow fold with a single medial hinge at the spinal cord region27. It was suggested that morphology, and in particular hinge points, are controlled by local cell behaviors driven by morphogen gradients along the AP axis, including SHH8. However, to which extent the neural plate size affects shape remains unclear.
Figure 4. Neural plate size determines neural tube shape.
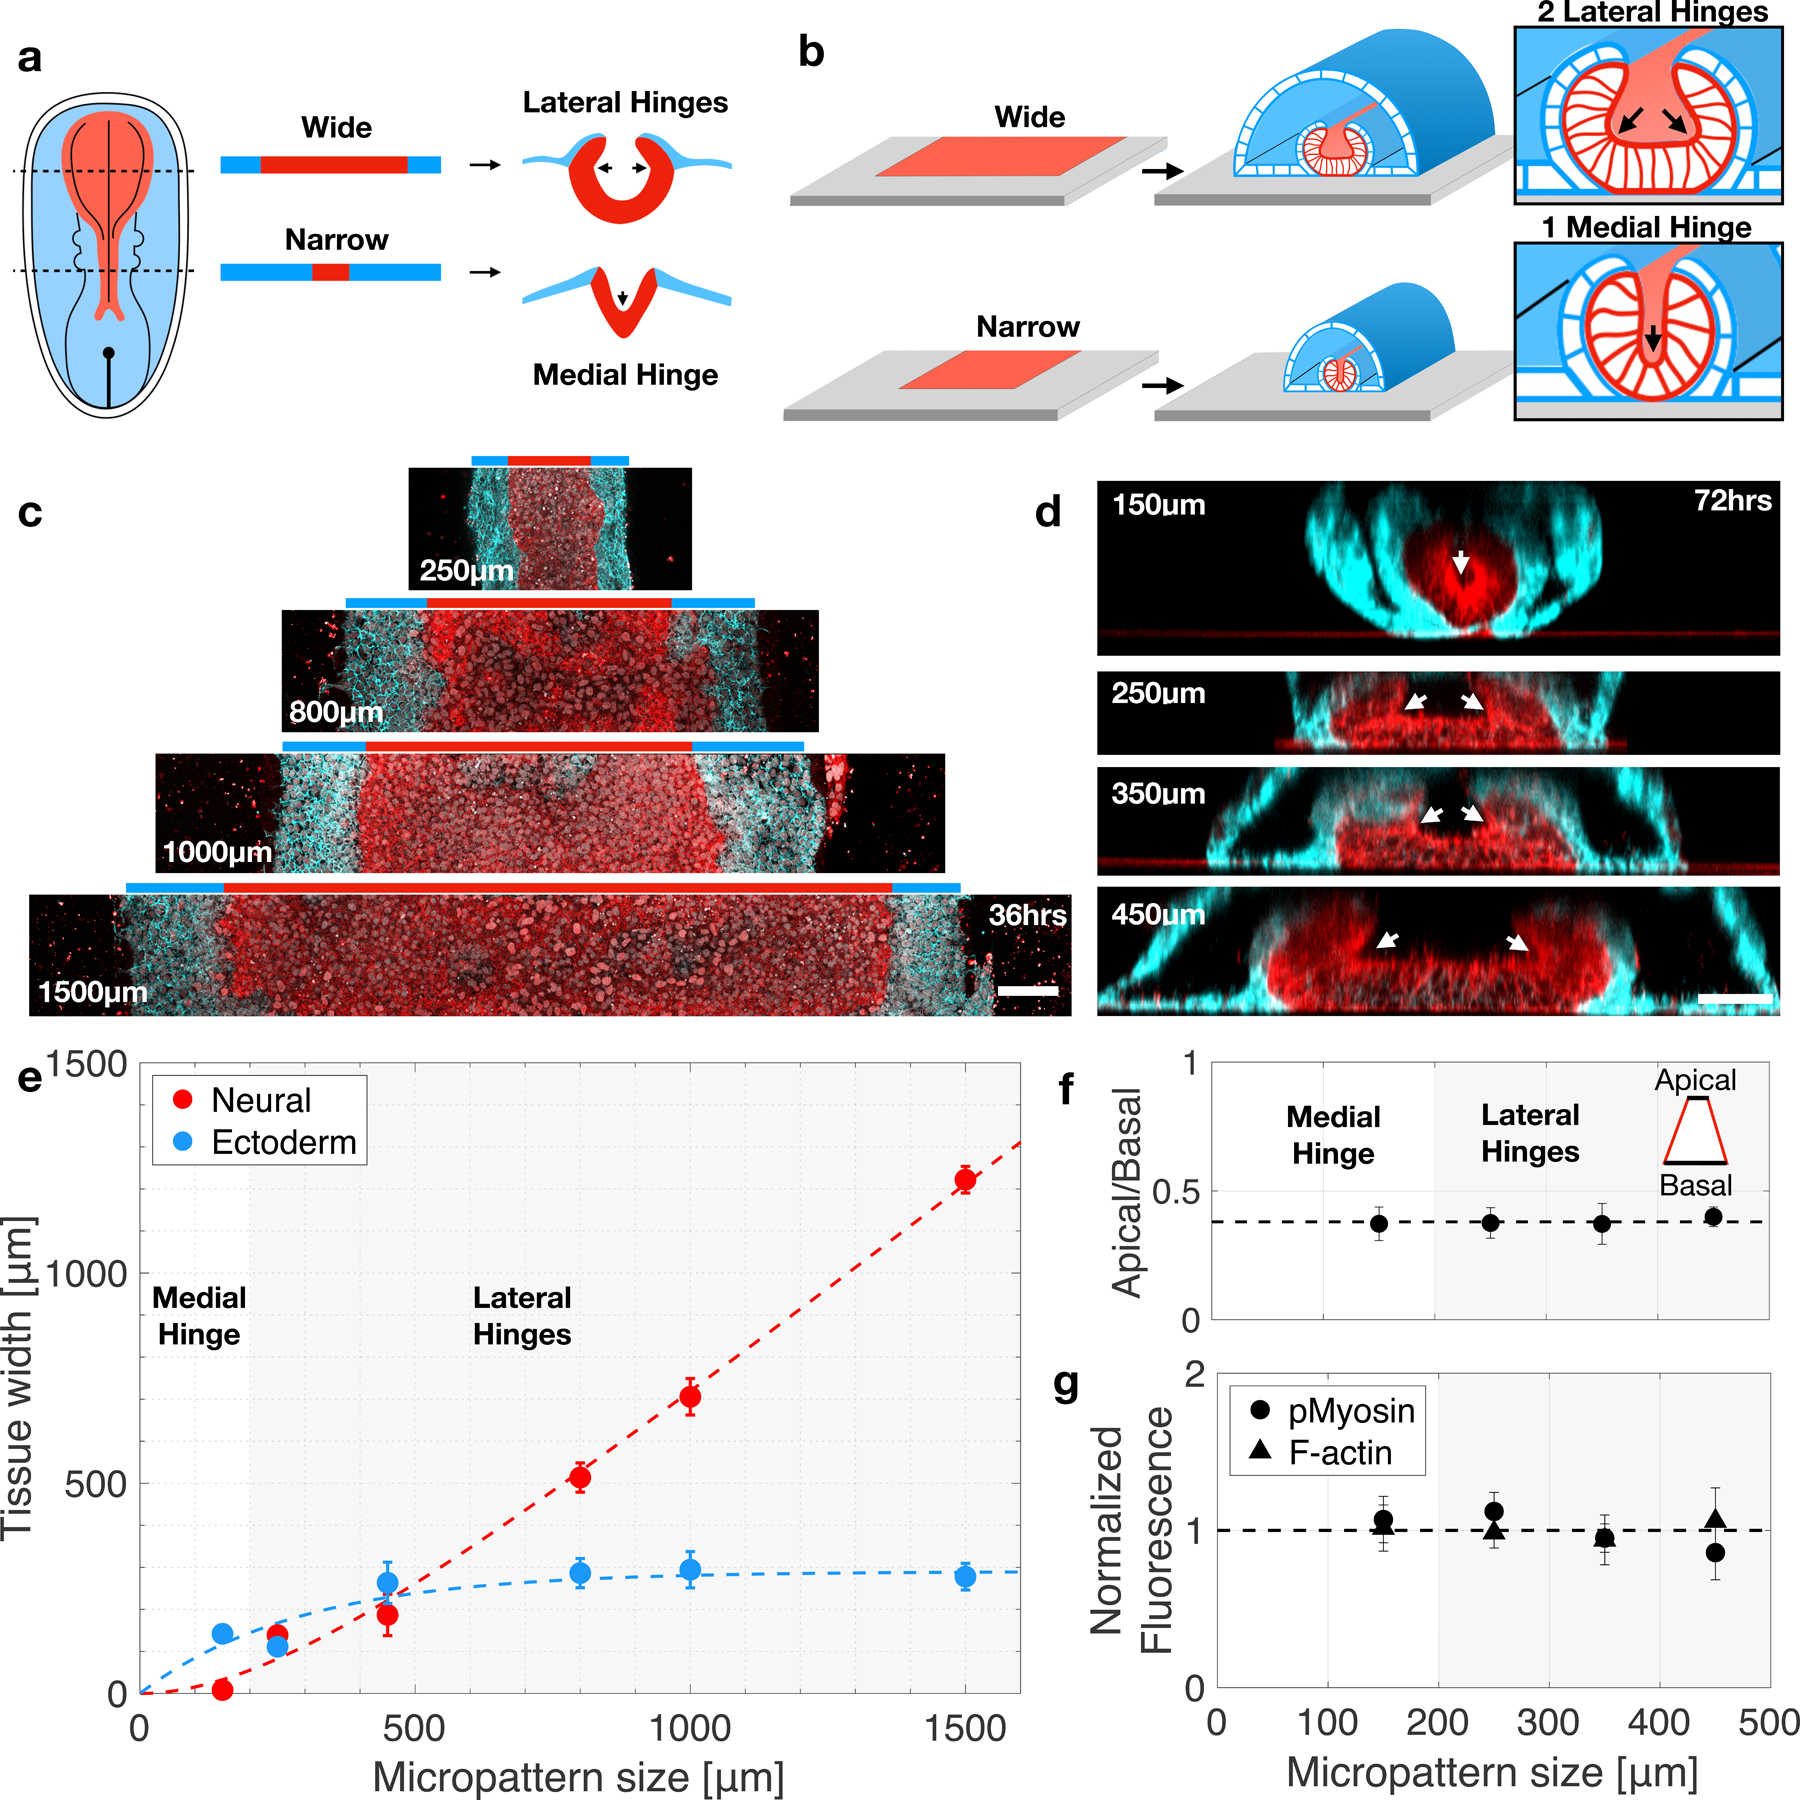
(a) Schematic of neural plate size and neural tube shape along the anterior posterior axis. (b) Experimental design - micropatterns are created at increasing widths to study the effect of tissue size on fold morphology. (c) Horizonal sections show neural (NCAD, red) and ectoderm (ECAD, cyan) pattern formation at varying micropattern widths. (d) Vertical sections reveal neural fold morphology changes as micropattern width increases. At 150µm a single medial hinge is observed, whereas larger micropatterns result in two lateral hinges. Total N=58 samples. (e) Neural and ectoderm tissue width as a function of micropattern size. White (grey) area correspond to regions in which a single (double) hinge are observed. N=10. (f) Ratio of apical to basal neural area as a function of micropattern size. N=3. (g) Normalized fluorescence intensity for F-actin and phosphorylated myosin light chain 2 as a function of micropattern size. N=12. Scale bars 100μm (c) and 50μm (d). Data are presented as mean values +/- SD (e-g).
We tested how tissue size controls shape by micropatterning rectangular geometries at increasing widths (Fig. 4b). We found neural plate width scaled linearly with micropattern size, whereas non-neural ectoderm was restricted to a fixed region of ~150μm at the boundary of the micropattern (Fig. 4c, e). Strikingly, neural fold morphology did not simply scale with size (Fig. 4d). Instead, narrow micropatterns (150μm width) exhibited a u-shaped neural fold with a single central hinge point. Wide micropatterns (>150μm width) carried two lateral hinges. Tubes of dimensions 450μm x 1mm, or smaller, proceeded to full closure, whereas bigger tubes of width 800μm exhibited hinge formation but did not complete closure in the studied time frame 120hrs post BMP. We detected no changes in neural apical contractility across different micropattern sizes, as measured by apical area, F-actin and phosphorylated myosin levels (Figs. 4f,g). We also observed no changes in cell fate as a function of tissue size. Overall, our data suggests that geometry plays a role in determining the final shape of the neural tube in addition to the effect of genetic factors, and surrounding tissues, which take place in embryonic development.
Discussion
We developed a reproducible model system for studying human neural tube morphogenesis in a dish, compatible with live imaging, genetic manipulations, and suitable for pharmaceutical screening. The anterior identity of the neural tissue indicated relevance for cranial neural closure. Two cellular activities drive folding. First, the non-neural ectoderm generates ECM, which is required for the formation of a N-E bilayer, detachment of the neural tissue from the glass and bending. Once a bilayer is formed, the neural ectoderm undergoes apical contraction, which is required for folding, hinge point formation, and closure. Our mechanical model accounting for apical contraction and cell adhesion explains the observed morphogenesis in all conditions (SI, Extended Data Fig. 10). Surprisingly, we discovered that neural tube shape, number and location of hinge points depend on neural plate size. This may contribute to morphological differences along the anterior-posterior axis. Future directions include establishment of a dorsal-ventral axis by coupling to microfluidic gradients. We already demonstrated the response to SHH agonists (Extended Data Fig. 2). Our approach of generating controllable 3D stem cell cultures with a single lumen is a versatile platform for studying human embryonic morphogenesis, paving way for synthetic morphogenesis.
Methods
Microfabrication and soft lithography.
Stamps for contact masking were prepared using standard soft-lithography techniques on a four-inch wafer. One layer of photoresist (SU-8 2075, Microchem) is spun onto a silicon wafer at a thickness of 110μm. Photoresist is exposed to ultraviolet light using a mask aligner (Suss MicroTec MA6) and unexposed photoresist is developed away to yield multiple arrays of posts. A Trimethylchlorosilane layer is vapor deposited on the developed wafer to prevent adhesion. A 10:1 ratio of PDMS and its curing agent (SYLGARD 184 A/B, Dow Corning) is poured onto the wafers and cured at 65C overnight. The PDMS layer is then peeled off the silicon mold and individual stamps are cut out using a razor blade for future use.
Glass micropatterning.
Sterile PDMS stamps and 35 mm diameter custom-made glass-bottomed culture dishes are plasma treated for 1 minute on high setting (PDC-32G, Harrick Plasma) to activate both surfaces. Stamps are pressed features-side to the glass surface and held in place. To passivate the glass surface in nonpatterned regions, 0.1mg/mL PLL-g-PEG solution (SuSoS AG, Switzerland) is added to the petri dish immediately after securing stamps to the glass surface and incubated for 30 minutes. Stamps are then carefully removed and stamped glass dishes are rinsed several times with PBS++. Laminin-521 (STEMCELL Tech.) is added at a dilution of 5μg/mL in PBS++ to incubate overnight at 4ºC. The following day, stamped glass dishes are rinsed with PBS++ to remove excess unbound laminin and used within 1–7 days.
hPSC lines and maintenance.
The work reported in this paper was approved by the Human Stem Cell Research Oversight Committee (hSCRO) at University of California Irvine, study # 2018–1072. In this work, we used early passages (<40) of hiPSC CTR2#17 (Figs. 1–4) 28. The cell line was previously karyotyped as normal28. In addition, we used hiPSC reporter line AICS-0023 developed by the Allen institute (Fig. S2,3,5,6), AICS-0054 (Fig. S18b,c), NIH-approved embryonic stem cell line RUES2 NIH approval number NIHhESC-09–0013 (Fig. S14), and its derived transgenic reporter line SOX10-GFP (Figs. S20) 6. hPSCs were cultured with mTESR1 media (STEMCELL Tech.) on hESC-qualified Matrigel (Corning) coated dishes. Media was exchanged on a daily basis, and cells were regularly checked for mycoplasma contamination.
Neural tube morphogenesis protocol.
A step-by-step protocol is available on Protocol Exchange29.
Day 1. Seeding onto micropatterns.
hPSCs are released from well-plate surfaces using non-enzymatic agitation following manufacturer’s instructions (ReleSR, STEMCELL Tech.). Cells are resuspended as a single-cell suspension at densities of 750K-1M cells/mL in mTeSR1 containing 10μM ROCK inhibitor Y27632 (Abcam). 200μL of cell suspension is then pipetted onto prepatterned dishes and allowed to settle for 15 minutes before adding 1mL of mTeSR1 and allowing cells to settle for 10 additional minutes. Excess media is aspirated, leaving enough liquid to cover patterns and replaced with fresh 2mL of mTeSR until the following day.
Day 2. Matrigel addition.
mTESR1 media is exchanged with a neural induction media containing Matrigel (4%, v/v). Neural induction media is supplemented with 5μM of TGFβ-inhibitor SB-431542 (Supplementary Table 3).
Day 3–4. Lumen Formation.
Dishes are left unperturbed at day 3 to allow transition into 3D stem-cell tissue containing a single lumen.
Day 5–9. Exposure to Morphogens.
To drive ectoderm patterning we apply bone morphogenetic protein 4 (BMP4)6,7,30,31. Neural induction media is supplemented with 5ng/mL BMP4 in addition to 5μM of SB-431542. Media is exchanged daily. Cell fates are observed on day 6 and folding is observed during days 7–9.
Protocol Rationale.
Our protocol was optimized based on experimental observations. First, Matrigel concentration was scanned (Fig. S4). Four percent Matrigel was a minimal concentration that yielded robust lumen formation. Second, the period of neural induction, prior to BMP, was scanned (Fig. S27). Three days of neural induction was the minimal period which yielded neural and non-neural ectoderm, with no mesoderm. Finally, low BMP levels were chosen to prevent EMT from the micropattern (Fig. S28).
Whole-mount immunostaining.
All samples were fixed, immunostained and imaged as whole mounts in the culture dish. Samples are fixed in 4% PFA, 1hr at room temperature (RT), washed three times for 15 min in PBS, and permeabilized in 1.5% Triton -PBS over-night (o/n) at 4C. The following day, samples are washed in 0.3% Triton, and blocked for 2hrs RT (10% NGS, 1% BSA, 0.3% Triton-X in PBS). Primary antibodies are used at 1:100–1:200 in blocking solution o/n at 4°C. Next, samples are washed in PBT (0.1% Tween in PBS), and incubated with secondary antibodies 1:500–1:1000 in PBT o/n at 4°C. DAPI and phalloidin are also added at this stage. Samples are washed in PBS for 1hr, and imaged. Finally, samples are cleared using 30min incubation in RapiClear 1.47 (SUNJIN LAB). Antibodies are listed in Supplementary Table 4.
Drug Experiments.
All drugs were reconstituted in water and added to the culture at day 5, together with BMP, and maintained for 72hrs until the end of the experiment at day 8. Media was changed daily. Control experiments were carried under identical conditions, adding water instead of the drug. ROCK inhibition is achieved using the small molecule Y-27632 and applied at a concentration of 10μM (1:1000 dilution). We targeted the fibronectin matrix using the HSP-90 inhibitor novobiocin which increases fibronectin turnover the HSP32. Novobiocin was applied at 100μM. Valproic acid was applied at 800μM33,34.
Imaging.
Fluorescence imaging of whole-mount immunostained samples and was carried out using Leica SP8 confocal microscope. Imaging was carried out directly on glass-bottom dishes in which Lumenoids were cultured. Live-imaging was carried out in a custom-made incubator for temperature and CO2 control.
Image analysis.
Image analysis was performed using the following software Fiji 2.1.0, Matlab 2019a, Ilastik 1.3.3, MeshLab 2021.07, ImSAnE (https://github.com/idse/imsane).
Neural tube closure analysis.
Neural tube closure period was measured as the period between exposure to BMP and the formation of a closed neural tube (Fig. 1h). Detailed kinetics of neural closure are shown in Extended Figure 3C. This was compared to data from neural closure period in the chick35, mouse36, and humans14.
F-actin analysis.
F-actin levels are detected using Phalloidin-488 (Thermofisher A12379). Phalloidin was added and washed with secondary antibodies. Fluorescence intensities in control and ROCK inhibited samples were measured and quantified.
Tissue width analysis.
The ectoderm and neural widths are measured at early time point (36hrs) before folding onset. At this time point a confocal section near the glass surface is taken (Fig. 5c). The distance between the NCAD/ECAD boundary and the tissue boundary are measured and defined as the ectoderm width. The distance between the two NCAD/ECAD boundaries are measured and defined as the neural width.
Clonal analysis.
We clonally label cells by mixing a CAAX-RFP reporter line with non-fluorescent background line during seeding of the micropatterns. The reporter line is added at low density, such that the majority of samples did not contain RFP+ cells, and a small fraction of colonies contained 1–2 cells per sample. We fix the samples at 72hrs and image.
Droplet-based single-cell RNA sequencing
Samples were cultured according to neural tube morphogenesis protocol. Cells were dissociated into a single cell suspension using TrypLE reagent (Gibco), and gentle pipetting, according to 10X guidelines. Cells were washed 3 times in PBS/0.01% BSA, filtered using 40μm Flowmi Tip strainer (Sigma), counted and checked for high viability (>95%). To generate single-cell RNA libraries, the Chromium Single Cell Kit v3.1 (10x Genomics) was used according to the manufacturer’s instructions. Libraries were sequenced on an Illumina NovaSeq6000 Instrument. To obtain gene expression counts matrices, raw reads were processed using the Cell Ranger counts pipeline (version 3.1.0), followed by the Cell Ranger pipeline (version 3.1.0) with default settings.
Statistical Analysis
Statistical significance was determined using paired-sample t-test using MATLAB. At list three replicates were used to determine significance.
Single-cell RNA data analysis
Single-cell RNA data analysis was performed using Seurat 3.037,38 in R version 3.6.3. Samples were filtered as individual Seurat objects. Low-quality cells with > 15% mitochondrially encoded genes, and cells with < mean-1.2 SD expressed genes were removed. Putative doublets were filtered out using DoubletFinder39, assuming a 3.9% doublet formation rate. After doublet removal, the four samples were merged into one Seurat object consisting of a total of 19,597 cells. This final dataset had a mean of 3,717 detected genes per cell, a mean transcript count of 14,897 and a mean percentage of mitochondrially encoded genes of 5.6%. Sctransform normalization40 was performed, regressing out percentage of mitochondrial genes and number of genes detected. Clustering and UMAP dimensionality reduction were performed on the transformed data using default parameters and a resolution of 0.05. To identify marker genes, data were first normalized and scaled with default parameters. Then, the wilcox rank sum test was applied to identify cluster markers by running the FindMarkers function on the normalized and scaled data with the following parameters: logfc.threshold = 0.25, min.pct = 0.1, only.pos = TRUE.
Data were subset to the three major lineages (neural ectoderm: cluster NE, 4767 cells; surface ectoderm: clusters SE-1 and SE-2 4347 and 10017 cells, respectively; neural crest: cluster NC, 448 cells), followed by computing marker genes for each timepoint (24h, 48h, 72h, 120h) within each lineage using the FindMarkers function as described above. Gene ontology enrichment analyses were performed using Metascape41, available at https://metascape.org, with the following customizations: A background gene list of all genes present in the dataset was provided, and the GO Biological Processes database was used for testing gene enrichment. Metascape performs hierarchical clustering of the enriched terms, showing the most significant term within a cluster as the representative term in the enrichment results. The neural ectoderm and surface ectoderm lineages were subclustered as described above, with resolution set to 0.2 and 0.4 for neural ectoderm and surface ectoderm, respectively. Cell cycle phases were assigned using Seurat’s CellCycleScoring function and lists of G2/M and S phase markers from Tirosh et al. (2016)42.
Simulation
A vertex model simulation for neural tube morphogenesis was developed in Matlab 2019a.
The simulation is described in detail in the Supplementary Note.
Statistics and Reproducibility
All experiments were carried in at least three biological replicates, except the single-cell sequencing was performed in one experiment including multiple time points. Sample sizes are indicated within figure captions. The in vitro neural tube morphogenesis protocol was repeated in about 100 experiments, including three different cell lines (one hiPSC and two hESC). The folding and closure dynamics, size dependence, response to pharmaceutical were all highly conserved and occurred at the high success rates.
Extended Data
Extended Figure 1. hPSC derived Neural tube protocol.
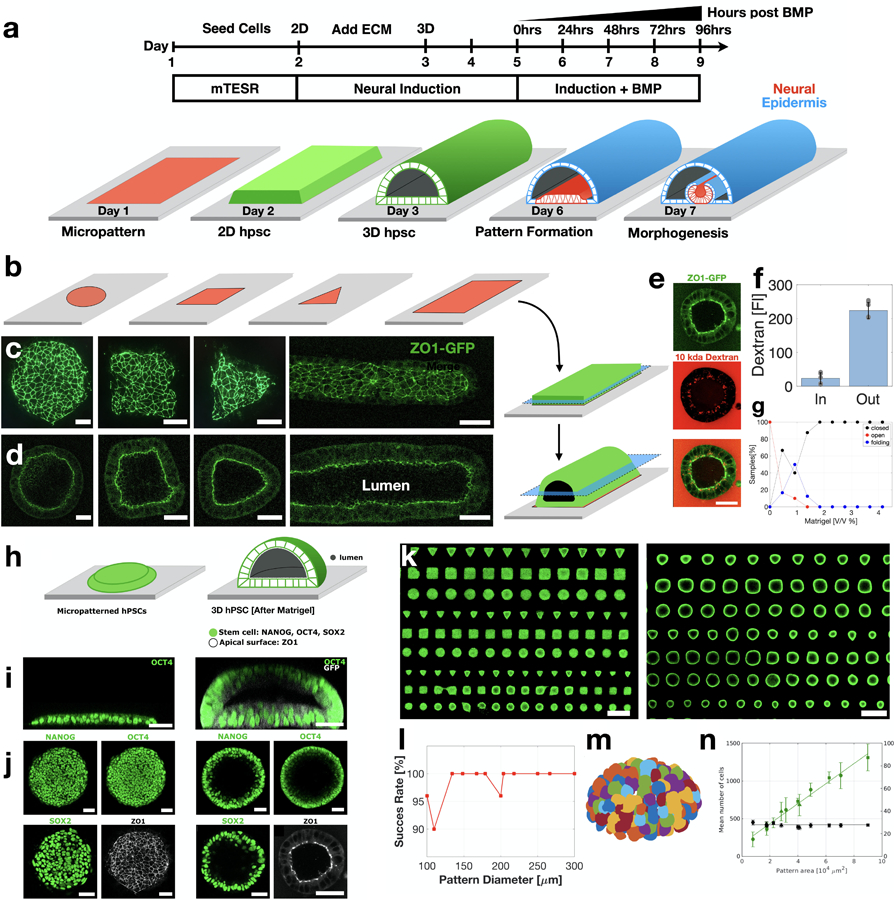
(a) Scheme showing stem-cell derived neural tube protocol. (b) Scheme showing shape-controlled ECM pattern deposited on glass surface. (c) Seeding of hPSCs onto micropatterns results in two-dimensional cultures which are restricted to the micropattern geometry. ZO1-GFP indicates tight epithelia. (d) Adding 4% Matrigel to the media results in three-dimensional stem-cell cultures containing a single large lumen. (e) The hPSC lumen forms a tight biochemical niche. hPSC reporter line endogenously expressed tight junction protein ZO1 tagged with GFP (AICS-0023) is used. The 3D culture is exposed to 10kda dextran tagged with Texas Red fluorophore. Horizontal sections show that tight junctions are localized to the inner surface facing the lumen (green). Dextran is visible outside the tissue, but the lumen is devoid of dextran (red). (f) The fluorescence of dextran is quantified inside and outside the lumen, showing a 10–60 fold decrease in the lumen dextran concentration. Data are presented as mean values +/- SD. (N=9). (g) Plot of the relative fraction of closed lumens as a function of Matrigel concentration, after 24hrs incubation. Data are presented as mean values +/- SD. Total N=88 samples. (h) Scheme showing micropatterned hPSC before and after exposure to Matrigel. (i) Vertical and (j) horizontal sections of pluripotent markers NANOG, OCT4 and SOX2, as well as epithelial marker ZO1. Images taken before and after lumen formation. (k) Horizontal section of an array of 2D (left) and 3D (right) stem cell cultures immunostained with OCT4. (l) Lumen formation success rate as a function of micropattern size. Total N =510 samples. (m) Segmentation of single nuclei is used to count the number of cells in each sample. Each nucleus is labeled with a different color. (n) Total cell number in each sample (green curve) scales linearly with pattern area while cell density (black curve) remains constant. Data are presented as mean values +/- SD. Total N =194 samples. Scale bars are 50μm (d,e,i,j), and 500μm (k).
Extended Figure 2. In vitro morphogenesis Road Map.
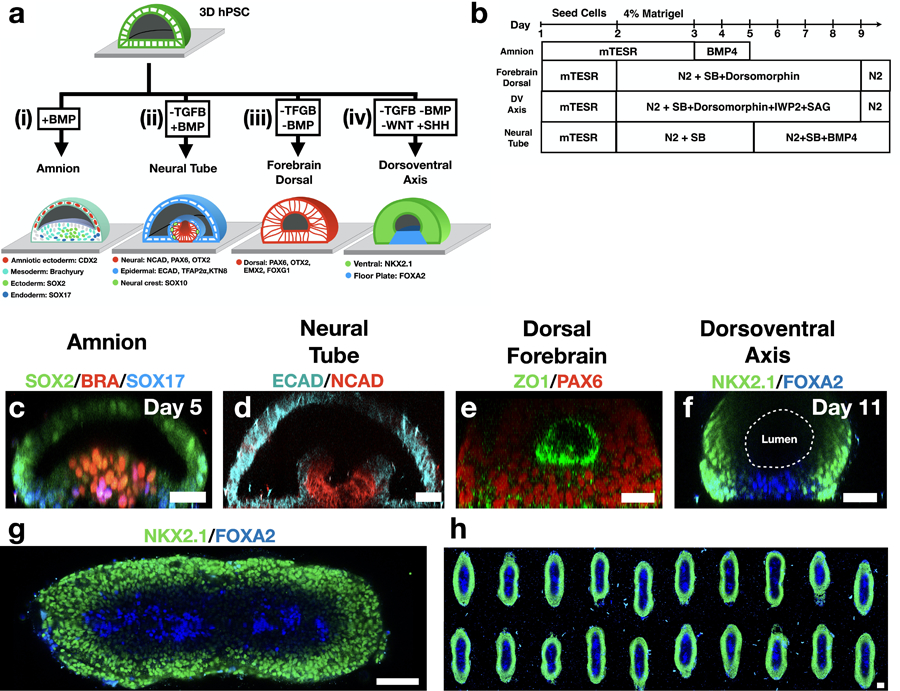
(a) Schematic representation of in vitro morphogenesis in four differentiation protocols. Observed cell markers are indicated. (i) Exposure to BMP, without neural induction, results in an amnion-like tissue containing cells from three germ layers without formation of a neural fold. (ii) Neural tube morphogenesis is observed when neural induction is followed by exposure to BMP4. (iii) Homogenous expression of forebrain markers is observed under exposure to neural induction without BMP. (iv) Dorsoventral axis formation is observed in response to SHH activation (SAG) and WNT downregulation (IWP2). (b) Experimental timeline for the four protocols. Neural induction media includes N2 supplement and TGFβ inhibitor SB-431542 (SB). (c-f) Vertical sections of immunostained samples from the four differentiation protocols. (g) Horizontal section close to the glass surface and (h) an array of 20 samples. FOXA2+ cells always appear at the midline. Scale bar is 50μm (c,f-h), 50μm (d,e).
Extended Figure 3. Folding morphogenesis is reproducible.
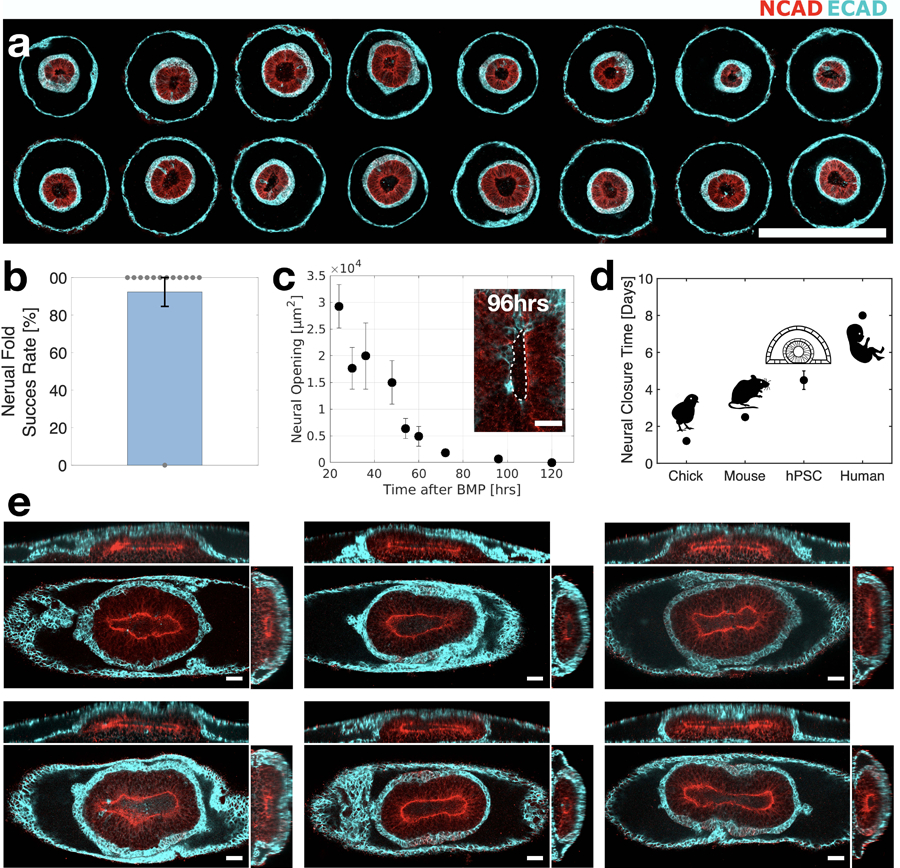
(a) Horizontal sections of 16 circular cultures from a single array exhibit stereotypic fate-patterning and morphology. (b) Bar plot showing success rate of neural tissue folding morphogenesis, in 13 experiments, with total N=100 samples. Data are presented as mean values +/- SD. (c) Neural opening area as a function of time. Data are presented as mean values +/- SD. N=3. (d) Neural closure period in the stem-cell system compared to chick, mouse, and human. (e) Images of six samples at 96hrs showing closed neural tissue (red, N-Cadherin) covered by non-neural ectoderm (cyan, E-cadherin). Samples were generated on stripe shaped micropatterns. Scale bar is 500μm (a), 50μm in (c,e).
Extended Figure 4. Folding morphogenesis is not observed in 2D micropatterned cultures.
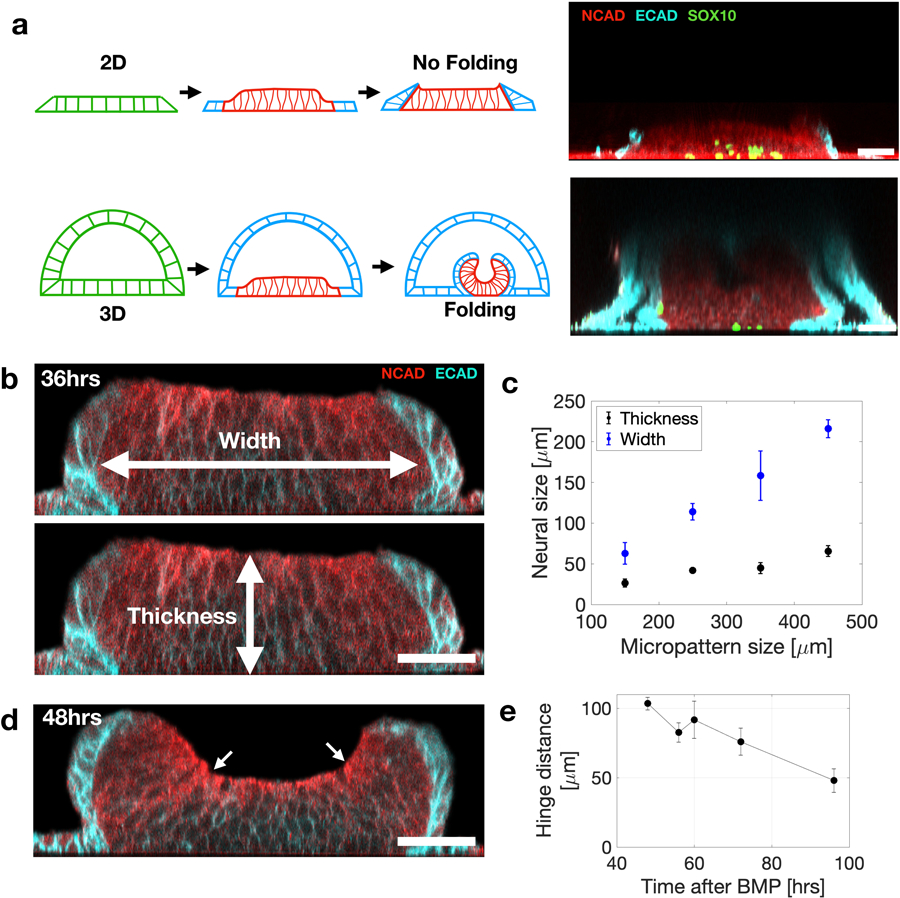
(a) Induction of neural pattern formation in 3D stem cell cultures with a lumen triggers folding morphogenesis. In contrast triggering pattern formation in 2D micropatterned cultures does not trigger folding morphogenesis. Vertical sections of a 3D immunostained sample (top) and 2D immunostained sample (bottom). Imaged 72hrs after BMP. (b) Vertical section at 36hrs post BMP, and before folding. The neural tissue thickness and width are indicated. (c) Quantification of neural tissue thickness and width as a function of micropattern size analyzed 36hrs after BMP exposure. Data are presented as mean values +/- SD , Total N=23. (d) Vertical section of immunostained samples during neural fold morphogenesis. Arrows indicate hinge points. (e) Distance between hinge points as a function of time after BMP exposure . Data are presented as mean values +/- SD, N=3. Scale bars are 50μm.
Extended Figure 5. Neural hinge points and apical surface characterization.
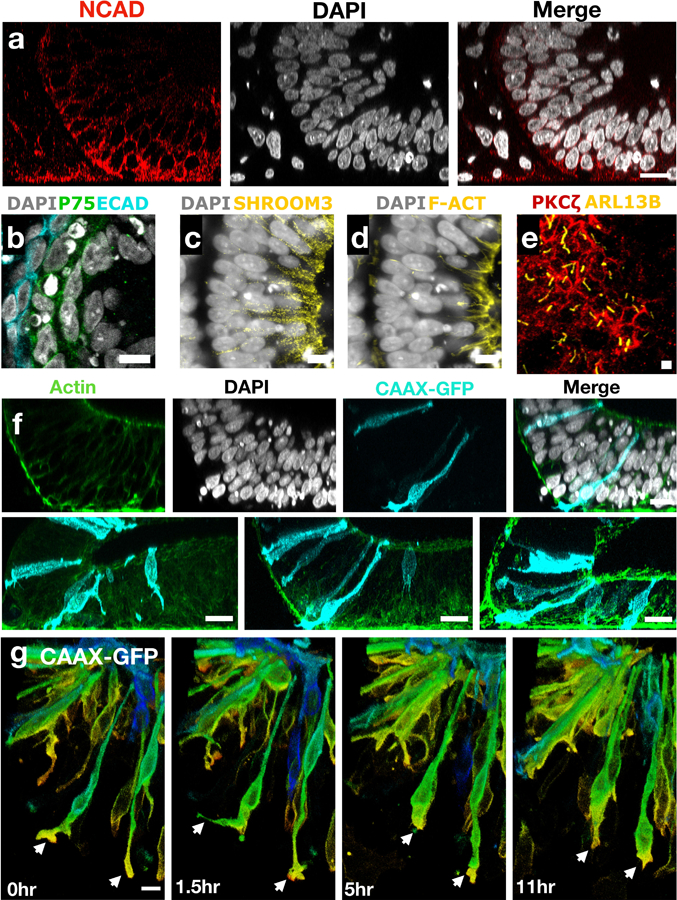
(a) Vertical sections of a hinge points showing changes in nuclei orientation across the hinge. (b) Neural crest membrane marker P75 appears in a layer of cells in between the neural tissue and surface ectoderm (ECAD). (c) Immunostaining of shroom3 and (d) F-actin at the neural apical surface. (e) Image projection of apical marker PKCζ and primary cilia marker ARL13B. (f) Sparse labeling of cells with CAAX-GFP. Labeled cells arise from a single clone indicating motility of cells following proliferation. (g) Live-cell imaging showing active filopodia (arrows) of neural cells as they change their position and shape over time. The continuous spectrum of colors indicates distance from glass (red 0μm -green - blue 35μm). Scale bars are 25μm (a,f) 10μm (b-e,g).
Extended Figure 6. Live imaging of neural crest cells.
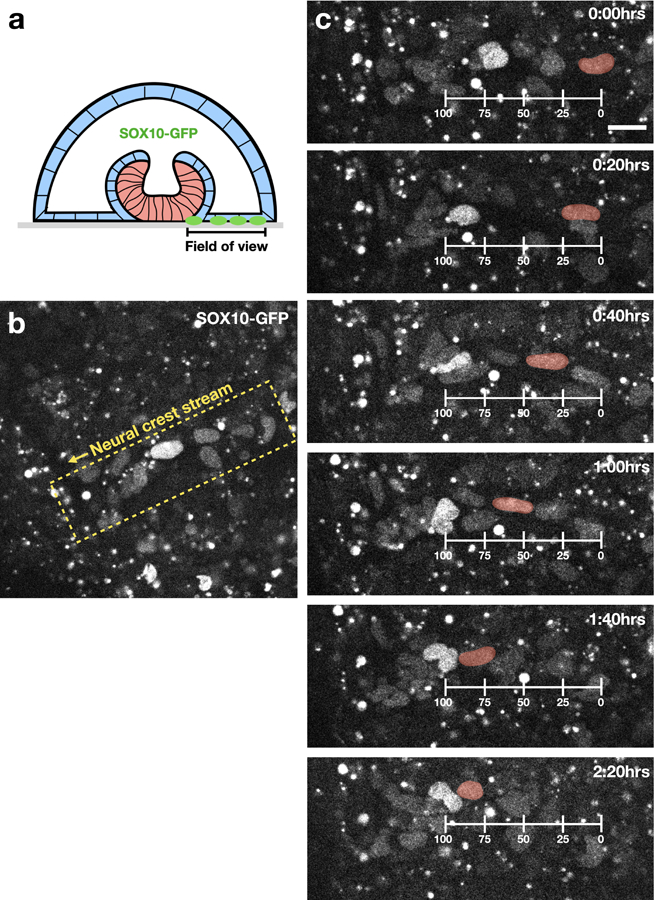
Time-lapse images showing motion of neural crest cells (SOX10-GFP). (a) Scheme indicating region in which live imaging was performed. (b) Low magnification image showing neural crest cells are organized in a stream. (c) Neural crest cell motion along the stream. A single cell is tracked and artificially colored in red. Scale bar 25μm.
Extended Figure 7. Extracellular localization and expression during neural folding.
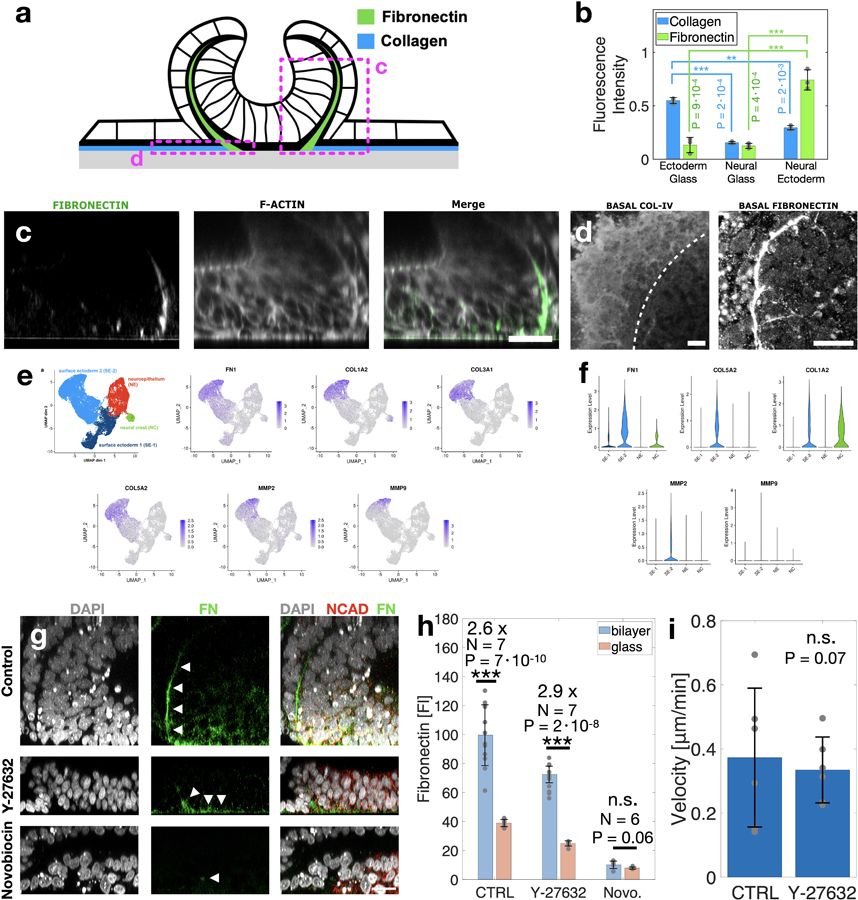
(a) Scheme showing ECM composition in three interfaces: surface-ectoderm/glass, surface-ectoderm/ neural-ectoderm and neural-ectoderm/glass. (b) Collagen and fibronectin fluorescence intensity compared at the three interfaces. Data are presented as mean values +/- SD. N=3 independent samples (c) Vertical sections show fibronectin. (d) Horizontal sections near the glass interface show collagen V and fibronectin. Dashed line indicates border between neural and non-neural ectoderm. (e) UMAP projection and (f) violin plots of ECM genes and ECM modulators are localized to the surface ectoderm clusters. Average expression was 1–2 orders of magnitude higher in surface ectoderm vs neural ectoderm. (g) Vertical sections showing immunostaining of fibronectin matrix in control sample, ROCK inhibition (Y-27632, 10μM), and Novobiocin (100 μM). (h) Fluorescence intensities of immunostained fibronectin were measured at the neural/surface-ectoderm interface and at the neural/glass interface in all three experimental conditions. Immunostaining and imaging conditions were identical for all conditions. Fluorescence values were measured by averaging the raw fluorescence intensities in a region of interest in the image. The number of independent samples N is indicated within the plot. (i) Cell velocity of non-neural ectoderm cells measured by live-imaging of H2B-RFP cell line. No significant difference is observed in ROCK inhibited samples. N=6. Data are presented as mean values +/- SD (b,h,i). Scale bars are 25 microns. Two-sided t-test was applied (b,h).
Extended Figure 8. Single cell expression of key cell type markers.
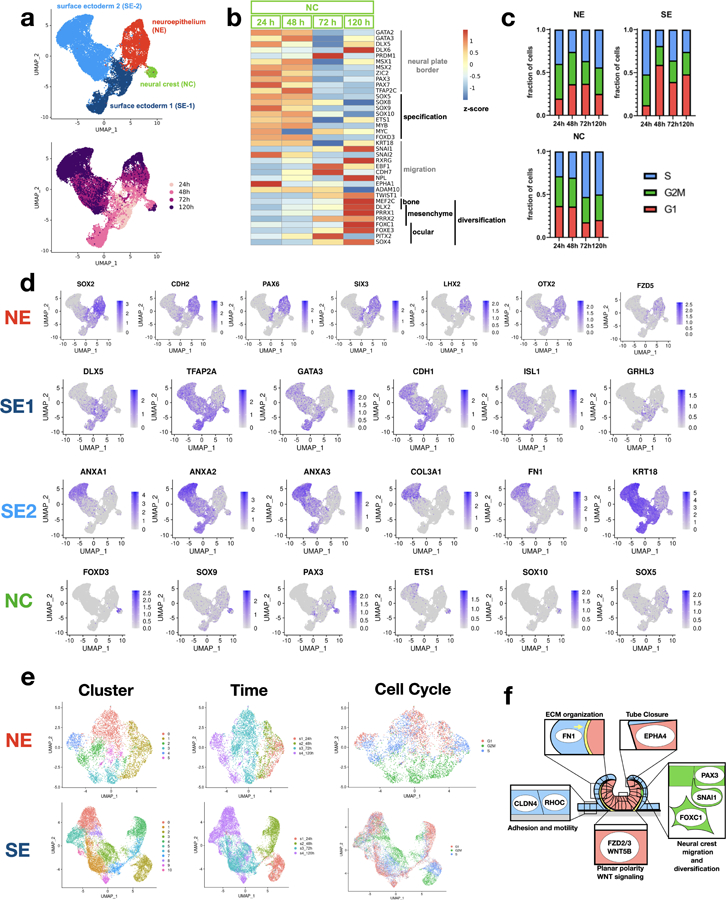
(a) UMAP plots of single cell gene expression color coded by cluster identity (top) and experimental time point (bottom). Four main cell clusters are observed. (b) Temporal evolution of gene expression in the neural crest population indicate a transition from neural plate border/neural crest specification to migration and divarication. (c) Inferred cell-cycle populations for three clusters: neural ectoderm (NE), surface ectoderm (SE), and neural crest (NC). SE exhibits increase in G1 over time, and NC exhibits a decrease in G1. (d) Expression of key cell type markers from the four main clusters. (e) Sub-clustering of NE and SE. Neural cells sub-cluster mainly by experimental time and cell-cycle phase, which correspond to UMAP 1 and 2. In contrast, surface ectoderm cells sub-clusters do not cluster by cell-cycle or experimental time, suggesting additional differences in cell identity. (f) Scheme showing cellular process in each cluster. Titles are enriched GO pathways, and example genes appearing within each pathway.
Extended Figure 9. Folding morphogenesis occurs in the absence of mesendoderm tissue.
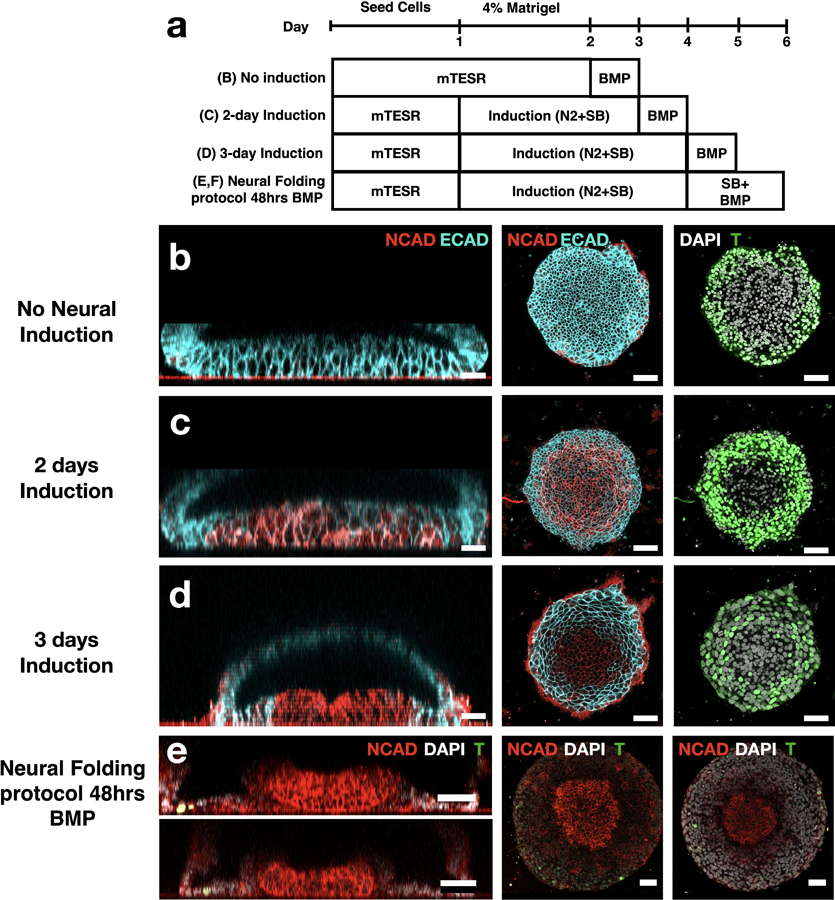
(a) Experimental timeline to examine effect of neural induction on cell fate and folding morphogenesis. (b-d) Vertical (left) and horizontal (middle, right) sections showing that neural fates (NCAD) are upregulated with longer neural induction, whereas mesendoderm fates (Brachyury) are downregulated. (e,f) A small number of Brachyury+ cells (<10) is present in the protocol used to for neural tube morphogenesis. Total number of cells in the tissue is ~5000 cells. Scale bar is 50μm. Dome present in all cases.
Extended Figure 10. Computational model of neural folding recapitulates in vitro morphology.
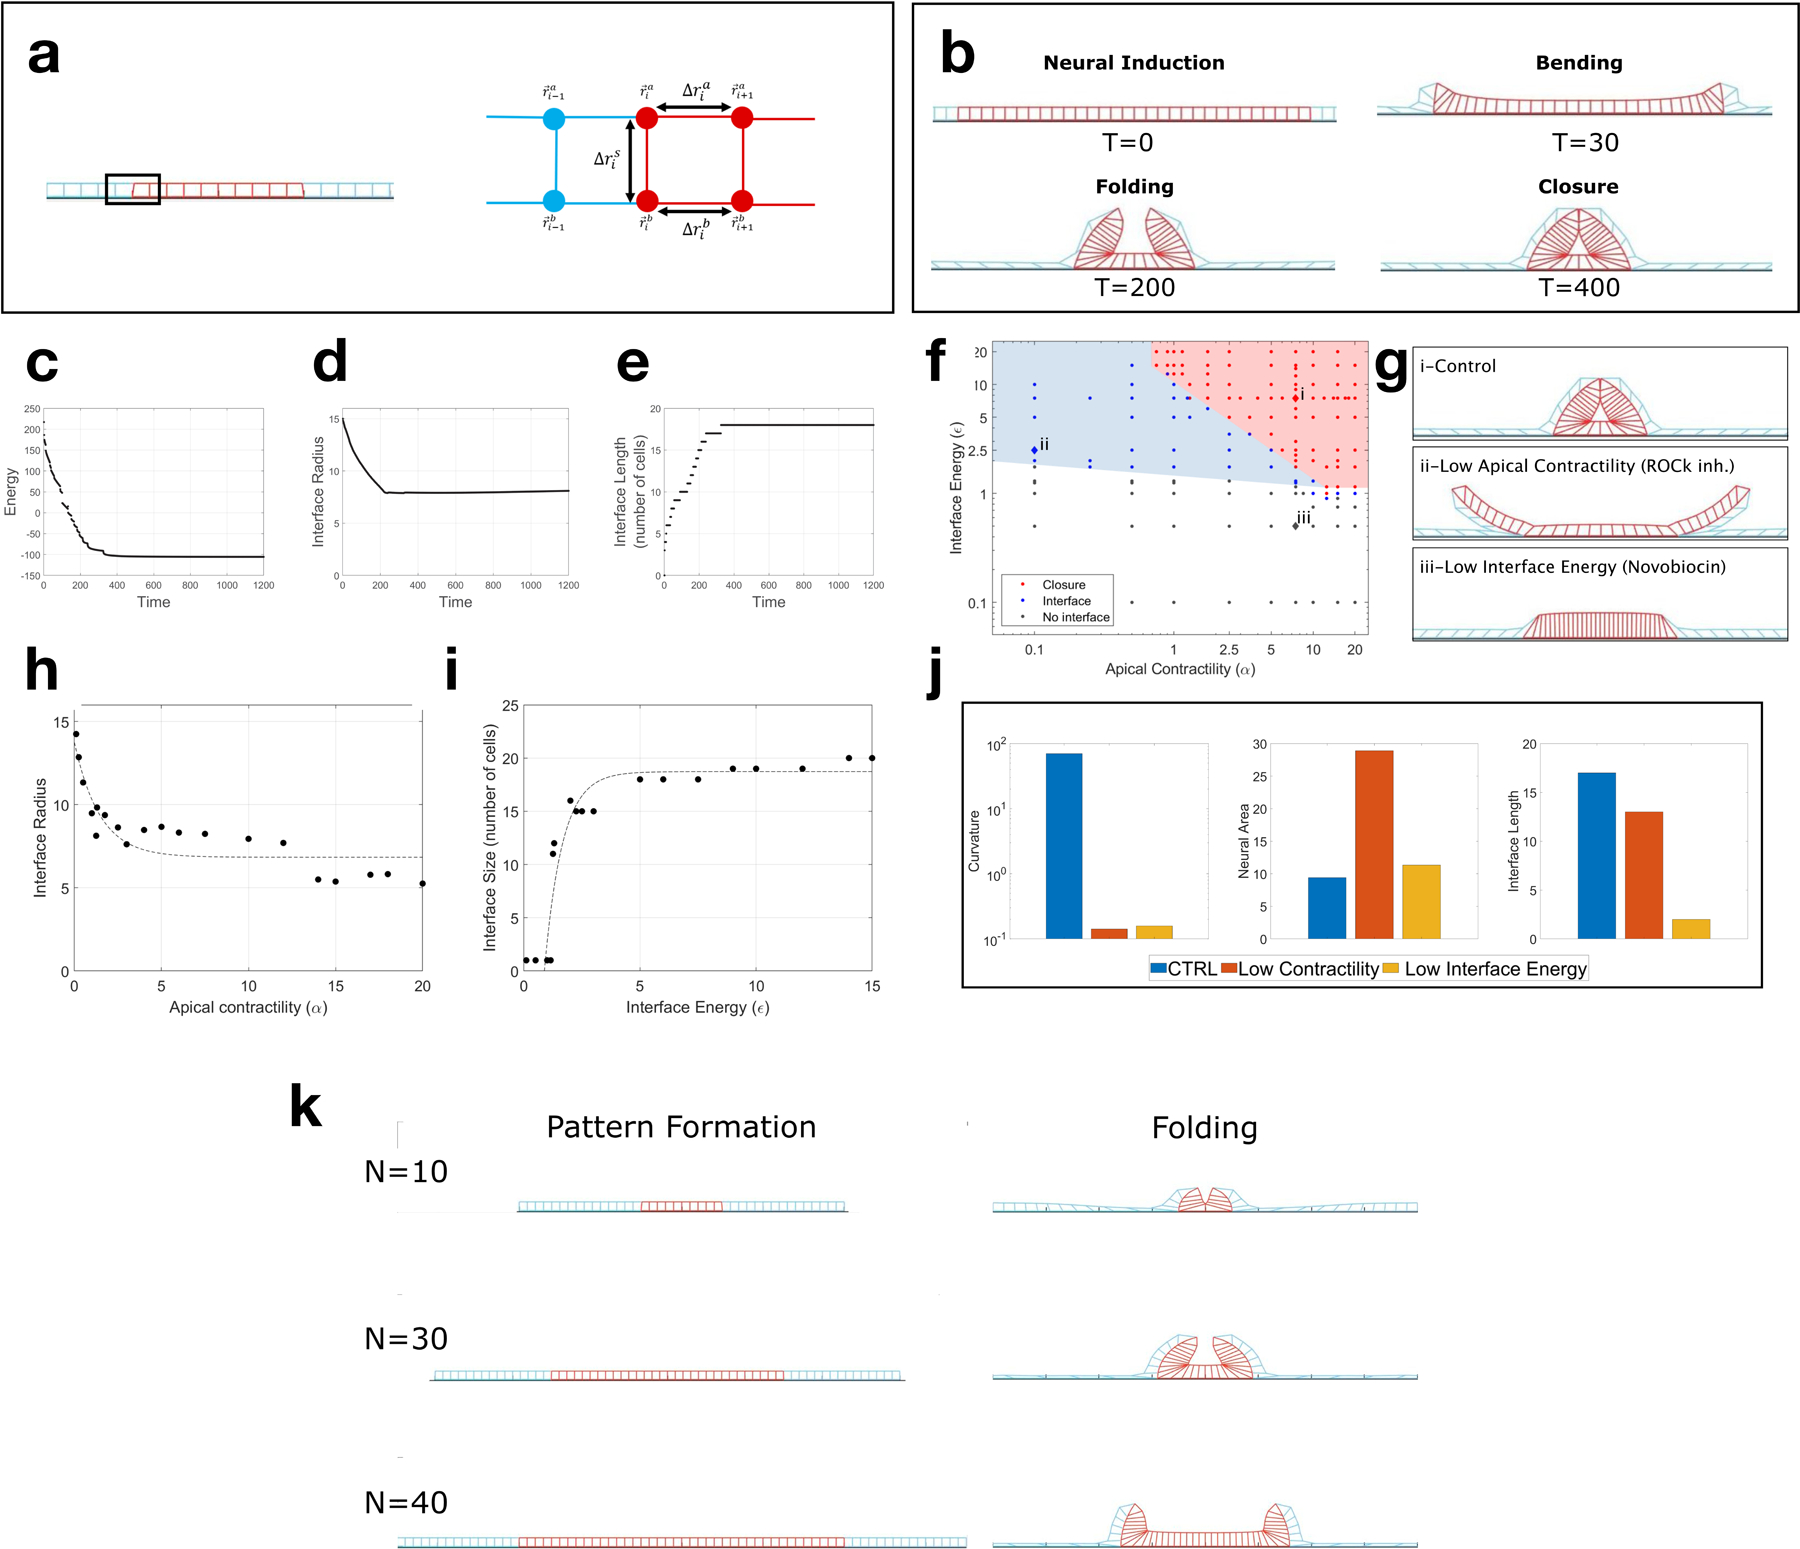
(a) Vertex model scheme. Vertices are connected by Hookean springs of length . and are the apical and basal vertices (x and z) of cell i. Neural cells have additional myosin dependent positive apical line tension, and there is a negative line tension between neural and non-neural basal surfaces (see Supplementary Notes details). (b) Time sequence of simulation showing initial cell pattern (neural tissue in red, non-neural in blue), followed by neural bending, folding and hinge formation, and closure. Each time unit corresponds to 1000 steps in the simulation. Apical lines in the neural domain strongly contract due to myosin, but never reach zero values. (c) Energy of the tissue reduces over time and reaches a minimum. (d) Interface radius and (e) Number of cells on the interface as a function of time. Both reach a steady-state value. (f) Phase diagram of the dimensionless parameters interface energy (), neural contractility (α). Each point represents a simulation that reached a steady state. Color code represents the final configuration of the simulations: neural fold closed (red), formation of neural/non-neural interface without closure (blue), and no interface formation (black). Shaded colors were drawn by hand to highlight regime boundaries. (g) Final configuration images (steady state shapes) from the simulation in different regions i) high neural apical contractility and high interface energy leads to a closed fold; ii) Low neural apical contractility and high interface energy leads to the formation of the interface but an open fold; iii) High neural apical contractility and low interface energy leads to a flat tissue. (h) The interface radius of curvature as a function of neural apical contractility. (i) The number of cells in an interface as a function of interface energy. (j) Bar plots showing the neural apical curvature, neural apical area, and interface size for the three conditions whose final configuration are shown in g. (k) Three simulations with a 40 non-neural cells , and a varying number of neural cells N=10,30,40. Left: images of the simulation at time zero. Right: Images of the simulation at the hinge formation stage. Images were taken at this stage for consistency with experimental data (Fig. 4d, 72hrs). We observe the formation of a single hinge point for N=10, and two lateral hinges for N=30,40.
Supplementary Material
Acknowledgments
S.J.S. acknowledges NIH grant R21 HD099598–0. E.K. acknowledges the Human Frontier Science Program for the long-term postdoctoral fellowship (LT000629/2018-L). A.H.K. acknowledges support of the National Science Foundation Graduate Research Fellowship Program (Grant no. 1650114). EDS acknowledges NSF grant 2013131. A.W. acknowledges Welch Foundation grant no C-2021. S.M.K.G was recipient of an Early Postdoc Mobility grant and a Postdoc Mobility grant from the Swiss National Science Foundation (P2ZHP3_174753 and P400PB_186800). B.I.S. and E.K. acknowledge NSF Physics grant 1707973. We thank Y. Huang and the Gladstone institute for sharing CTR2 hiPSC line, and Brivanlou lab and the Rockefeller University for sharing RUES2 embryonic and reporter lines. We thank UCLA Technology Center for Genomics & Bioinformatics for sequencing of 10x libraries. We thank the Streichan and Kosik lab members, as well as the UCSB stem-cell center and associate director Cassidy Arnold for fruitful discussions and advice. Finally, we thank Alexandra M. Tayar for valuable comments on the manuscript.
Footnotes
Competing interests
The authors declare no competing interests.
Data Availability.
Source data are provided with this paper. Single-cell RNA sequencing data have been deposited and publicly-available in the NCBI Gene Expression Omnibus (GEO; http://www.ncbi.nlm.nih.gov/geo) under accession number (GSE173492) .
Code Availability.
The Matlab code for the simulation used in this manuscript is deposited in GitHub (https://github.com/heitormegale/Neural-fold-simulation).
References
- 1.Wallingford JB, Niswander LA, Shaw GM & Finnell RH The Continuing Challenge of Understanding, Preventing, and Treating Neural Tube Defects. Science (80-. ) 339, 1222002–1222002 (2013). [DOI] [PMC free article] [PubMed] [Google Scholar]
- 2.Lee S & Gleeson JG Closing in on Mechanisms of Open Neural Tube Defects. Trends Neurosci 43, 519–532 (2020). [DOI] [PMC free article] [PubMed] [Google Scholar]
- 3.Kim J, Koo B-K & Knoblich JA Human organoids: model systems for human biology and medicine. Nat. Rev. Mol. Cell Biol 21, 571–584 (2020). [DOI] [PMC free article] [PubMed] [Google Scholar]
- 4.Quadrato G & Arlotta P Present and future of modeling human brain development in 3D organoids. Curr. Opin. Cell Biol 49, 47–52 (2017). [DOI] [PubMed] [Google Scholar]
- 5.Nikolopoulou E, Galea GL, Rolo A, Greene NDE & Copp AJ Neural tube closure: cellular, molecular and biomechanical mechanisms. Development 144, 552–566 (2017). [DOI] [PMC free article] [PubMed] [Google Scholar]
- 6.Haremaki T et al. Self-organizing neuruloids model developmental aspects of Huntington’s disease in the ectodermal compartment. Nat. Biotechnol 37, 1198–1208 (2019). [DOI] [PubMed] [Google Scholar]
- 7.Britton G, Heemskerk I, Hodge R, Qutub AA & Warmflash A A novel self-organizing embryonic stem cell system reveals signaling logic underlying the patterning of human ectoderm. Development 146, dev179093 (2019). [DOI] [PMC free article] [PubMed] [Google Scholar]
- 8.Ybot-Gonzalez P, Cogram P, Gerrelli D & Copp AJ Sonic hedgehog and the molecular regulation of mouse neural tube closure. Development 129, 2507–17 (2002). [DOI] [PubMed] [Google Scholar]
- 9.Blom HJ, Shaw GM, den Heijer M & Finnell RH Neural tube defects and folate: case far from closed. Nat. Rev. Neurosci 7, 724–731 (2006). [DOI] [PMC free article] [PubMed] [Google Scholar]
- 10.Nikolaev M et al. Homeostatic mini-intestines through scaffold-guided organoid morphogenesis. Nature 585, 574–578 (2020). [DOI] [PubMed] [Google Scholar]
- 11.Xue X et al. Mechanics-guided embryonic patterning of neuroectoderm tissue from human pluripotent stem cells. Nat. Mater 17, 633–641 (2018). [DOI] [PMC free article] [PubMed] [Google Scholar]
- 12.Zheng Y et al. Dorsal-ventral patterned neural cyst from human pluripotent stem cells in a neurogenic niche. Sci. Adv 5, eaax5933 (2019). [DOI] [PMC free article] [PubMed] [Google Scholar]
- 13.Sahni G et al. A Micropatterned Human‐Specific Neuroepithelial Tissue for Modeling Gene and Drug‐Induced Neurodevelopmental Defects. Adv. Sci 8, 2001100 (2021). [DOI] [PMC free article] [PubMed] [Google Scholar]
- 14.R., O. & F., M. Developmental Stages in Human Embryos (Contrib. Embryol., Carnegie Inst. Wash., 1987). [Google Scholar]
- 15.Ray HJ & Niswander LA Dynamic behaviors of the non-neural ectoderm during mammalian cranial neural tube closure. Dev. Biol 416, 279–285 (2016). [DOI] [PMC free article] [PubMed] [Google Scholar]
- 16.Rolo A et al. Regulation of cell protrusions by small GTPases during fusion of the neural folds. Elife 5, e13273 (2016). [DOI] [PMC free article] [PubMed] [Google Scholar]
- 17.Martins-Green M Origin of the dorsal surface of the neural tube by progressive delamination of epidermal ectoderm and neuroepithelium: implications for neurulation and neural tube defects. Development 103, 687–706 (1988). [DOI] [PubMed] [Google Scholar]
- 18.Molè MA et al. Integrin-Mediated Focal Anchorage Drives Epithelial Zippering during Mouse Neural Tube Closure. Dev. Cell 52, 321–334.e6 (2020). [DOI] [PMC free article] [PubMed] [Google Scholar]
- 19.Ji Y et al. Single cell transcriptomics and developmental trajectories of murine cranial neural crest cell fate determination and cell cycle progression. bioRxiv 2021.05.10.443503 (2021). doi: 10.1101/2021.05.10.443503 [DOI] [Google Scholar]
- 20.Vega FM, Fruhwirth G, Ng T & Ridley AJ RhoA and RhoC have distinct roles in migration and invasion by acting through different targets. J. Cell Biol 193, 655–665 (2011). [DOI] [PMC free article] [PubMed] [Google Scholar]
- 21.Baldassarre M et al. Filamins Regulate Cell Spreading and Initiation of Cell Migration. PLoS One 4, e7830 (2009). [DOI] [PMC free article] [PubMed] [Google Scholar]
- 22.Grande-García A et al. Caveolin-1 regulates cell polarization and directional migration through Src kinase and Rho GTPases. J. Cell Biol 177, 683–694 (2007). [DOI] [PMC free article] [PubMed] [Google Scholar]
- 23.de Almeida PG, Pinheiro GG, Nunes AM, Gonçalves AB & Thorsteinsdóttir S Fibronectin assembly during early embryo development: A versatile communication system between cells and tissues. Dev. Dyn 245, 520–535 (2016). [DOI] [PubMed] [Google Scholar]
- 24.Lemay P et al. Loss-of-function de novo mutations play an important role in severe human neural tube defects. J. Med. Genet 52, 493–497 (2015). [DOI] [PubMed] [Google Scholar]
- 25.Chen Z, Kuang L, Finnell RH & Wang H Genetic and functional analysis of SHROOM1–4 in a Chinese neural tube defect cohort. Hum. Genet 137, 195–202 (2018). [DOI] [PMC free article] [PubMed] [Google Scholar]
- 26.Butler MB et al. Rho kinase-dependent apical constriction counteracts M-phase apical expansion to enable mouse neural tube closure. J. Cell Sci 132, jcs230300 (2019). [DOI] [PMC free article] [PubMed] [Google Scholar]
- 27.Schoenwolf GC & Smith JL Mechanisms of neurulation: traditional viewpoint and recent advances. Development 109, 243–70 (1990). [DOI] [PubMed] [Google Scholar]
- 28.Hernandez I et al. A farnesyltransferase inhibitor activates lysosomes and reduces tau pathology in mice with tauopathy. Sci. Transl. Med 11, eaat3005 (2019). [DOI] [PMC free article] [PubMed] [Google Scholar]
- 29.Karzbrun E, Khankhel A & Streichan SJ Recapitulating neural tube morphogenesis with human pluripotent stem cells. Protoc. Exch (2021). doi: 10.21203/rs.3.pex-1606/v1 [DOI] [Google Scholar]
- 30.Li L et al. Ectodermal progenitors derived from epiblast stem cells by inhibition of Nodal signaling. J. Mol. Cell Biol 7, 455–465 (2015). [DOI] [PubMed] [Google Scholar]
- 31.Wilson PA, Lagna G, Suzuki A & Hemmati-Brivanlou A Concentration-dependent patterning of the Xenopus ectoderm by BMP4 and its signal transducer Smad1. Development 124, 3177–84 (1997). [DOI] [PubMed] [Google Scholar]
- 32.Boel NM-E, Hunter MC & Edkins AL LRP1 is required for novobiocin-mediated fibronectin turnover. Sci. Rep 8, 11438 (2018). [DOI] [PMC free article] [PubMed] [Google Scholar]
- 33.Robert E & Guibaud P MATERNAL VALPROIC ACID AND CONGENITAL NEURAL TUBE DEFECTS. Lancet 320, 937 (1982). [DOI] [PubMed] [Google Scholar]
- 34.Hughes A, Greene NDE, Copp AJ & Galea GL Valproic acid disrupts the biomechanics of late spinal neural tube closure in mouse embryos. Mech. Dev 149, 20–26 (2018). [DOI] [PMC free article] [PubMed] [Google Scholar]
- 35.Hamburger V & Hamilton HL A series of normal stages in the development of the chick embryo. Dev. Dyn 195, 231–272 (1992). [DOI] [PubMed] [Google Scholar]
- 36.Theiler K The house mouse: atlas of embryonic development (Springer Science \& Business Media, 1989). [Google Scholar]
- 37.Butler A, Hoffman P, Smibert P, Papalexi E & Satija R Integrating single-cell transcriptomic data across different conditions, technologies, and species. Nat. Biotechnol 36, 411–420 (2018). [DOI] [PMC free article] [PubMed] [Google Scholar]
- 38.Stuart T et al. Comprehensive Integration of Single-Cell Data. Cell 177, 1888–1902.e21 (2019). [DOI] [PMC free article] [PubMed] [Google Scholar]
- 39.McGinnis CS, Murrow LM & Gartner ZJ DoubletFinder: Doublet Detection in Single-Cell RNA Sequencing Data Using Artificial Nearest Neighbors. Cell Syst 8, 329–337.e4 (2019). [DOI] [PMC free article] [PubMed] [Google Scholar]
- 40.Hafemeister C & Satija R Normalization and variance stabilization of single-cell RNA-seq data using regularized negative binomial regression. Genome Biol 20, 296 (2019). [DOI] [PMC free article] [PubMed] [Google Scholar]
- 41.Zhou Y et al. Metascape provides a biologist-oriented resource for the analysis of systems-level datasets. Nat. Commun 10, 1523 (2019). [DOI] [PMC free article] [PubMed] [Google Scholar]
- 42.Tirosh I et al. Dissecting the multicellular ecosystem of metastatic melanoma by single-cell RNA-seq. Science (80-. ) 352, 189–196 (2016). [DOI] [PMC free article] [PubMed] [Google Scholar]
Associated Data
This section collects any data citations, data availability statements, or supplementary materials included in this article.


