

Abstract
Triple negative breast cancer (TNBC) is a subtype of breast cancer lacking targetable biomarkers. TNBC is known to be most aggressive, and when metastatic is often drug resistant and uncurable. Biomarkers predicting response to therapy improve treatment decisions and allow personalized approaches for TNBC patients. This study explores sulfated glycosaminoglycan (sGAG) levels as a predictor of TNBC response to platinum therapy. sGAG levels were quantified in three distinct TNBC tumor models including cell line-derived, patient-derived xenograft (PDX) tumors, and isogenic models deficient in sGAG biosynthesis. The in vivo antitumor efficacy of Triplatin, a sGAG-directed platinum agent, was compared in these models to the clinical platinum agent, carboplatin. We determined that >40% of TNBC PDX tissue microarray samples have high levels of sGAGs. The in vivo accumulation of Triplatin in tumors as well as antitumor efficacy of Triplatin positively correlated with sGAG levels on tumor cells, whereas carboplatin followed the opposite trend. In carboplatin-resistant tumor models expressing high levels of sGAGs, Triplatin decreased primary tumor growth, reduced lung metastases, and inhibited metastatic growth in lungs, liver, and ovaries. sGAG levels served as a predictor of Triplatin sensitivity in TNBC. Triplatin may be particularly beneficial in treating patients with chemotherapy-resistant tumors who have evidence of residual disease after standard neoadjuvant chemotherapy. More effective neoadjuvant and adjuvant treatment will likely improve clinical outcome of TNBC.
Introduction
Triple negative breast cancer (TNBC) represents 15–20% of breast cancers and is defined by the lack of estrogen- and progesterone-receptor expression and absence of overexpression of human epidermal growth factor receptor 2 (HER2). Chemotherapy remains the primary treatment, and the standard of care is to use taxanes and anthracyclines as first-line therapy for both early stage and metastatic TNBCs (1,2). TNBC is known to be the most aggressive subtype and recurs in half of patients after curative treatment, and rapidly develops drug resistance and metastases. The average life expectancy of approximately 1 year after recurrence underscores the need for novel therapeutic regimens (3).
Advancements in patient survival continue through new approaches to precision medicine and biomarker research, such as the recently FDA-approved pembrolizumab (PD-L1 antibody), for use in early stage TNBC in combination with standard neoadjuvant chemotherapy (NACT); the Trop-2 antibody-drug conjugate, sacituzumab govitecan, for use in metastatic TNBC; and a combination of atezolizumab (PD-L1 antibody) and nab-paclitaxel, also for treatment of metastatic TNBC (4–6). Other strategies aim to optimize patient responses and survival through new combinational regimens (7). Recent clinical trials for early stage TNBC show that addition of carboplatin or carboplatin/pembrolizumab to standard NACT regimens significantly increases the number of patients who achieve a pathological complete response (pCR), which is a known surrogate for better survival (7,8). For patients with metastatic TNBC harboring BRCA mutations, the Phase III TNT trial showed patients who received carboplatin had higher overall response rates (68% vs 33%; p=0.01) than those who received docetaxel (9). Biomarkers predicting response to therapy will continue to improve treatment decisions and allow for personalized approaches for TNBC patients.
Studies aimed at the identification of biomarkers and treatment targets of TNBC have mainly focused on mRNAs, miRNAs, and proteins (10). However, carbohydrates, such as glycosaminoglycans (GAGs), are relatively unexplored as biomarkers or treatment targets for TNBC. The non-template driven nature of GAG biosynthesis involves the concerted action of many enzymes, which complicates the analysis of expression at the genomic/proteomic level and their role in clinical oncology. GAGs, such as heparan sulfate (HS) and chondroitin sulfate (CS) are linear polymers of repeated disaccharide units that are modified with sulfate groups at various positions. The resulting sulfated GAGs (sGAGs) are highly negatively charged and are known to mediate interactions of angiogenic factors, such as cytokines and growth factors with their respective cell surface receptors (11). Changes in chain length, sulfation, and the expression of proteoglycans (containing GAG attachment sites) at the cell surface and within the extracellular matrix are associated with the progression of TNBC and other cancers (11–13).
Recently, we discovered that the positively charged platinum agent, Triplatin (BBR3464), has high affinity for sGAGs, which mediates its cellular accumulation and cytotoxicity, while these properties are not shared by either cisplatin or carboplatin (14). Triplatin-sGAG interactions inhibit cancer cell growth and invasion by blocking growth factor signaling and heparanase activity (15). In this contribution, we explore sGAGs as a predictive marker for Triplatin efficacy against models of TNBC primary tumor growth and metastasis.
Materials and Methods
Reagents.
Triplatin was synthesized by published procedures (16). Carboplatin and cisplatin were purchased from Sigma.
Cell lines and culture conditions
CHO-K1, CHO pgsE-606, and CHO pgsA-745 were purchased from ATCC. CHO pgsF-17 was provided by Dr. Jeffrey Esko at the University of California San Diego. All CHO cell lines were cultured in DMEM-F12 media with 10% fetal bovine serum (FBS) and 1% penicillin/streptomycin. MDA-MB-231-BrM2-luc cells (provided by Dr. Joan Massauge at Sloane Kettering Cancer Center) and MDA-MB-231-luc cells (provided by Dr. Danny Welch at University of Kansas) were cultured in DMEM media (Invitrogen) with 10% FBS, 1% L-glutamine, and 1% penicillin/streptomycin (Gibco). The MDA-MB-231-luc cells were generated by infection with lentiviruses containing the pFULT vector expressing fire-fly luciferase. The lentiviruses were generated by DNA/RNA Delivery Core, Skin Disease Research Center, Department of Dermatology, Northwestern University Feinberg Medical School. 4T1-luc cells (provided by Dr. Sarah Spiegel at Virginia Commonwealth University) were cultured in RPMI media with 10% FBS and 1% penicillin/streptomycin. All cells were grown in a humidified atmosphere at 37°C with 5% CO2. Cells were routinely checked for mycoplasma contamination using the mycoplasma detection kit (Lorenzo).
Knock-out of Xylt1/2
sGAG-deficient MDA-MB-231 cell lines were generated by transfecting the parental/wild-type MDA-MB-231-luc cell line according to the protocol found in (17). Cells received either Cas9 plasmid and empty DNA backbone (control cells) or Cas9, Xylt1, and Xylt2 gRNA plasmids (Knock-out [KO] cells). Following transfection, cells were single cell sorted based upon GFP expression and allowed to grow in 96-well plates for 4 weeks, to allow for the clonal expansion of individual cell lines. Wild-type (wt) and generated control, and KO cells were then screened via flow cytometry using sGAG specific antibodies, to detect sGAG deficient cell lines with XYLT1/2 KO and to confirm that control cell lines matched wild-type sGAG levels. Following screening, cells were used for in vitro and in vivo studies. Genomic alterations in KO cells were confirmed via cloning of Xylt1/2 PCR products and ligation into TOPO TA sequencing plasmid. Sequencing was carried out using Euro Fins Sanger Sequencing, M13F primer. PCR Primers – Xylt1fwd (gtttctctcccctcttctccag), Xylt1rev (atgtcacacttagggggctg), Xylt2fwd (cccagtgatgtgtctgcatc), Xylt2rev (gtatctccgtgtggtgggaag). Each cell line was sequenced 6 times for each gene to ensure accuracy.
sGAG quantitation
Blyscan assay.
The Blyscan assay was used per the manufacturer’s instructions (Biocolor). Cells were seeded onto 100 mm dishes and grown to 90% confluence. Cells and cellular matrix were dissociated from dishes in 1 ml trypsin-EDTA and placed directly on ice. After the number of cells in each sample were determined, 100 μl of the suspension was added to 1 ml of 1,9-dimethylmethylene blue (DMMB) dye reagent and mixed via inversion every 5 min for 30 min. The samples were centrifuged at 12,000 rpm for 10 min. to pellet precipitated GAG-dye complexes. Complexes were then resolved in SDS-containing dissociation reagent and the absorbance of bound dye was measured at 656 nm. Values were compared to chondroitin-4-sulfate standards and normalized to cell number.
Flow cytometry.
To study the relative amounts of cell surface sGAGs expressed, the binding of the 10E4 antibody (clone F58–10E4, Amsbio) to sulfated HS can be quantitated using flow cytometry. Briefly, cells are harvested using versene and washed twice in cold PBS. 1.5 × 10⁶ cells are resuspended in PBS containing 0.5% BSA and kept on ice throughout the entire procedure. The cells are incubated with 1:100 10E4 primary antibody for 30 min. After washing twice with PBS, the cells are incubated with 1:400 goat anti-mouse IgM Alexa-647 conjugated secondary antibody (Life Technologies). Cells incubated with only secondary antibodies serve as negative controls. Fluorescence is measured using a Fortessa flow cytometer (BD Biosciences).
Immunohistochemistry (IHC).
All tissues were fixed in 10% neutral buffered formalin for at least 5 days before paraffin embedding and sectioning. A tissue microarray (TMA) was obtained from Champions Oncology containing breast cancer PDX samples. IHC staining for human leukocyte antigen (HLA) primary antibody (Abcam, clone EMR8–5, 1:50 dilution) and N-sulfated heparan sulfate (Amsbio, clone F58–10E4, 1:100 dilution) was performed in the VCU Cancer Mouse Models Core with the Leica Bond RX autostainer. All antibodies were incubated for 30 min at 25°C. For HLA staining heat-induced epitope retrieval buffer 2 (Leica, EDTA pH 8.0) was used. For negative control of N-sulfated heparan sulfate staining (10E4), slides were incubated with 50 mU Heparinase III (Sigma-Aldrich) in Tris buffer (20 mM Tris-HCL, pH 7.5 containing 0.1 mg/ml bovine serum albumin and 4 mM CaCl2) for 45 min at 37°C, 3 times, before primary antibody incubation. Digestion with heparinase III cleaves the heparan sulfate chain and results in a loss of the 10E4 epitope. For the positive N-sulfated heparan sulfate staining (10E4) slides were incubation with the Tris buffer only for 45 min at 37°C, 3 times, before primary antibody incubation. Bond polymer refine detection kit was used for DAB chromogen and hematoxylin counterstain (Leica). The tissue slides were visualized with a Vectra® Polaris™ Automated Quantitative Pathology Imaging System (Akoya Biosciences) using whole-slide scanning at 20x. Phenochart Whole Slide Contextual Viewer software was used to visualize the scans and inFrom software (Akoya Biosciences) was used to quantify the staining (18–20). The CHOK1 and psA-745 were used to titrate the 10E4 antibody and validate staining. Liver metastases were quantified by metastases cell number identified by the HLA staining using Cell Counter on ImageJ and then normalized to total liver area measured in ImageJ. n = 5, each group.
Cell Growth Inhibition
One thousand cells/well were seeded in 96-well plates. After 24 h, cells were treated with either carboplatin or Triplatin for 15 min in 200 μl media. Following treatment, drug media was removed, wells were washed with phosphate buffered saline (PBS) and replaced with drug-free media. Images and confluence data were acquired every 2 h for ~200 h using the IncuCyte Live Cell Analysis Imaging System (Sartorius). The Area Under Curve (AUC) was calculated for each concentration using GraphPad Prism 8.0, normalized against the control, and used to calculate the IC50 values for Triplatin and carboplatin.
Cellular Platinum Uptake
Intracellular platinum content was determined as previously described (14). Cells were seeded onto 100 mm dishes, allowed to attach for 24 h, and treated with 10 μM carboplatin or Triplatin. Following 1 or 3 h incubations, cells were harvested via trypsinization and counted. Cell pellets were washed repeatedly with PBS and digested in nitric acid for 72 h. Samples were filtered and analysed by inductively-coupled plasma mass spectrometry (ICP-MS). Values were compared to platinum standards and normalized to cell number.
Tumor Platinum Uptake
CHO-K1 and pgsA-745 (3.0 × 10⁶) cells were suspended 1:2 with 100 µl of PBS:14 mg/ml of Cultrex BME Type 3 (Bio-Techne) and subcutaneously injected into the left and right flanks of male NSG mice, respectively as described in (21). MDA-MB-231-luc Xylt1/2 KO cells (1.0 × 10⁴) were injected intraductally into female NSG mice. Once the tumors grew to a size of ~400 mm3, mice were given a single dose of Triplatin (0.3 mg/kg) or carboplatin (40 mg/kg) and euthanized 24h after administration. Tumors were harvested, weighed, dissolved in nitric acid for 72 h, and filtered. Platinum content was determined using ICP-MS as previously described (14). Values were normalized to wet tumor weight.
Drug Efficacy
In vivo mouse models.
Virginia Commonwealth University Institutional Animal Care and Use Committee (IACUC) approval was obtained for all experiments. NOD.Cg.-PrkdcscidIL2rgtm1Wjl/SzJ (NSG) mice were purchased from the Cancer Mouse Models Core Laboratory at VCU Massey Cancer Center. Balb/c mice were purchased from Envigo.
Orthotopic primary tumor studies.
MDA-MB-231-luc, MDA-MB-231-luc Xylt1/2 KO-F and KO-G (1×10⁴) cells, WHIM2-luc, UCD52-luc, and WHIM30-luc (1×10⁵) PDX cells were suspended in 100 µl of a 1:9 mix of PBS:Cultrex BME Type 3 (14 mg/ml, Bio-Techne) and injected into the 4th lactiferous duct of 6–8-week-old female NSG mice as described in (22,23). For 4T1 studies, (1×10⁴ cells suspended in 20µL 1:9 PBS: Cultrex BME Type 3) were injected in the 2nd lactiferous duct of 6–8 week old Balb/c mice. Mice were weighed 2x weekly. Since the mice experienced weight loss during drug treatments, a supplemental diet (Diet Gel 76A; ClearH20) was given ad lib to the mice starting 1 day after injection of the cells until the end of the experiment. Drug treatments (vehicle [saline], cisplatin [3 mg/kg], carboplatin [40 mg/kg], or Triplatin [0.3mg/kg]) were given interperitoneally (i.p.) on days 1, 5, and 9 (Q4Dx3) after randomization with day 1 being the day of randomization. Tumor growth was measured by using either digital caliper or bioluminescent imaging with the IVIS Spectrum (PerkinElmer). Using Studylog lab management software, the mice were randomized with the 2 factor (tumor volume and body weight) randomization Multi-Task program into groups once tumors reached an average of 150 mm3. At the endpoint, all mice were imaged live, euthanized and tumors were harvested and weighed. The bioluminescence of harvested tumors and organs were quantified by ex vivo imaging and analysis. Each organ was immersed for 5 min in luciferin/PBS (0.3 mg/ml).
Experimental metastasis studies.
MDA-MB-231-BrM2-luc cells (1×10⁵ for endpoint study or 1×10⁴ for survival study) or WHIM2-luc, UCD52-luc, and WHIM30-luc (5×10⁵ for endpoint studies) PDX cells in 100 µl sterile PBS were injected into the left cardiac ventricle of female 5-week-old NSG mice as described (23). BALB/c female 6–8-week-old mice were injected into the left cardiac ventricle with 4×10⁴ murine mammary cancer 4T1-luc cells (in 100 µL PBS) on day 0. The cells were mixed with luciferin (1.5 mg/ml) to permit immediate in vivo imaging (IVIS Spectrum, Perkin Elmer) to verify widespread seeding of tumor cells. Mice were randomized using Studylog lab management software with the 2 factor (total flux values and body weight) randomization Multi-Task program on day 1 for 4T1 injected mice and day 10 for MDA-MB-231-BrM2-luc, WHIM2-luc, UCD52-luc, and WHIM30-luc injected mice. The groups were as follows: 2 groups (control and Triplatin) for MDA-MB-231-BrM2-luc cells endpoint studies or 3 groups (vehicle, carboplatin, Triplatin) for 4T1, WHIM2-luc, UCD52-luc, and WHIM30-luc endpoint studies, or 3 groups (vehicle, cisplatin, and Triplatin) for MDA-MB-231-BrM2-luc cells survival studies. After randomization mice were treated i.p. with saline vehicle, cisplatin (3 mg/kg), carboplatin (40 mg/kg) or Triplatin (0.3 mg/kg) on days 1, 5 and 9 after randomization with day 1 being the day of randomization. Tumor burden was quantified by bioluminescence (radiance/sec) emitted from the cells after a subcutaneous injection of luciferin (150 mg/kg diluted in PBS) allowing for live in vivo imaging using the IVIS Spectrum and Living Image® software (PerkinElmer). For the endpoint study, mice were euthanized, and organs (kidneys, heart, lung, ovaries, liver, brain, and skeleton) were harvested for ex vivo imaging as described above.
Statistical analysis.
One-way or two-way analysis of variances (ANOVA) was performed to determine significant differences among the control and treatment groups. Tukey’s multiple comparisons tests (for one-way ANOVA) or Dunnett’s multiple comparison test (for two-way ANOVA) were performed to for comparison across groups. Unpaired t-tests were performed to compare 2 groups. Kaplan-Meier survival plots were generated and changes in survival were analyzed by the log-rank test. All analyses were calculated in GraphPad Prism 8 software and p values < 0.05 were considered significant.
Results
Sulfated glycosaminoglycans may be exploited for therapeutic benefit in TNBC.
Dysregulation of sGAG expression affects all stages of tumorigenesis and correlates with poor prognosis in multiple cancers (12,13). These findings have raised considerable interest in the development of sGAG-based qualitative and quantitative methods which include: alcian blue, 1,9-dimethylene blue (Blyscan), capillary electrophoresis, high-performance liquid chromatography (HPLC), mass spectrometry, and IHC. These methods have all been used to determine the relevance and significance that sGAGs play in biological processes, as identification of changes at the RNA/protein level are not sufficient to accurately predict changes in cell sGAG profile. Several reports observed increases in sGAG levels in TNBC and other BC cell lines as well as clinical samples compared to normal tissue, Table 1 (24–31).
Table 1.
Expression of sulfated glycosaminoglycans in breast cancer
| Observation | Method | Sample type | Ref |
|---|---|---|---|
| ↑ in total sulfated GAGs | carbazole, PAGE | Clinical (BC) | 24 |
| ↑ in total sulfated GAGs | Alcian Blue (IHC), DMMB | Clinical (BC), MDA-MB-231 | 25 |
| ↑ N-sulfated HS | Ab 10E4 (IHC) | Clinical (BC, TNBC) | 26–28 |
| ↑ N-sulfated HS | Ab 10E4 (flow cytometry) | MDA-MB-231, HCC38 | 29 |
| ↑ sulfated CS | Ab CS-56 (IHC, flow cytometry) | Clinical (BC), MDA-MB-231 | 30 |
| ↑ sulfated CS | VAR2CSA | Clinical (BC) | 31 |
Based on these observations, we analyzed a TMA of TNBC PDX samples for sGAG levels using two GAG-specific antibodies; Ab 3G10, which reacts with an HS neoepitope after heparinase III digestion and Ab 10E4, which reacts with N-sulfated HS. The Ab 10E4 staining showed a wide range of expression, with two distinct populations staining high (40%) and low (60%) (Fig. 1A,1B), whereas Ab 3G10 staining was high overall and less dynamic (Fig. S1). These results confirmed that sGAGs are upregulated in TNBC and thus, sGAG levels may be exploited for precision medicine with a compatible therapeutic.
Figure 1. Sulfated glycosaminoglycans are a potential target for Triplatin in TNBC.

A. IHC H-scores of TNBC PDX samples on TMA (n= 42) stained with Ab 10E4. Each data point represents the mean H-score for duplicate samples. B. Representative images of Ab 10E4 staining of TNBC PDX TMA samples.
Triplatin tumor uptake is sGAG-dependent.
The positively charged polynuclear platinum agent, Triplatin (Fig. 2A) interacts with negatively charged sGAGs with high affinity. The optimized structure for the interaction of [Pt(NH3)4]2+, the central platinum of Triplatin, with a sulfated monosaccharide, GlcNS(6S) is shown in Fig. 2B (32). Wild-type (wt) CHO-K1 cells and GAG-deficient CHO mutant cell lines pgsF-17, pgsE-606, and pgsA-745 (Fig. 2C) were used to determine how sGAG levels affect platinum uptake. The pgsF-17 (F17) cell line, harboring a mutation in HS 2–0- sulfotransferase (HS2ST1), does not show significant changes in total sGAG levels as measured by DMMB-based Blyscan assay (Fig. 2D), and instead shows a slight compensatory increase in N-sulfated HS (Fig. 2E). The pgsE-606 (E606) cell line, with a mutation in HS N-sulfotransferase (NDST1), and the pgsA-745 (A745) cell line, with a mutation in one of the rate-limiting controllers of sGAG biosynthesis, xylosyltransferase-2 (XYLT2), show a significant reduction in both total sGAG and N-sulfated HS (Fig. 2C-E, 2I). To determine the effect of sGAG levels on platinum uptake, we compared the cellular accumulation of Triplatin and carboplatin in these cell lines (Fig. 2F). The overall cellular accumulation of Triplatin in the control cell line was significantly higher than that of carboplatin, as expected from previous results (14). The cellular accumulation (Fig. 2F) and cytotoxicity (Fig. 2G-H) of Triplatin increases with increasing sGAG levels (IC50 decreases from 120 ± 4.2 nM to 69.5 ± 0.3 nM). Surprisingly, the cellular accumulation (Fig.2F) and cytotoxicity (Fig. 2G-H) of carboplatin negatively correlates with sGAG levels (IC50 increasing from 434 ± 71 nm to ≥ 1000 nM). Furthermore, significantly more Triplatin accumulated in vivo in the wt compared to the GAG-deficient A745 tumor, whereas carboplatin showed a slightly increased accumulation in the A745 tumor compared to the wt (Fig. 2I, K). These results raise the intriguing possibility that sGAGs not only mediate Triplatin uptake but also serve as a predictive biomarker for patient treatment.
Figure 2. sGAG expression levels affect cellular accumulation, cytotoxicity, and tumor uptake of Triplatin.

A. Structures of Triplatin and carboplatin B. DFT optimized structure for the interaction of [Pt(NH3)4]2+, the central platinum of Triplatin, with sulfated monosaccharide, GlcNS(6S). C. Mutation and phenotype of GAG- and sulfation-deficient CHO carcinoma cell lines D. Quantification of the total cell surface sGAG levels in CHO cell lines using the Blyscan sGAG quantitation assay (n=5 biological replicates). E. Relative levels of N-sulfated HS (Ab 10E4) expression by flow cytometry. Histogram representative of 3 independent experiments. F. ICP-MS quantification of Triplatin and carboplatin cellular uptake. G-H. Analysis of cell proliferation after 15 min treatments with the indicated concentrations of Triplatin or carboplatin. % Confluence was quantified every 2 h for 210 h using live cell analysis (Incucyte). Each data point represents the mean ± SD (n=2 biological replicates with 4 technical replicates each). IC50 calculations are shown in G. I. Right panel, Image of a mouse injected with wt CHO and A475. Middle panel, IHC image of N-sulfated HS (Ab 10E4) expression in CHO wt and 745 tumors and staining were quantified (left panel). Each bar represents the mean ± SD (n=3). J, K. ICP-MS analysis of Pt tumor accumulation in CHO wt and A-745 tumors 24h after treatment with Triplatin (0.3 mg/kg; n=7) and carboplatin (40 mg/kg; n=10). Statistical analysis: D-F, One-way ANOVA, Tukey’s posttest; G unpaired student’s t-test; J and K, paired student’s t-test. *p<0.05, **p<0.01, ***p<0.001, ****p<0.0001.
Triplatin shows higher efficacy against sGAG-expressing tumors due to increased platinum accumulation.
The effectiveness of carboplatin and Triplatin was compared against primary tumor growth using the parental MDA-MB-231-luc mouse TNBC model. MDA-MB-231 tumors show high reactivity with the 10E4 antibody (H-score >200), comparable to that of the wild-type CHO tumors (Fig. 3A, B). To confirm the specificity of Ab 10E4 staining, the MDA-MB-231-luc tumor samples were incubated with heparinase III, which resulted in cleavage of the HS polymer and loss of the epitope against N-sulfated HS (Fig. 3A). To validate our hypothesis that Triplatin will be efficacious in tumor models with high levels of sGAGs, MDA-MB-231-luc cells were injected into the mammary gland of female NSG mice. Once tumors reached ~150 mm3, mice were randomized and treated with either saline (vehicle), Triplatin or carboplatin on days 1, 5, and 9 with day 1 being the day of randomization. As predicted, Triplatin was more effective than carboplatin at reducing tumor volume, tumor weight, and lung metastases in this model (Fig. 3C, D and S2A-B). The mice had weight loss during treatment but remained healthy overall and gained back weight after the end of treatment (S2C).
Figure 3. Triplatin inhibits tumor and metastatic growth in a high sGAG-expressing MDA-MB-231-luc model of TNBC.
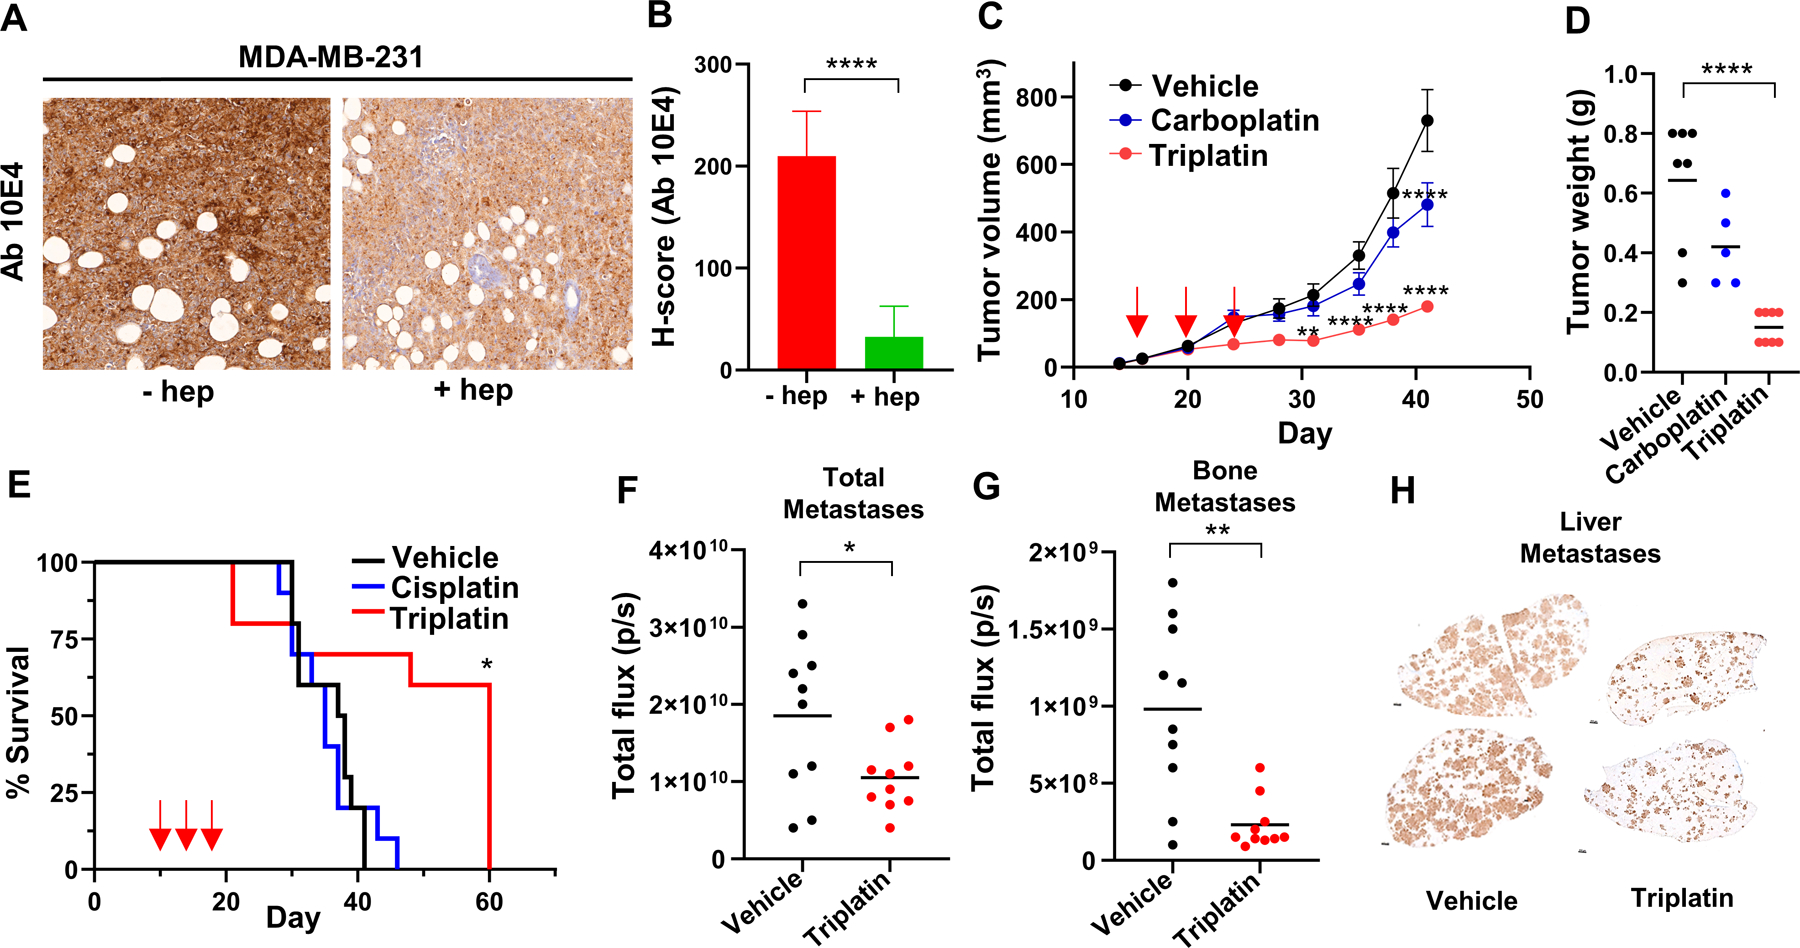
A. Representative images of IHC analysis of N-sulfated HS (Ab 10E4) reactivity in MDA-MB-231-luc tumors with or without heparinase III digestion. B. Quantitation of Ab 10E4 IHC (n=3). C. Analysis of primary tumor growth. Arrows, drug treatment [Triplatin (0.3mg/kg), carboplatin (40 mg/kg), or vehicle (saline)] given i.p. on days 1, 5, and 9 after randomization (day 16). D. Tumor weight at endpoint. E. Survival analysis: MDA-MB-231BR cells were injected into left ventricle of female NSG mice (day 0). Animals were randomized on day 10. Drug treatment [Triplatin (0.3mg/kg), cisplatin (3 mg/kg), or vehicle (saline)] given i.p. on days 1, 5 and 9 after randomization. F. Quantification of overall metastases in vivo on day 21 (total flux). G. Quantification of bone metastases ex vivo on day 21 (total flux). H. Quantification of liver metastases ex vivo on day 21 using HLA staining. Statistical analysis: B, F and G, student’s t-test; C, D and E, One-way ANOVA; Tukey’s posttest *p<0.05, **p<0.01, ***p<0.001, ****p<0.0001.
Since lower tumor burden can also result in decreased metastasis, we next determined the effect of Triplatin on metastatic growth using an intracardiac MDA-MB-231BR model of TNBC metastasis which allows analysis of Triplatin on inhibition of growth at metastatic sites seen in TNBC patients, e.g., the brain, bone, lung, and liver. Triplatin-treated mice gave marked increases in survival compared to control and cisplatin-treated mice (Fig. 3E). In an endpoint study, when all mice were sacrificed 21 days after cancer cell injection, total metastases and, especially, bone and liver metastases were dramatically reduced in mice treated with Triplatin compared to control mice (Fig. 3F-H, S3). Furthermore, the ability of Triplatin to directly inhibit lung metastases was evaluated using the syngeneic murine 4T1 mastectomy model (33). The 4T1-luc mouse-derived mammary cancer cell line injected into immune-intact mice mimics human cancer progression and metastasizes more efficiently than conventional human xenografts. The IHC analysis of 4T1 tumors grown orthotopically showed high Ab 10E4 staining (Fig. S4A), suggesting that this model will be sensitive to Triplatin. Indeed, we observed that Triplatin inhibited lung metastases that occurred after mastectomy (Fig. S4B-C) and significantly increased survival (Fig. S4D). Furthermore, 4T1 cells were intracardially injected into mice to mimic widespread metastasis. Mice treated with Triplatin had reduced metastases in the lungs and bone compared with carboplatin-treated mice and saline control (Fig. S5A-B). Together, these results show that Triplatin inhibits primary tumor growth and metastasis in carboplatin resistant TNBC models expressing high levels of sGAGs.
To confirm that sGAG levels play an important role in the efficacy of Triplatin in TNBC tumors, we generated XYLT1/2 knockout MDA-MB-231 cell lines using well characterized CRISPR plasmids as described (16). Created CRISPR clones KO-F and KO-G both possess Indels in Exon 3 of XYLT1 and Exon 2 of XYLT2, as determined by sanger sequencing (Fig. S6 A-B). These generated cell lines, MDA-MB-231 XYLT1/2 KO-F and KO-G, had >90% reduction in sGAG epitopes in comparison to both parental and control cells (Fig. 4A). Consistent with our model that high sGAG levels facilitate Triplatin accumulation, the MDA-MB-231 XYLT1/2 KO-F and KO-G cell lines had reduced uptake of Triplatin and showed higher uptake of carboplatin in vitro (Fig. 4B) compared to wt MDA-MB-231. Differences in Triplatin accumulation were also seen in vivo (Fig. 4C), similar to Triplatin accumulation in wt CHO K1 compared to CHO-pgsA-745 cells. These differences in accumulation did affect the efficacy of Triplatin. Wt MDA-MB-231 tumors had a higher percent of tumor growth inhibition (%TGI) when treated with Triplatin compared to vehicle than did the sGAG-deficient MDA-MB-231 XYLT1/2 KO-F and KO-G tumors (Fig. 4D). This difference translated to an increased survival benefit and effect size for the mice with wt MDA-MB-231 tumors (survival benefit 16.7 days, effect size 4.17) compared to those with the sGAG-deficient MDA-MB-231 XYLT1/2 KO-F and KO-G tumors (survival benefit 11 and 7 days and effect size 2.36 and 0.99, respectively) (Fig. 4E).
Figure 4. sGAG levels affect the survival benefit of Triplatin treatment.

A. Flow cytometry analysis shows levels of N-sulfated HS (Ab 10E4) in MDA-MB-231 XYLT1/2 KO cell lines is significantly decreased compared to wt and CRIPSR control MDA-MB-231 cells. B. ICP-MS quantification of Triplatin and carboplatin cellular uptake in vitro. C. ICP-MS analysis of Pt tumor accumulation in parental MDA-MB-231 tumors and MDA-MB-231 XYLT1/2 KO-F and KO-G tumors, 24 h after treatment with Triplatin (0.3 mg/kg). D, E. Comparison of % tumor growth inhibition (TGI) of MDA-MB-231 wt and MDA-MB-231 XYLT1/2 KO-F and KO-G tumors (D) and survival benefit (E) of female NSG mice treated with 0.3 mg/kg Triplatin given i.p. on days 1, 5 and 9 after randomization. Statistical analysis; A-B, One-way ANOVA, Tukey’s posttest. C, paired student’s t-test. D, Two-way ANOVA, Dunnett’s multiple comparison test E, Survival curve analysis, Log-rank (Mantel-Cox) test. *p<0.05, **p<0.01, ***p<0.001, ****p<0.0001. Effect size, Glass’s ∆ = mean difference between Triplatin and vehicle divided by the standard of deviation of the vehicle group.
The efficacy of Triplatin against TNBC PDX models correlates with sGAG levels.
Use of PDX models in preclinical studies correlates well with clinical response (34–36). Therefore, the efficacy of Triplatin was compared in TNBC PDX with high and low levels of sGAGs to test the hypothesis that PDX models with high levels of sGAG staining will be most responsive to Triplatin. We examined 3 PDX TNBC models, previously investigated for sensitivity to carboplatin – UCD52 (carboplatin-sensitive), WHIM30 (carboplatin-sensitive) and WHIM2 (carboplatin-resistant) (37–40). WHIM30 and WHIM2 had significantly higher sGAG levels compared to UCD52 (Fig 5A-B). WHIM30 primary tumor growth was significantly inhibited by Triplatin, and carboplatin compared to the control (Fig. 5C). Triplatin was more effective than carboplatin at inhibiting WHIM2 tumor growth (Fig. 5D), while carboplatin was more effective than Triplatin at inhibiting UCD52 primary tumor growth (Fig. 5E). These results indicate that the activity of Triplatin against primary tumor growth is correlated with sGAG levels in TNBC PDX tumors.
Figure 5. Triplatin efficacy against PDX TNBC primary tumor growth correlates with sGAG levels.

A IHC H-scores of Ab 10E4 reactivity in TNBC PDX tumors. H-scores expressed as mean ± SD (bars). Statistical significance evaluated by one-way ANOVA (n=3). B Representative images of Ab 10E4 IHC staining. Scale bar represents 50 µm. (C-E) Analysis of primary tumor growth; 1×10⁵ cells injected into the T4 mammary gland of female NSG mice. Animals randomized and injected i.p. Q4Dx3 with Triplatin (0.3mg/kg), carboplatin (40 mg/kg), or vehicle (saline). Tumor growth measured by caliper and IVIS imaging. Statistical analysis: two-way ANOVA (n=5). *p<0.05, **p<0.01, ***p<0.001, ****p<0.0001
The effects of Triplatin and carboplatin on metastatic growth of WHIM30, WHIM2, and UCD52 PDXs were further evaluated using an intracardiac injection model. As previously described, WHIM30 cells formed metastases in the lung and liver. Similar to the primary tumor study, Triplatin and carboplatin decreased metastatic burden overall (Fig. 6A-B) and specifically, in the liver (Fig. 6C, 6E) and the lung (Fig. 6D). WHIM2 cells formed metastases in the brain, lung, liver, and ovaries with the highest burden in the lung and ovaries. Triplatin, but not carboplatin, decreased metastatic burden overall (Fig. 6A-B); specifically, in the ovaries (Fig. 6C, 5F) and the lungs (Fig. 6D). UCD52 formed metastases in the lung, liver, and brain with the highest burden in the liver and brain, which were overall more sensitive to carboplatin than Triplatin (Fig. 6A-B). In specific organs, carboplatin inhibited metastases to the liver more efficiently than Triplatin (Fig. 6C-D), and only carboplatin inhibited brain metastatic growth (Fig. 6D). Taken together, these results demonstrate that Triplatin may be more effective than carboplatin in treatment of TNBC with high levels of sGAGs.
Figure 6. Efficacy of Triplatin against PDX TNBC metastatic growth correlates with sGAG levels.

WHIM30, WHIM2, or UCD52 PDX cells (5×10⁵) were injected into left ventricle of female NSG mice. Animals were randomized and injected i.p. Q4Dx3 with Triplatin (0.3mg/kg), carboplatin (40 mg/kg), or vehicle (saline). A Total metastases were imaged in vivo. B Total metastases were quantified for each model. C-D Tumors and organs were harvested for ex vivo imaging and quantified. E Light photographs of WHIM30 liver metastases. Visible metastases highlighted using false coloration. F Light photographs of WHIM2 ovary metastases. Statistical significance was determined by one-way ANOVA, Tukey’s posttest. *p<0.05, **p<0.01, ***p<0.001, ****p<0.0001
Discussion
Although numerous reports describe molecular characterizations of TNBC (including genetic mutations, copy number alterations and protein expression), quantitation of carbohydrate levels is generally omitted. However, a few pivotal studies have identified upregulation of HS and CS in BC compared to normal tissue, (Table 1). Gill et al, showed high expression of the HS 10E4 antibody epitope in clinical samples of BC and, in particular, TNBC (26). We applied this antibody to a TMA of TNBC PDX tumors and found distinct groups of low and high staining tumors. Tumors with H-scores >100 were predictive of Triplatin efficacy, even in models that were carboplatin-resistant.
The desirability of incorporating a platinum into treatment regimens stems from data suggesting that a high frequency of DNA damage repair defects renders TNBC particularly susceptible to DNA-modifying agents (9,41). Platinums exert their effect by creating DNA-drug lesions that inhibit DNA replication and induce cell death. The synergy of two different mechanisms that potentially induce DNA damage (platinums causing DNA damage and “BRCAness” with ineffective DNA damage repair), known as synthetic lethality, is the rationale for the potential benefit of platinums in this setting. Triplatin was originally developed to generate DNA lesions that are distinct from other platinums and less recognizable by DNA repair proteins. Indeed, the 1,4 DNA interstrand crosslinks produced by Triplatin, unlike the 1,2 intrastrand crosslinks produced by cisplatin/carboplatin, evade binding of high mobility group proteins and repair by the nucleotide excision repair machinery (42–44). The results shown here are consistent, in that Triplatin showed similar activity in high sGAG-expressing PDX models, WHIM30 (mtBRCA) and WHIM2 (wtBRCA), regardless of BRCA status, whereas carboplatin was markedly less effective in the WHIM2 model with wtBRCA (37,38). Together, these results suggest that the efficacy of Triplatin may be independent of BRCA status, although future studies with more BRCA mutational models will be needed.
The majority of TNBC patients in the US present with local or locally advanced (stage I-III) disease at the time of diagnosis. Patients who achieve pCR, defined as elimination of invasive cancer from the breast and lymph nodes, have excellent chances of recurrence-free survival. However, those with residual disease (RD) have a higher risk of relapse and poorer prognosis than other BC subtypes. Paradoxically, a subset of TNBC appears to be particularly chemosensitive, with 30–40% achieving pCR after NACT using standard anthracycline and taxane-based combinations. Four recent randomized trials, GeparSixto, CALGB 40603, Brightness and I-SPY 2, have investigated the addition of carboplatin to standard NACT regimens. On average, the pCR rate increased to 50–55% when carboplatin was included (7,31,45–47). These results were confirmed in the Keynote-522 trial and with the addition of pembrolizumab, the number of patients achieving pCR further increased to ~65% (7). Together, the results support adding platinum to NACT regimens in treatment of locally advanced TNBC, which may again be optimized in the context of BRCA status and/or homologous repair deficiencies (HRD).
The major advantage of NACT is the ability to immediately identify patients with chemotherapy-resistant disease who may benefit from second adjuvant therapy following surgery (48). Recent approval of capecitabine, an oral antimetabolite of 5-Flurouracil, resulted from the CREATE-X trial showing a significant improvement in the rate of recurrence-free survival at 5 years (69.8% in the capecitabine group vs 56.1% in the control group) (49). The ongoing EA1131 trial will challenge this success by comparing capecitabine directly with 6 cycles of carboplatin (7). Future studies profiling residual disease for markers of selective targeting agents, such as Triplatin, may further benefit patients with chemotherapy-resistant disease.
Patients who developed distant metastases during the course of their disease survive less than a year, underscoring the importance of developing more effective treatment of patients living with metastatic TNBC. Even with the addition of recent treatment options for metastatic TNBC, such as immunotherapy (nab-paclitaxel and atezolizumab) for PD-L1-positive tumors and carboplatin/PARP-inhibitors for BRCAness-positive tumors, the survival benefit is measured in months (7,9,50). For this reason, the inclusion of patients in ongoing trials evaluating new targeted agents and predictive biomarkers is typically encouraged. The results presented here find that Triplatin is effective at prolonging survival of mice with metastatic TNBC and inhibiting growth of TNBC cells at metastatic sites in TNBC with high levels of sGAGs in multiple models.
In light of our discovery that Triplatin cellular and tumor uptake is sGAG-dependent and increase efficacy is seen in tumors with higher levels of sGAGs, a reevaluation of the clinical potential of Triplatin in this context is warranted. The primary dose-limiting toxicities (DLT) of Triplatin were neutropenia and diarrhea. Using the recommended Phase II dosing schedule, 1.1 mg/m2 on d1 of a 28-day cycle, Triplatin had a manageable toxicity profile. Phase I trials showed objective responses in advanced metastatic BC; in combination with 5-FU (1 partial response, 3 stable disease/14) (51). Phase II clinical trials in cisplatin-relapsed ovarian cancer gave partial responses (5/28 patients), (44) and in several cases durable responses > 3 years (personal communication). In summary, these results show activity of Triplatin in TNBC tumors with high sGAG levels, regardless of BRCA status and carboplatin-resistance. Although the added toxicities of incorporating platinum into any regimens should be considered, the benefits may be substantial, especially in early stage cases showing resistance, residual disease after neoadjuvant therapy, and in the metastatic setting. Elevation of pCR rate is expected to significantly improve patient survival.
Supplementary Material
Acknowledgements
We thank Dr. Jeff Esko for the CHO-F17 mutant cell line and Dr. Harry Bear for the use of 4T1 tumor samples for IHC. The lentivirus stocks have been generated by Gene Editing, Transduction and Nanotechnology Core, Skin Biology & Disease Resource-Based Center, Northwestern University supported in part by the NIH-NCI Cancer Center Support Grant (P30 CA060553). Services in support of the research project were provided by the Virginia Commonwealth University Massey Cancer Center Flow Cytometry Core, Cancer Mouse Models Core Laboratory, and Microscopy Facility supported, in part, with funding to the Massey Cancer Center from NIH-NCI Cancer Center Support Grant P30 CA016059. This work was supported by the Massey Cancer Center Molecules to Medicine Initiative, Commonwealth Health Research Board (CHRB 236–05-17), Commonwealth Research Commercialization Fund (MF17–028-LS) and Value and Efficiency Teaching and Research Initiative (VETAR, School of Medicine, VCU). National Institutes of Health Grant R01CA160688 to KT. National Cancer Institute (NCI) Grants P30CA016056 and U24CA232979, involving the use of Roswell Park Comprehensive Cancer Center’s Shared Resources for KT and EK.
Footnotes
Conflict of Interest Statement: The authors declare no potential conflicts of interest.
References
- 1.Cardoso F, Senkus E, Costa A, Papadopoulos E, Aapro M, André F, et al. 4th ESO–ESMO International Consensus Guidelines for Advanced Breast Cancer (ABC 4) These guidelines were developed by the European School of Oncology (ESO) and the European Society for Medical Oncology (ESMO). Ann. Oncol 2018; 1;29(8):1634–57. [DOI] [PMC free article] [PubMed] [Google Scholar]
- 2.Bevers TB, Anderson BO, Bonaccio E, Buys S, Daly MB, Dempsey PJ, et al. Breast Cancer Screening and Diagnosis. J. Natl. Compr. Canc. Ne 2009; 1;7(10):1060–96. [DOI] [PubMed] [Google Scholar]
- 3.Waks AG, Winer EP. Breast Cancer Treatment: A Review. JAMA 2019; 22;321(3):288–300. [DOI] [PubMed] [Google Scholar]
- 4.Schmid P, Cortes J, Pusztai L, McArthur H, Kümmel S, Bergh J, et al. Pembrolizumab for Early Triple-Negative Breast Cancer. N. Engl. J. Med 2020; 27;382(9):810–21. [DOI] [PubMed] [Google Scholar]
- 5.Bardia A, Hurvitz SA, Tolaney SM, Loirat D, Punie K, Oliveira M,et al. Sacituzumab govitecan in metastatic triple-negative breast cancer. N. Engl. J. Med 2021; 22;384(16):1529–41. [DOI] [PubMed] [Google Scholar]
- 6.Schmid P, Adams S, Rugo HS, Schneeweiss A, Barrios CH, Iwata H, et al. Atezolizumab and Nab-Paclitaxel in Advanced Triple-Negative Breast Cancer. N. Engl. J. Med 2018; 29;379(22):2108–21. [DOI] [PubMed] [Google Scholar]
- 7.Garufi G, Palazzo A, Paris I, Orlandi A, Cassano A, Tortora G, et al. Neoadjuvant therapy for triple-negative breast cancer: potential predictive biomarkers of activity and efficacy of platinum chemotherapy, PARP- and immune-checkpoint-inhibitors. Expert. Opin. Pharmaco 2020; 12;21(6):687–99. [DOI] [PubMed] [Google Scholar]
- 8.Tokumaru Y, Joyce D, Takabe K. Current status and limitations of immunotherapy for breast cancer. J. Surg 2020; 167:628–30. [DOI] [PMC free article] [PubMed] [Google Scholar]
- 9.Tutt A, Tovey H, Cheang MCU, Kernaghan S, Kilburn L, Gazinska P, et al. Carboplatin in BRCA1/2-mutated and triple-negative breast cancer BRCAness subgroups: the TNT Trial. Nat. Med 2018; 24(5):628. [DOI] [PMC free article] [PubMed] [Google Scholar]
- 10.Tokumaru Y, Oshi M, Katsuta E, Yan L, Satyananda V, Matsuhasi N, et al. KRAS signaling enriched triple negative breast cancer is associated with favorable tumor immune microenvironment and better survival. Am. J. Cancer Res 2020; 10(3):897–907. [PMC free article] [PubMed] [Google Scholar]
- 11.Zhang F, Zhang Z, Linhardt RJ. Chapter 3 - Glycosaminoglycans. In: Cummings RD, Pierce JM, editors. Handbook of Glycomics San Diego: Academic Press; 2010; p. 59–80. [Google Scholar]
- 12.Fuster MM, Esko JD. The sweet and sour of cancer: glycans as novel therapeutic targets. Nat. Rev. Cancer 2005; 5(7):526–42. [DOI] [PubMed] [Google Scholar]
- 13.Afratis N, Gialeli C, Nikitovic D, Tsegenidis T, Karousou E, Theocharis AD, et al. Glycosaminoglycans: key players in cancer cell biology and treatment. The FEBS Journal 2012; 279(7):1177–97. [DOI] [PubMed] [Google Scholar]
- 14.Silva H, Frézard F, Peterson EJ, Kabolizadeh P, Ryan JJ, Farrell NP. Heparan Sulfate Proteoglycan-Mediated Entry Pathway for Charged Tri-Platinum Compounds: Differential Cellular Accumulation Mechanisms for Platinum. Mol. Pharm 2012; 9(6):1795–802. [DOI] [PMC free article] [PubMed] [Google Scholar]
- 15.Peterson EJ, Daniel AG, Katner SJ, Bohlmann L, Chang C-W, Bezos A, et al. Antiangiogenic platinum through glycan targeting. Chem. Sci 2017; 8(1):241–52. [DOI] [PMC free article] [PubMed] [Google Scholar]
- 16.Qu Y, Kipping RG, and Farrell NP. Solution Studies on DNA Interactions of Substitution-inert Platinum Complexes mediated via The Phosphate Clamp. J. Chem. Soc. Dalton Trans 2015; 44: 3563–3572. [DOI] [PMC free article] [PubMed] [Google Scholar]
- 17.Narimatsu Y, Joshi HJ, Yang Z, Gomes C, Chen Y-H, Lorenzetti FC, et al. A validated gRNA library for CRISPR/Cas9 targeting of the human glycosyltransferase genome. Glycobiology 2018;28:295–305. [DOI] [PubMed] [Google Scholar]
- 18.Sunshine JC, Nguyen PL, Kaunitz GJ, Cottrell TR, Berry S, Esandrio J, et al. PD-L1 Expression in Melanoma: A Quantitative Immunohistochemical Antibody Comparison. Clin. Cancer Res 2017; 15;23(16):4938–44. [DOI] [PMC free article] [PubMed] [Google Scholar]
- 19.Rehman JA, Han G, Carvajal-Hausdorf DE, Wasserman BE, Pelekanou V, Mani NL, et al. Quantitative and pathologist-read comparison of the heterogeneity of programmed death-ligand 1 (PD-L1) expression in non-small cell lung cancer. Mod. Pathol 2017;30(3):340–9. [DOI] [PMC free article] [PubMed] [Google Scholar]
- 20.Parra ER, Villalobos P, Zhang J, Behrens C, Mino B, Swisher S, et al. Immunohistochemical and Image Analysis-Based Study Shows That Several Immune Checkpoints are Co-expressed in Non-Small Cell Lung Carcinoma Tumors. J. Thorac. Oncol 2018;13(6):779–91. [DOI] [PubMed] [Google Scholar]
- 21.Nakase I, Konishi Y, Ueda M, Saji H, Futaki S. Accumulation of arginine-rich cell-penetrating peptides in tumors and the potential for anticancer drug delivery in vivo. J. Control. Release 2012; 30;159(2):181–8. [DOI] [PubMed] [Google Scholar]
- 22.Harrell JC, Dye WW, Allred DC, Jedlicka P, Spoelstra NS, Sartorius CA, et al. Estrogen receptor positive breast cancer metastasis: altered hormonal sensitivity and tumor aggressiveness in lymphatic vessels and lymph nodes. Cancer Res 2006; 15;66(18):9308–15. [DOI] [PubMed] [Google Scholar]
- 23.Puchalapalli M, Zeng X, Mu L, Anderson A, Hix Glickman L, Zhang M, et al. NSG Mice Provide a Better Spontaneous Model of Breast Cancer Metastasis than Athymic (Nude) Mice. PLoS ONE 2016; 11(9):e0163521. [DOI] [PMC free article] [PubMed] [Google Scholar]
- 24.Weyers A, Yang B, Yoon DS, Park JH, Zhang F, Lee KB, et al. A structural analysis of glycosaminoglycans from lethal and nonlethal breast cancer tissues: toward a novel class of theragnostics for personalized medicine in oncology? OMICS 2012; 16(3):79–89. [DOI] [PMC free article] [PubMed] [Google Scholar]
- 25.Singh V, Jha KK, M JK, Kumar RV, Raghunathan V, Bhat R. Iduronate-2-Sulfatase-Regulated Dermatan Sulfate Levels Potentiate the Invasion of Breast Cancer Epithelia through Collagen Matrix. J. Clin. Med 2019; 8(10). [DOI] [PMC free article] [PubMed] [Google Scholar]
- 26.Gill RM, Mehra V, Milford E, Dhoot GK. Short SULF1/SULF2 splice variants predominate in mammary tumours with a potential to facilitate receptor tyrosine kinase-mediated cell signalling. J. Histochem. Cell. Biol 2016; 146(4):431–44. [DOI] [PubMed] [Google Scholar]
- 27.Guo C-H, Koo C-Y, Bay B-H, Tan P-H, Yip GW. Comparison of the effects of differentially sulphated bovine kidney- and porcine intestine-derived heparan sulphate on breast carcinoma cellular behaviour. Int. J. Oncol 2007; 31(6):1415–23. [PubMed] [Google Scholar]
- 28.Koo C-Y, Bay B-H, Lui PC-W, Tse GM-K, Tan P-H, Yip GW-C. Immunohistochemical expression of heparan sulfate correlates with stromal cell proliferation in breast phyllodes tumors. Mod. Pathol 2006; 19(10):1344–50. [DOI] [PubMed] [Google Scholar]
- 29.Sembajwe LF, Katta K, Grønning M, Kusche-Gullberg M. The exostosin family of glycosyltransferases: mRNA expression profiles and heparan sulphate structure in human breast carcinoma cell lines. Biosci Rep 2018; 38(4). [DOI] [PMC free article] [PubMed] [Google Scholar]
- 30.Svensson KJ, Christianson HC, Kucharzewska P, Fagerström V, Lundstedt L, Borgquist S, et al. Chondroitin sulfate expression predicts poor outcome in breast cancer. Int. J.Oncol 2011; 1;39(6):1421–8. [DOI] [PubMed] [Google Scholar]
- 31.Salanti A, Clausen TM, Agerbæk MØ, Al Nakouzi N, Dahlbäck M, Oo HZ, et al. Targeting Human Cancer by a Glycosaminoglycan Binding Malaria Protein. Cancer Cell 2015; 12;28(4):500–14. [DOI] [PMC free article] [PubMed] [Google Scholar]
- 32.Gorle AK, Rajaratnam P, Chang C-W, von Itzstein M, Berners-Price SJ, Farrell NP. Glycans as Ligands in Bioinorganic Chemistry. Probing the Interaction of a Trinuclear Platinum Anticancer Complex with Defined Monosaccharide Fragments of Heparan Sulfate. Inorg. Chem 2019; 58(11):7146–55. [DOI] [PubMed] [Google Scholar]
- 33.Katsuta E, Rashid OM, Takabe K. Murine breast cancer mastectomy model that predicts patient outcomes for drug development. J. Surg. Res 2017; 219:310–8. [DOI] [PMC free article] [PubMed] [Google Scholar]
- 34.Zhang X, Lewis MT. Establishment of Patient-Derived Xenograft (PDX) Models of Human Breast Cancer. Curr. Protoc. Mouse Biol 2013; 3(1):21–9. [DOI] [PubMed] [Google Scholar]
- 35.Fiebig HH, Neumann HA, Henss H, Koch H, Kaiser D, Arnold H. Development of three human small cell lung cancer models in nude mice. Recent Results Cancer Res 1985; 97:77–86. [DOI] [PubMed] [Google Scholar]
- 36.Gao H, Korn JM, Ferretti S, Monahan JE, Wang Y, Singh M, et al. High-throughput screening using patient-derived tumor xenografts to predict clinical trial drug response. Nat. Med 2015; 21(11):1318–25. [DOI] [PubMed] [Google Scholar]
- 37.Turner TH, Alzubi MA, Sohal SS, Olex AL, Dozmorov MG, Harrell JC. Characterizing the efficacy of cancer therapeutics in patient-derived xenograft models of metastatic breast cancer. Breast cancer Res and TR 2018 [DOI] [PubMed] [Google Scholar]
- 38.Turner TH, Alzubi MA, Harrell JC. Identification of synergistic drug combinations using breast cancer patient-derived xenografts. Sci. Rep 2020; 10:1493. [DOI] [PMC free article] [PubMed] [Google Scholar]
- 39.Alzubi MA, Sohal SS, Sriram M, Turner TH, Zot P, Idowu M, et al. Quantitative assessment of breast cancer liver metastasis expansion with patient-derived xenografts. Clin. Exp. Metastas 2019; 36:257–69. [DOI] [PubMed] [Google Scholar]
- 40.Alzubi MA, Turner TH, Olex AL, Sohal SS, Tobin NP, Recio SG, et al. Separation of breast cancer and organ microenvironment transcriptomes in metastases. Breast Cancer Res 2019; 21:36. [DOI] [PMC free article] [PubMed] [Google Scholar]
- 41.Loibl S, Weber KE, Timms KM, Elkin EP, Hahnen E, Fasching PA, et al. Survival analysis of carboplatin added to an anthracycline/taxane-based neoadjuvant chemotherapy and HRD score as predictor of response—final results from GeparSixto. Ann. Oncol 2018; 1;29(12):2341–7. [DOI] [PubMed] [Google Scholar]
- 42.Kasparkova J, Zehnulova J, Farrell N, Brabec V. DNA Interstrand Cross-links of the Novel Antitumor Trinuclear Platinum Complex BBR3464: Conformation, recognition by high mobility group domain proteins, and nucleotide excision repair. J. Biol. Chem 2002; 13;277(50):48076–86. [DOI] [PubMed] [Google Scholar]
- 43.Zehnulova J, Kasparkova J, Farrell N, Brabec V. Conformation, Recognition by High Mobility Group Domain Proteins, and Nucleotide Excision Repair of DNA Intrastrand Cross-links of Novel Antitumor Trinuclear Platinum Complex BBR3464. J. Biol. Chem 2001; 22;276(25):22191–9. [DOI] [PubMed] [Google Scholar]
- 44.Farrell NP. Multi-platinum anti-cancer agents. Substitution-inert compounds for tumor selectivity and new targets. Chem. Soc. Rev 2015; 44(24):8773–85. [DOI] [PubMed] [Google Scholar]
- 45.Pandy JGP, Balolong-Garcia JC, Cruz-Ordinario MVB, Que FVF. Triple negative breast cancer and platinum-based systemic treatment: a meta-analysis and systematic review. BMC Cancer 2019; 19(1):1065. [DOI] [PMC free article] [PubMed] [Google Scholar]
- 46.Park JH, Ahn J-H, Kim S-B. How shall we treat early triple-negative breast cancer (TNBC): from the current standard to upcoming immuno-molecular strategies. ESMO Open 2018; 3(Suppl 1):e000357. [DOI] [PMC free article] [PubMed] [Google Scholar]
- 47.Sikov WM, Berry DA, Perou CM, Singh B, Cirrincione CT, Tolaney SM, et al. Impact of the Addition of Carboplatin and/or Bevacizumab to Neoadjuvant Once-per-Week Paclitaxel Followed by Dose-Dense Doxorubicin and Cyclophosphamide on Pathologic Complete Response Rates in Stage II to III Triple-Negative Breast Cancer: CALGB 40603 (Alliance). J. Clin. Oncol 2015; 1;33(1):13–21. [DOI] [PMC free article] [PubMed] [Google Scholar]
- 48.Kennedy WR, Tricarico C, Gabani P, Weiner AA, Altman MB, Ochoa LL, et al. Predictors of Distant Metastases in Triple-Negative Breast Cancer Without Pathologic Complete Response After Neoadjuvant Chemotherapy. J. Natl. Compr. Canc. NE 2020; 1;18(3):288–96. [DOI] [PubMed] [Google Scholar]
- 49.Masuda N, Lee S-J, Ohtani S, Im Y-H, Lee E-S, Yokota I, et al. Adjuvant Capecitabine for Breast Cancer after Preoperative Chemotherapy. N. Eng. J. Med 2017; 1;376(22):2147–59. [DOI] [PubMed] [Google Scholar]
- 50.Caparica R, Lambertini M, Azambuja E de. How I treat metastatic triple-negative breast cancer. ESMO Open 2019; 1;4(Suppl 2):e000504. [DOI] [PMC free article] [PubMed] [Google Scholar]
- 51.Gourley C, Cassidy J, Edwards C, Samuel L, Bisset D, Camboni G, et al. A phase I study of the trinuclear platinum compound, BBR 3464, in combination with protracted venous infusional 5-fluorouracil in patients with advanced cancer. Cancer. Chemother. Pharmacol 2004; 53(2):95–101. [DOI] [PubMed] [Google Scholar]
Associated Data
This section collects any data citations, data availability statements, or supplementary materials included in this article.