Abstract
Purpose:
Phantoms are a basic tool for assessing and verifying performance in CT research and clinical practice. Patient-based realistic lung phantoms accurately representing textures and densities are essential in developing and evaluating novel CT hardware and software. This study introduces PixelPrint, a 3D printing solution to create patient-based lung phantoms with accurate attenuation profiles and textures.
Methods:
PixelPrint, a software tool, was developed to convert patient digital imaging and communications in medicine (DICOM) images directly into FDM printer instructions (G-code). Density was modeled as the ratio of filament to voxel volume to emulate attenuation profiles for each voxel, with the filament ratio controlled through continuous modification of the printing speed. A calibration phantom was designed to determine the mapping between filament line width and Hounsfield units (HU) within the range of human lungs.For evaluation of PixelPrint, a phantom based on a single human lung slice was manufactured and scanned with the same CT scanner and protocol used for the patient scan. Density and geometrical accuracy between phantom and patient CT data were evaluated for various anatomical features in the lung.
Results:
For the calibration phantom, measured mean HU show a very high level of linear correlation with respect to the utilized filament line widths, (r > 0.999). Qualitatively, the CT image of the patient-based phantom closely resembles the original CT image both in texture and contrast levels (from −800 to 0 HU), with clearly visible vascular and parenchymal structures. Regions of interest comparing attenuation illustrated differences below 15 HU. Manual size measurements performed by an experienced thoracic radiologist reveal a high degree of geometrical correlation of details between identical patient and phantom features, with differences smaller than the intrinsic spatial resolution of the scans.
Conclusion:
The present study demonstrates the feasibility of 3D-printed patient-based lung phantoms with accurate organ geometry, image texture, and attenuation profiles. PixelPrint will enable applications in the research and development of CT technology, including further development in radiomics.
Keywords: 3D printing, computed tomography, image quality, lung, quality assurance, radiomics
1 |. INTRODUCTION
Anthropomorphic phantoms, geometric image quality phantoms, and mathematical phantoms are fundamental tools for developing, optimizing, and evaluating novel methods in computed tomography (CT) research and clinical practice. Common CT phantoms are typically manufactured by casting, forming, and molding homogenous materials such as resin or plastic. While many different phantoms are available commercially and in research laboratories, there is a lack of patient-based phantoms that fully represent attenuation profiles and textures seen in clinical CT acquisitions, for example, for healthy and diseased lungs. Additionally, the academic and clinical CT community would benefit from a rapid and inexpensive manufacturing process compared to current commercial solutions.
Over the last decade, fused deposition modeling (FDM)-based three-dimensional (3D) printing of various tissue-mimicking phantoms has been widely explored for validation and evaluation of CT imaging technology.1–6 Studies have focused on several areas, including manufacturing geometrically correct models of organs,7–11 generating realistic texture samples,12–14 and creating accurate attenuation profiles.15–18 In order to create variable densities in 3D-printed phantoms, novel techniques have been proposed, and they were thoroughly reviewed2,5,19: these approaches include applying different infill patterns,20 varying extrusion rates voxel wise,17,18 or interlacing multiple materials with dual-extrusion printers.21 Often, general procedures10,19,22–25 to 3D print an anthropomorphic phantom from CT image data include: (i) segmentation of regions/organs of interest in CT images, (ii) conversion of selected regions from volumetric data to triangulated surface geometry models (e.g., STL or SLA files), and (iii) use of printer-specific slicing software to apply proper parameters (e.g., extrusion rate, print speed, and infill ratios) and generate instructions (G-code) for printers to create 3D products. While this approach produces phantoms that better resemble true anatomical structures, it still has shortcomings. First, spatial resolution is largely lost due to segmentation of regions and conversion to surface models, which may result in the loss of isolated small areas. Second, for each region/surface model, the slicer software assigns unique infill and exterior walls (or perimeters), creating abrupt, unrealistic transitions between regions of different densities in the final product.
A promising alternative is to directly translate digital imaging and communications in medicine (DICOM) image data into G-code.17,18 To generate different densities in 3D-printed CT phantoms, these methods utilize a pixel-by-pixel change in the filament extrusion rate per unit time while maintaining a constant printing speed. This approach enables the generation of sophisticated phantoms with realistic attenuation profiles, for example, it was very successfully illustrated for patient-based chest and skull phantoms with feature above 0 HU. To the best of our knowledge, it has not been demonstrated for lung features below 0 HU. In the works from Okkalidis et al., edge detection and morphological operations were used to enhance and separate organs, so as to assign densities inside them.17,18 Such processes could still yield segmentation errors and loss of small features. This reduction in spatial resolution is an important concern when generating natural image textures such as inside the human lung. Therefore, there is a need for a cost-efficient process for generating lung patient-based phantoms with accurate organ geometry, image texture, and attenuation profiles.
We propose a 3D printing solution that is capable of achieving accurate organ geometry, image texture, and attenuation profiles while eliminating the complexities and limitations of previous methods. Our solution is a one-step method for translating CT images into printer instructions (G-code) that can be used by any FDM 3D printer. It combines varying printer speeds with a constant filament extrusion rate per unit time to control the density of each printed voxel. In the following sections, we present a complete description of the proposed method, as well as results from successful proof-of-principle experiments with geometrical and patient-based lung phantoms.
2 |. MATERIALS AND METHODS
2.1 |. PixelPrint
Conventional 3D printing utilizes slicing software to convert 3D models (e.g., STL files) to printer instructions written in G-code, a widely used machine language defining 3D printing parameters (e.g.,layer height, retraction, and print speed). We present a solution that accepts volumetric CT DICOM data as input and converts these data directly into G-code without segmentation or intermediate 3D models.
Applied to common FDM 3D printers, PixelPrint produces multiple 2D layers, one layer at a time, to create 3D objects or phantoms. Each printed layer is mapped from the corresponding DICOM slice, with the physical scale controlled to ensure that the resulting phantom has the same dimensions as the scanned patient. For each layer in the 3D-printed phantom, PixelPrint generates an array of spaced, parallel filament lines. The lines are at fixed spacing but consist of intervals of varying widths, creating a partial volume effect to form changing densities in the final CT slice. The width of each printed line changes between intervals: wider widths in high-density areas and narrower widths in low-density areas. For example, in this work, line widths can vary between 1.0 and 0.1 mm corresponding to infill ratios between 100% and 10%. The ratio of the filament occupying a given unit volume is defined as the infill ratio. PixelPrint computes the density of the input image at closely spaced intervals along each line and maps it into the appropriate extrusion and printhead speeds over each interval. On this note, intervals can include single or consecutive voxels of equal density in the original DICOM image. PixelPrint then records one G-code command that defines a starting point, an endpoint, the filament extrusion, and speed for that interval. This process is repeated for every interval over every line, in every layer, until the whole phantom is fully encoded in a G-code file. Filament lines in adjacent layers are arranged in alternating directions (90-degree rotations) and positions so that the layers are not repeated, and the varying line widths create a two-dimensional matrix of high- and low-density regions that correlate with the original 3D input image volume. The printed layer height is much smaller than the typical CT slice thickness. Each CT slice of the printed phantom will therefore contain multiple layers, ensuring that reslicing of the CT image data will not result in sampling or moiré patterns.
In our experiments, we found that altering the line width by varying the extrusion rate alone does not provide sufficient spatial resolution due to the inherently slow response time of the extrusion process.Instead,we maintain a constant filament flow rate per unit time while changing the speed of the printhead to control the extrusion width. For printing the finest line, the printer head moves at the highest speed. Thus, the printhead speed is inversely proportional to the expected extruded line width.
To summarize PixelPrint, based on the phantoms presented in this study: the printer nozzle size is 0.25 mm, and the printed line intervals have widths ranging from 0.1 to 1.0 mm. Note, although it is not standard practice to print 1.0 mm wide lines with a 0.25 mm nozzle in conventional 3D printing, we have found that, given the very slow speeds PixelPrint uses for wide lines, the extruded lines are smooth and well controlled. Further, for the finest line/interval (0.1 mm/10% infill ratio), the printer moves as fast as possible (30 mm/s) and the layer height is 0.2 mm. The extruded volumetric rate (filament usage) is 0.6 mm3/s. For the widest line/interval, 1.0 mm (100% infill ratio) at the same layer height of 0.2 mm, the printer moves at only 3 mm/s, also resulting in a volumetric rate of 0.6 mm3/s.
2.2 |. Phantom design
2.2.1 |. Calibration phantom
The partial volume effect created by varying the filament line width with fixed-line spacing determines the (local) mean material density and thus the x-ray attenuation in a CT scan. A calibration phantom was designed to determine the mapping between filament line widths and Hounsfield units (HU) within the range of human lungs. A multi-sector phantom (cylinder divided into radial slices) with a diameter of 100 mm and a height of 10 mm was designed. The phantom comprises 10 sections with different material densities, or infill ratios, from 10% to 100% at 10% intervals (Figure 1). The whole phantom was printed as a single object via PixelPrint. CT measurements of this phantom were used to determine the 3D-printed maximum and minimum HU, as well as the conversion between HU and filament line widths for patient-based phantoms.
FIGURE 1.
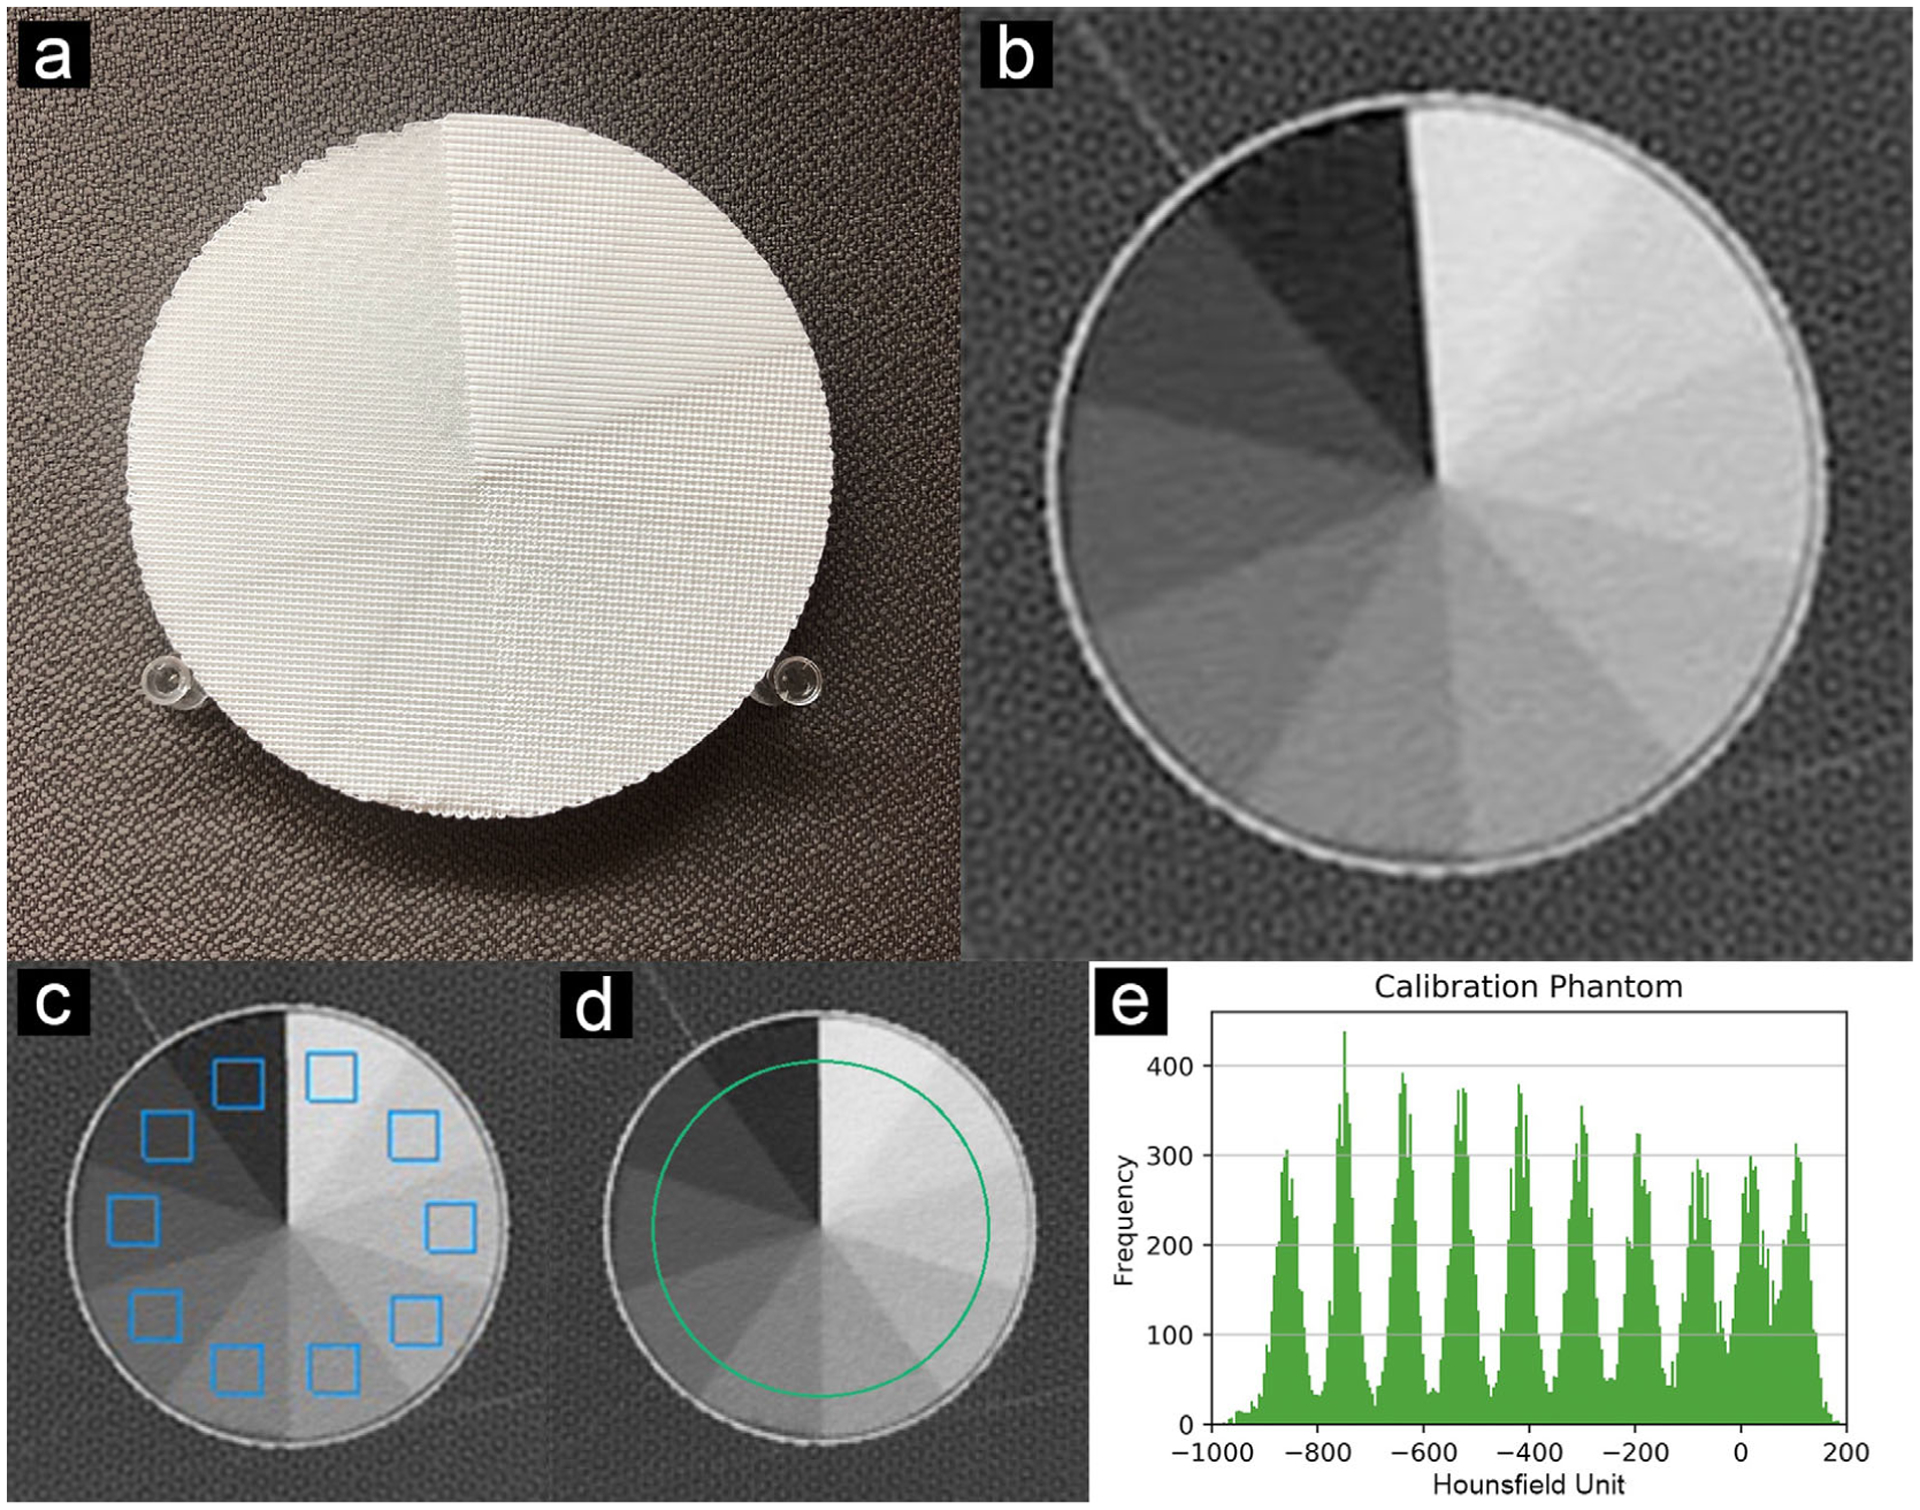
Calibration phantom. (a) Photo of the multi-sector calibration phantom. (b) CT slice of the phantom. (c) ROIs (blue squares, width 11 mm) used to evaluate the HU for Figure 2. (e) Histogram of green circular region in (d). Data were acquired as reported in Table 1 (CTDIvol 12.5 mGy). All ROI measurements are applied in five adjacent slices. Window level is −400 HU. Window width is 1500 HU
2.2.2 |. Patient-based phantom
The Institutional Review Board (IRB) approved this retrospective study. A single data set of a patient who had been diagnosed with COVID-19 pneumonia and acute respiratory distress syndrome (ARDS) was selected from the PACS system at the Hospital of the University of Pennsylvania and anonymized. The CT images demonstrate extensive fibro-proliferative changes with both interstitial and alveolar components throughout the lung parenchyma. Imaging was performed in the supine position on a dual-source CT scanner (Somatom Drive, Siemens Healthineers, Erlangen, Germany). Table 1 presents acquisition and reconstruction parameters utilized for imaging. Since this proof-of-principle study focuses on lung imaging, the right lung was selected as input to reduce printing time and complexity. We selected a single CT slice of 1 mm thickness. A 10 mm high volume was generated by stacking 10 copies of the 1 mm slice. A 20 cm diameter circular region was selected from the single CT slice of the patient. A support wall was added for better positioning of the phantom within the bore of a 300 × 400 mm2 oval phantom representing a medium-sized patient (see details below). HU values were converted into filament line widths using the mapping calculated from the calibration phantom described above. A lower cut-off value of 10% and an upper cap of 100% material density were applied. Ten percent is the lowest infill ratio the FDM printer is capable of consistently and accurately producing in the current PixelPrint implementation. The phantom is shown in Figure 3.
TABLE 1.
Scan protocol for the patient-based phantom
| Scanner model | Siemens SOMATON drive |
|---|---|
| Tube voltage | 100 kVp (single source mode) |
| Tube current (at slice position) | 292 mA |
| Rotation time | 0.5 s |
| Spiral pitch factor | 1.2 |
| Exposure (at slice position) | 121 mAs |
| CTDIvol (at slice position) | 4.54 mGy |
| Collimation width (single/total) | 0.6/38.4 mm |
| Slice thickness | 1 mm |
| Reconstruction filter | Br49f(3) (diagnostic lung filter with iterative reconstruction ADMIRE level 3) |
| Reconstructed field of view | 404 × 404 mm2 |
| Matrix size | 512 × 512 pixel2 |
| Pixel spacing (in x and y) | 0.79 mm |
FIGURE 3.
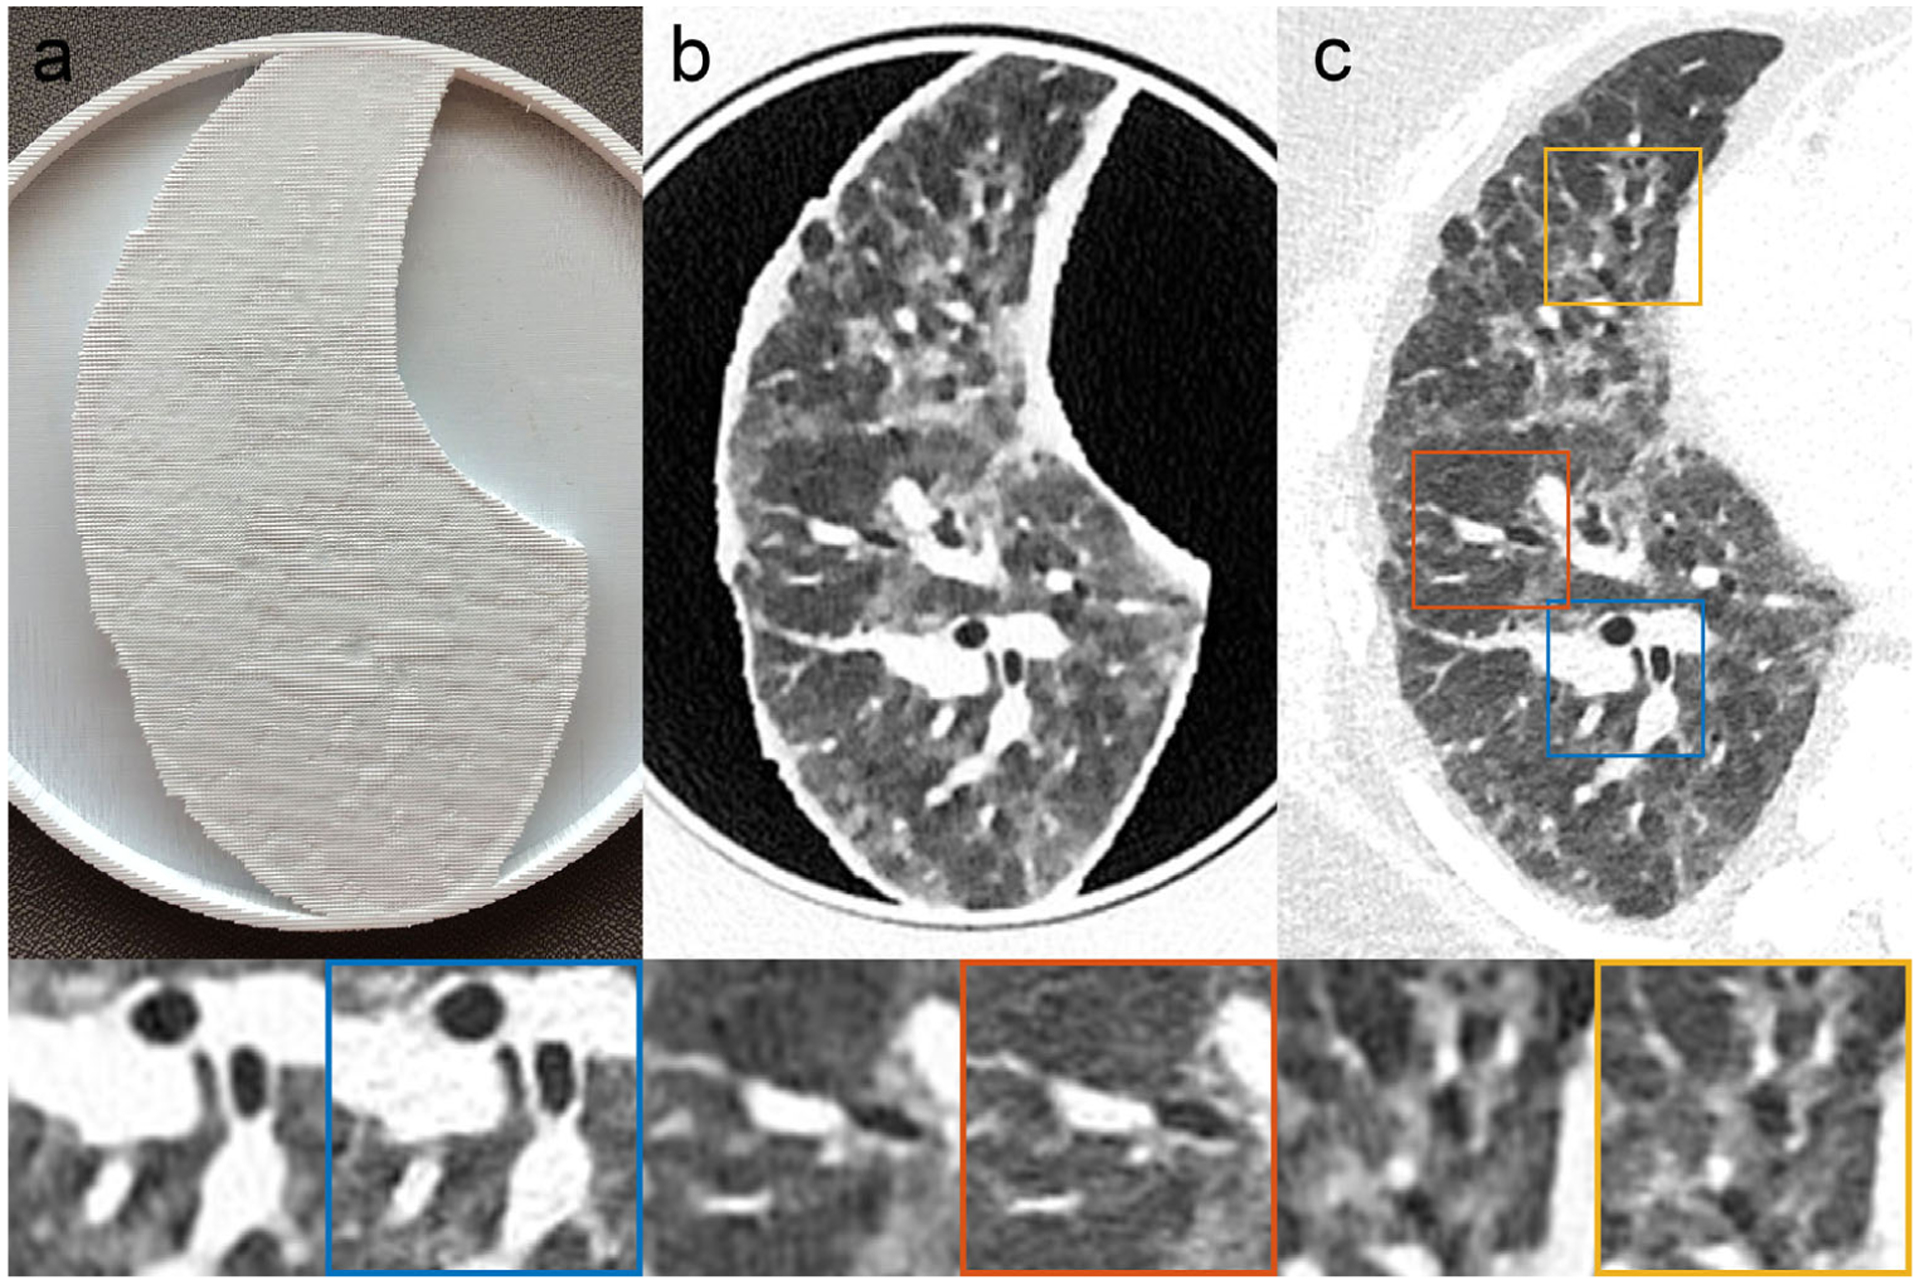
Patient-based Lung Phantom visually highly resembles the original CT image both in texture and contrast levels. (a) Photography of the printed patient-based phantom. (b) CT image of patient-based phantom. (c) CT image of patient lung. Yellow, red and blue boxes indicate zoomed-in regions of the patient DICOM image. Window level is −500 HU. Window width is 1000 HU
2.3 |. Phantom production
Phantoms were printed on a fused-filament 3D printer (Lulzbot TAZ 6 with M175 tool head, Fargo Additive Manufacturing Equipment 3D, LLC Fargo, ND, USA) using a 0.25 mm brass nozzle. Polylactic acid (PLA) filament with a diameter of 1.75 mm (MakeShaper, Keene Village Plastics, Cleveland, OH, USA) was extruded at a nozzle temperature of 210°C. To improve adhesion, the build plate was heated to 50°C.Printing speed varied from 3.0 to 30 mm/s with a constant volumetric rate of 0.6 mm3/s, producing line widths from 1.0 to 0.1 mm. The acceleration was 500 mm/s2,and the jerk setting (or acceleration threshold) was 8 mm/s. The height of each printed layer is 0.2 mm.
2.4 |. Data acquisition and analysis
For imaging, printed phantoms were placed inside the 20 cm bore of a technical phantom (Gammex multi-energy CT phantom, Sun Nuclear Corporation, Melbourne, FL, USA) to mimic attenuation profiles of an average-sized patient (300 × 400 mm2). Imaging was performed with the same CT scanner using the same protocol as the clinical acquisition (Table 1).
The scan of the multi-sector calibration phantom was performed with a higher tube current (800 mA) to reduce the effects of Poisson noise. The estimated CTDIvol was 12.5 mGy. Ten regions of interest (ROI) with a fixed size of 14 × 14 pixels (11 × 11 mm2) on five consecutive CT slices at the center of the phantom were manually placed to calculate HU statistics within the 10 sectors of 10% to 100% material densities. Mean HU values and standard deviations were measured, and Pearson’s correlation coefficient was calculated using linear regression. A histogram was computed using a ROI of radius 50 pixels (40 mm) from five slices (5 mm) (see Figure 1).
The scan of the patient-based phantom was performed with the same radiation dose level used for the patient scan (CTDIvol of 4.54 mGy at slice position). To investigate reproducibility, the scan was repeated five times. The resulting images were exported and registered to the original patient image using an affine transform available with the OpenCV library.26 Five ROIs of different sizes in varied locations were manually placed in the vessel and parenchymal areas by an experienced thoracic radiologist (Leonid Roshkovan, 4 years of experience) using ImageJ (National Institutes of Health, Bethesda, Maryland, USA). In the phantom, ROIs were placed in the consecutive five center slices and measurements were repeated for all five acquisitions. See Figure 4 for exact ROI positions. Mean HU values and standard deviations were compared between the patient DICOM image and the phantom DICOM image. In addition, manual size measurements of three small oval structures were performed by the radiologist on both the patient and phantom images using RadiAnt DICOM viewer (Medixant, Poznań, Poland). A line profile at the center of the phantom was compared to the original patient image. Histograms were calculated from the patient and phantom data to compare HU distributions. On this note, the segmentation for whole lung histograms was based on a manually selected mask, which was applied to phantom and original patient data. Line profile and histogram measurements were performed on the center slice of the phantom.
FIGURE 4.
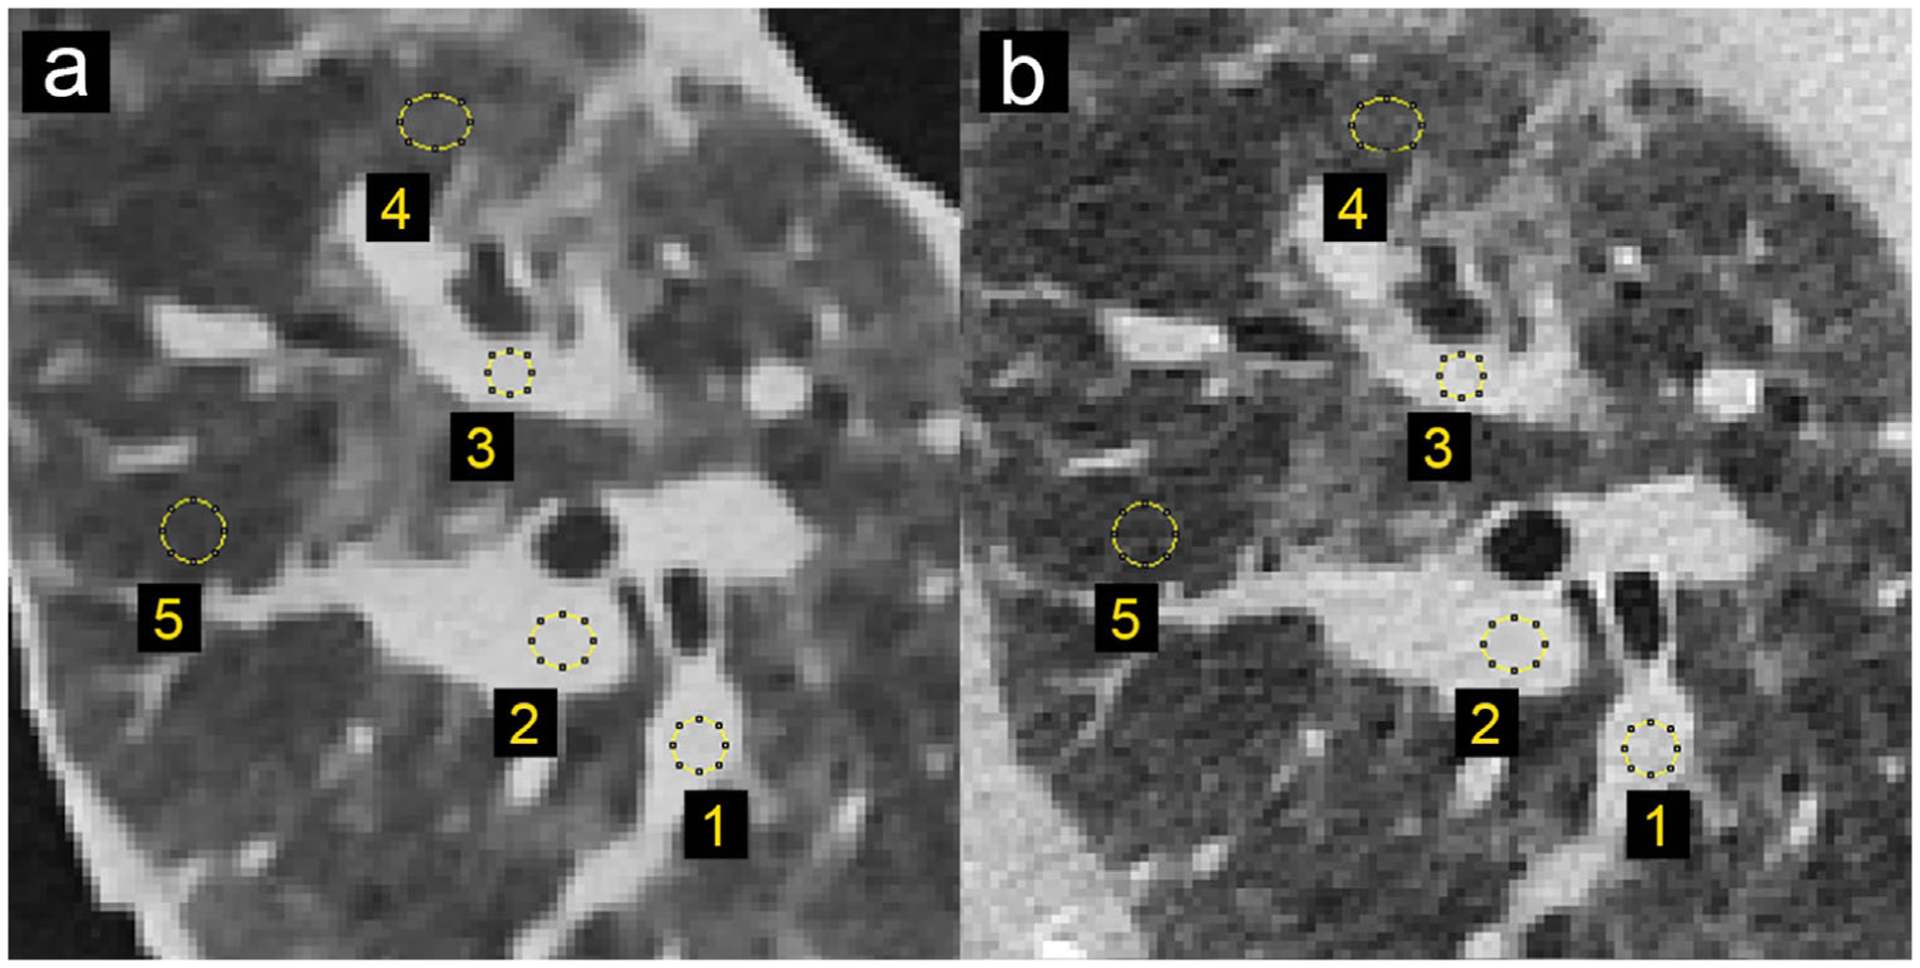
Locations and size of the selected regions of interest for density measurements in patient and phantom data. (a) CT image of patient-based phantom. (b) CT image of original patient lung. Window level is −500 HU. Window width is 1000 HU
3 |. RESULTS
Printing of the multi-sector calibration phantom required 16 h of printing time. The CT image of the phantom shows homogeneous appearances within the 10 different material density regions. Figure 1 illustrates that the individual printed filament lines are not visible. Measured mean HU values show a very high level of linear correlation with respect to the utilized filament line widths, with a Pearson’s correlation coefficient r > 0.999 (see Figure 2). The maximum HU (corresponding to 100% material density) was measured as 115, and the minimum HU (corresponding to 10% material density) was measured as −867.
FIGURE 2.
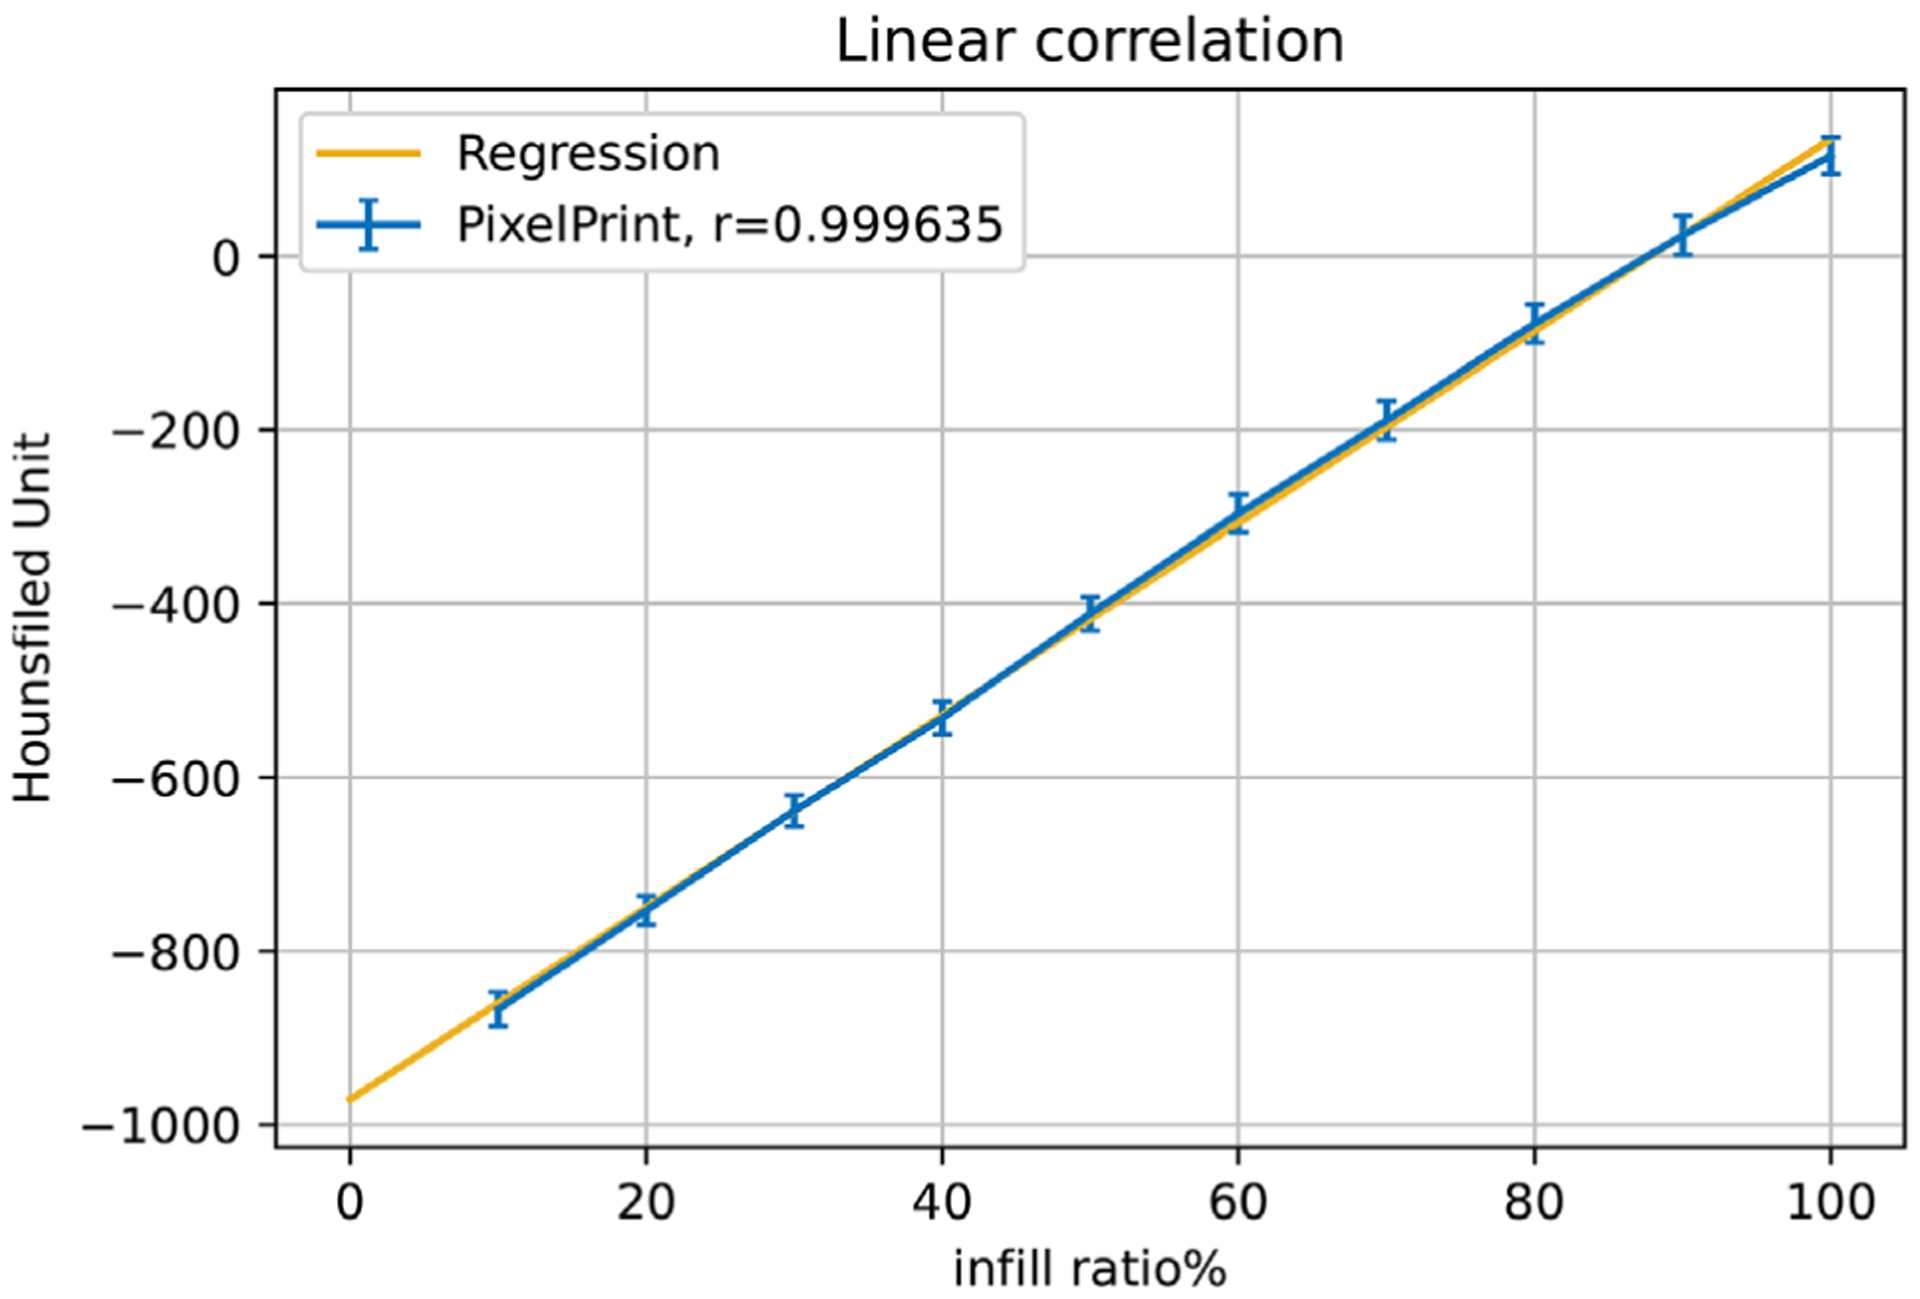
Linear regression between material density and Hounsfield Units. Blue markers and error bars show the mean values and standard deviation over 5 slices for regions of material density 10% to 100% in the multi-sector calibration phantom. The yellow line represents the regression line. r is Pearson’s correlation coefficient
The results from the patient-based phantom are summarized in Figure 3. Panels a, b, and c show a photograph of the phantom, CT slice of the phantom, and original patient data, respectively. Printing of the patient-based phantom required 24 h of printing time. The CT image of the phantom, shown in zoomed-in regions in the lower panels in Figure 3, closely resembles the lung of the original CT image in both texture and contrast levels, with clearly visible vascular and bronchial structures. One can observe slight differences in the noise pattern and spatial resolution due to higher attenuation from the patient body, lack of printed soft tissue and bone structures, difference of in-plane positions, and input data limitations (please see Discussion for additional details). To further investigate these effects, Figure 4 shows the identical regions in patient and phantom data selected for density measurements. Mean values from ROIs in five separate scans show very similar mean values, with a standard deviation less than 12 HU (see Table 2). The maximum difference to the original patient image observed is about 15 HU. In general, for lower-density areas where the patient image contains only air, PixelPrint has a slightly higher difference due to the 10% material density cut-off.
TABLE 2.
Mean and standard deviation of density measurements in patient and phantom data. ROI locations are depicted in Figure 4
| Patient | Phantom | ||||||
|---|---|---|---|---|---|---|---|
| Region | Area [mm2] | Mean [HU] | StdDev [HU] | Mean [HU] | StdDev [HU] | StdDevRep5 [HU] | Difference [HU] |
| 1 | 13.1 | −16.6 | 51.2 | −20.8 | ± 27.3 | 6.8 | 4.2 |
| 2 | 23.0 | 5.2 | 46.4 | −3.9 | ± 18.6 | 1.7 | 9.0 |
| 3 | 13.1 | 16.1 | 49.3 | 11.3 | ± 35.4 | 12.1 | 4.8 |
| 4 | 27.4 | −662.6 | 70.8 | −647.5 | ± 43.0 | 6.0 | −15.1 |
| 5 | 23.0 | −781.2 | 65.5 | −771.1 | ± 33.7 | 9.1 | −10.1 |
StdDevRep5 represents the standard deviation between the five repeated acquisitions of the phantom.
Figure 5 presents the three manually measured anatomical features. Manual size measurements performed by the radiologist illustrate a high degree of geometrical correlation of details between the patient image and the phantom images, with differences smaller than the intrinsic spatial resolution of the scans (see Table 3).
FIGURE 5.
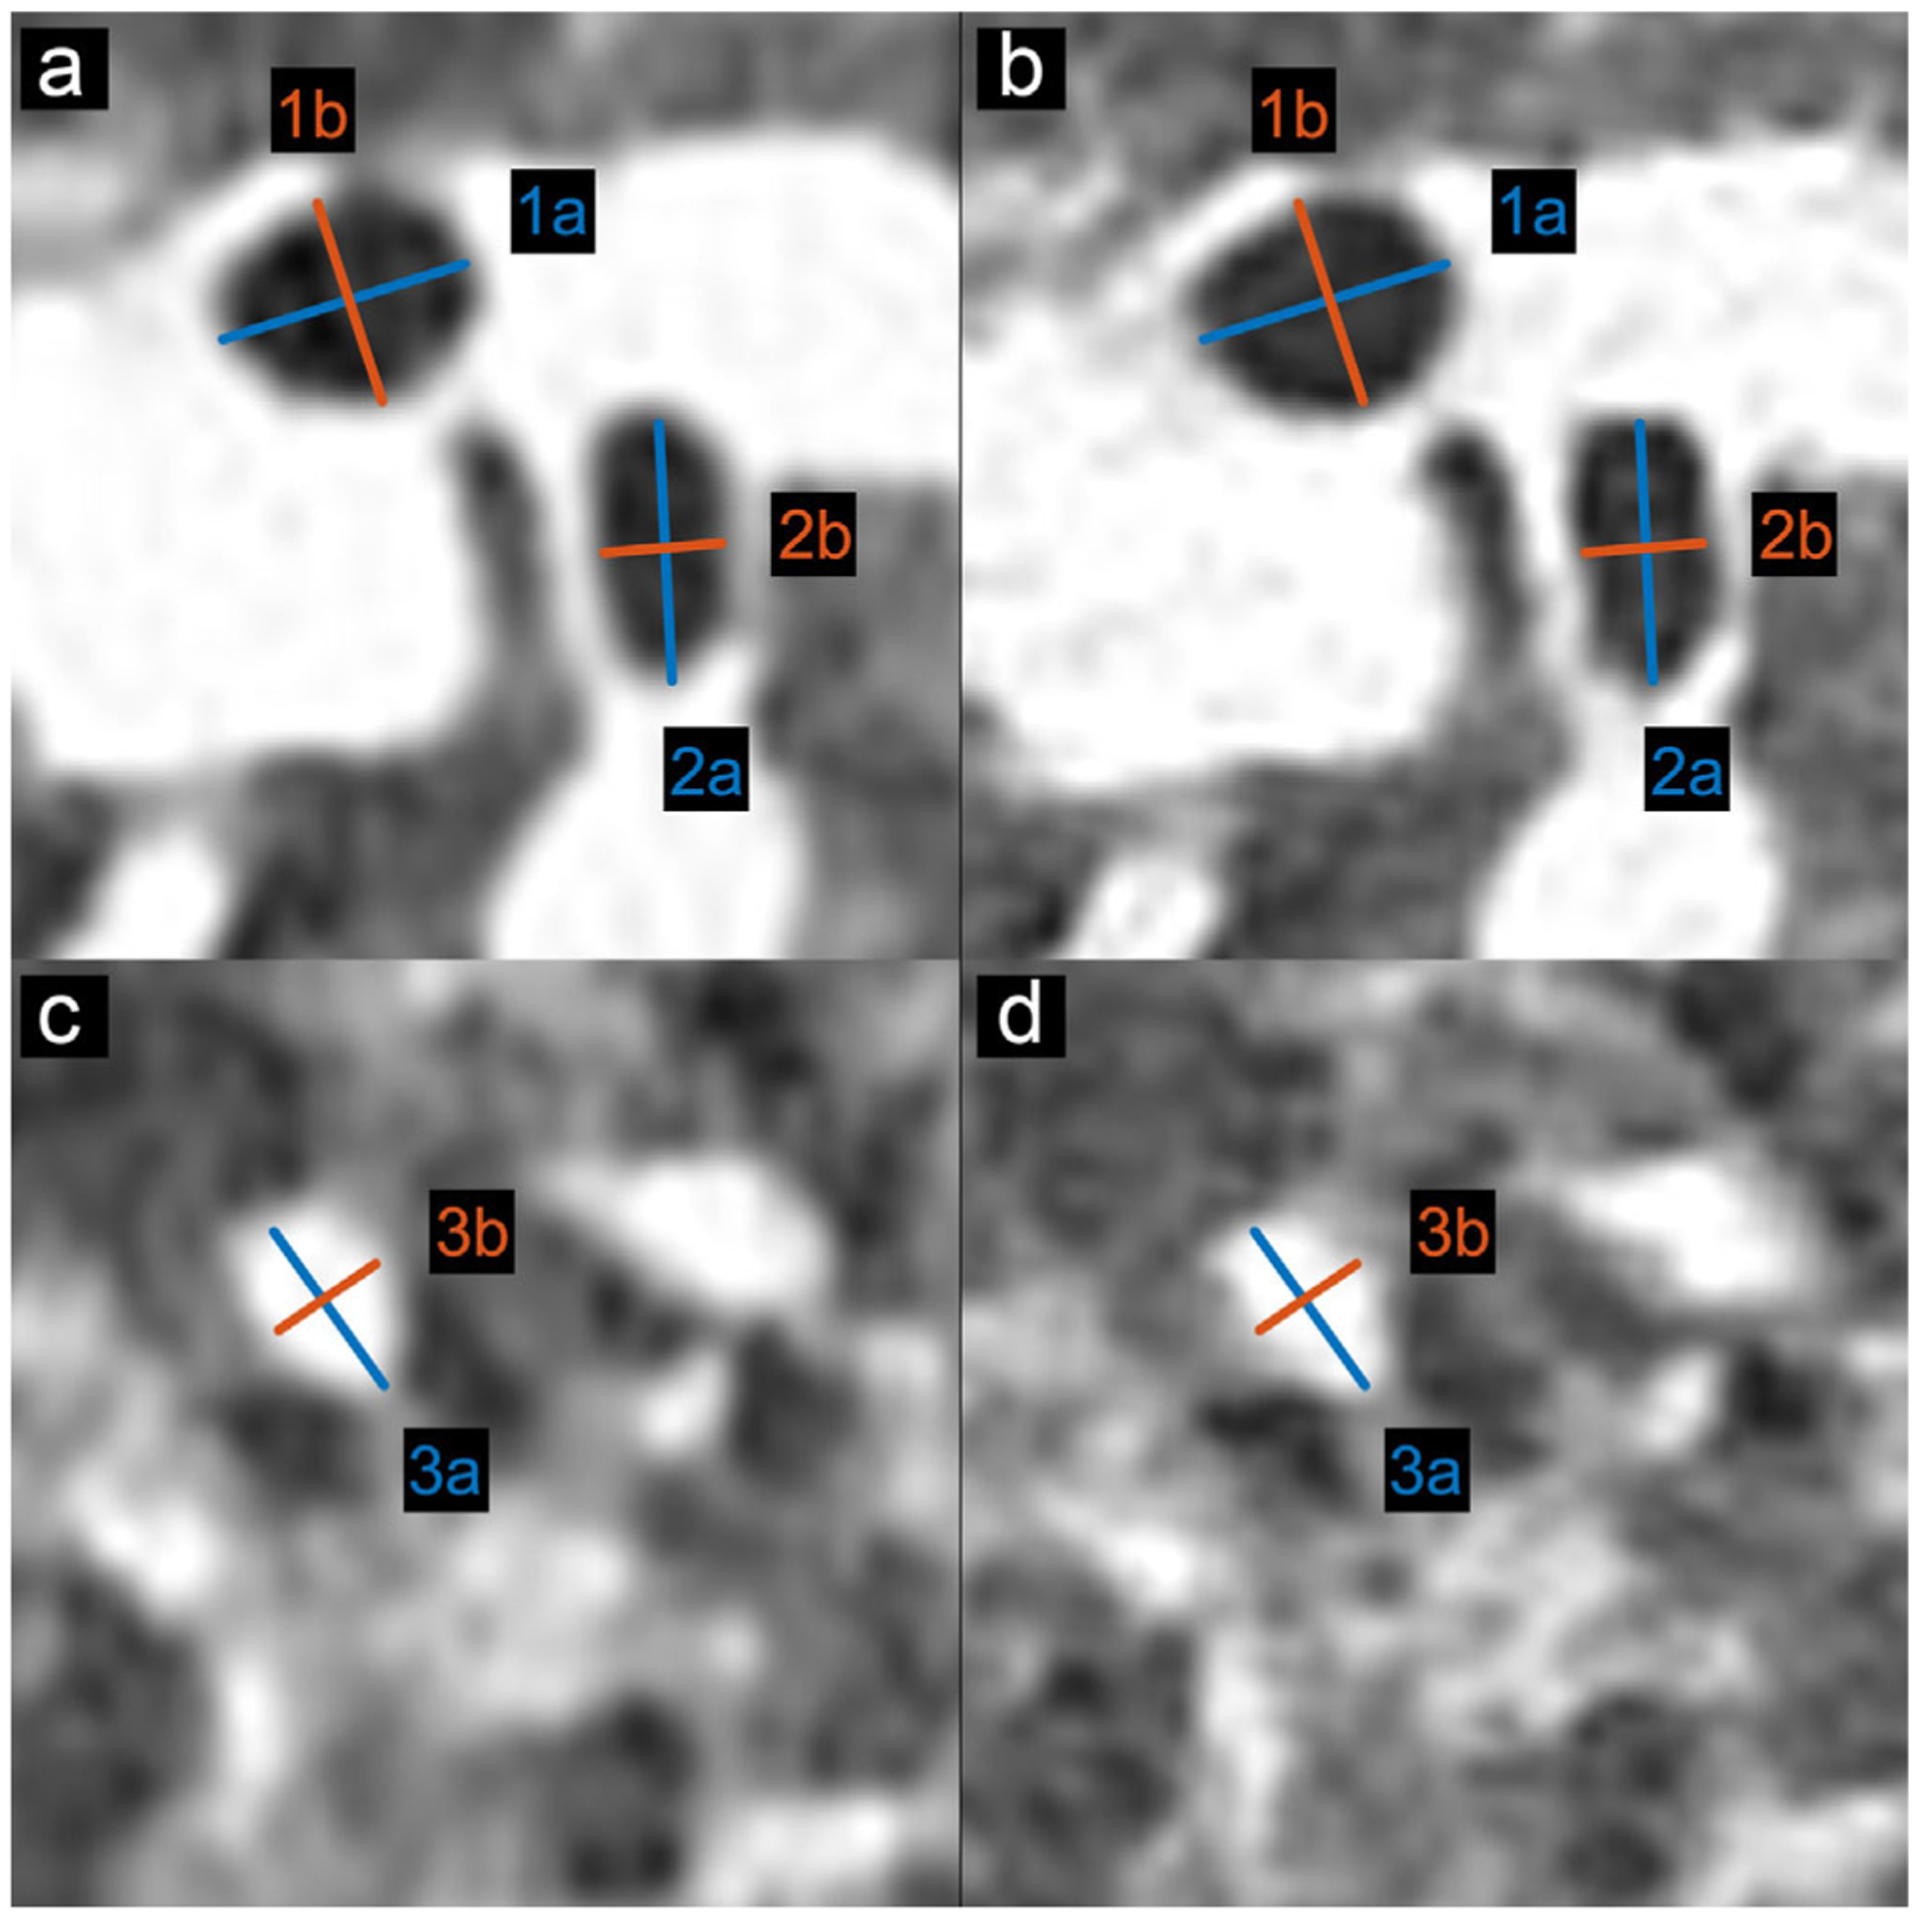
Locations and size of the selected anatomical features for size measurements in patient and phantom data. (a, c) CT image of patient-based phantom. (b, d) CT image of original patient lung. Window level is −500 HU. Window width is 1000 HU
TABLE 3.
Size measurement of anatomical features in patient and phantom data
| Patient | Phantom | |||
|---|---|---|---|---|
| Region | Major axis [mm], a | Minor axis [mm], b | Major axis [mm], a | Minor axis [mm], b |
| 1 | 7.00 | 5.47 | 7.27 | 5.49 |
| 2 | 7.64 | 3.43 | 7.45 | 3.31 |
| 3 | 5.59 | 4.12 | 5.70 | 4.21 |
In Figure 6, the line profile of the PixelPrint patient-based phantom closely matches the original patient image. In this 1 mm slice, rapid, accurate changes in intensity can be seen. In the histograms shown in Figure 7 for the patient-based phantom and original patient image, over the typical lung tissue range, PixelPrint phantom images highly resemble the contrast of the original patient image and have fast transitions along with the line profile. Due to the 10% and 100% cut-off, the signal accumulates at 0 and −800 HU in PixelPrint.
FIGURE 6.
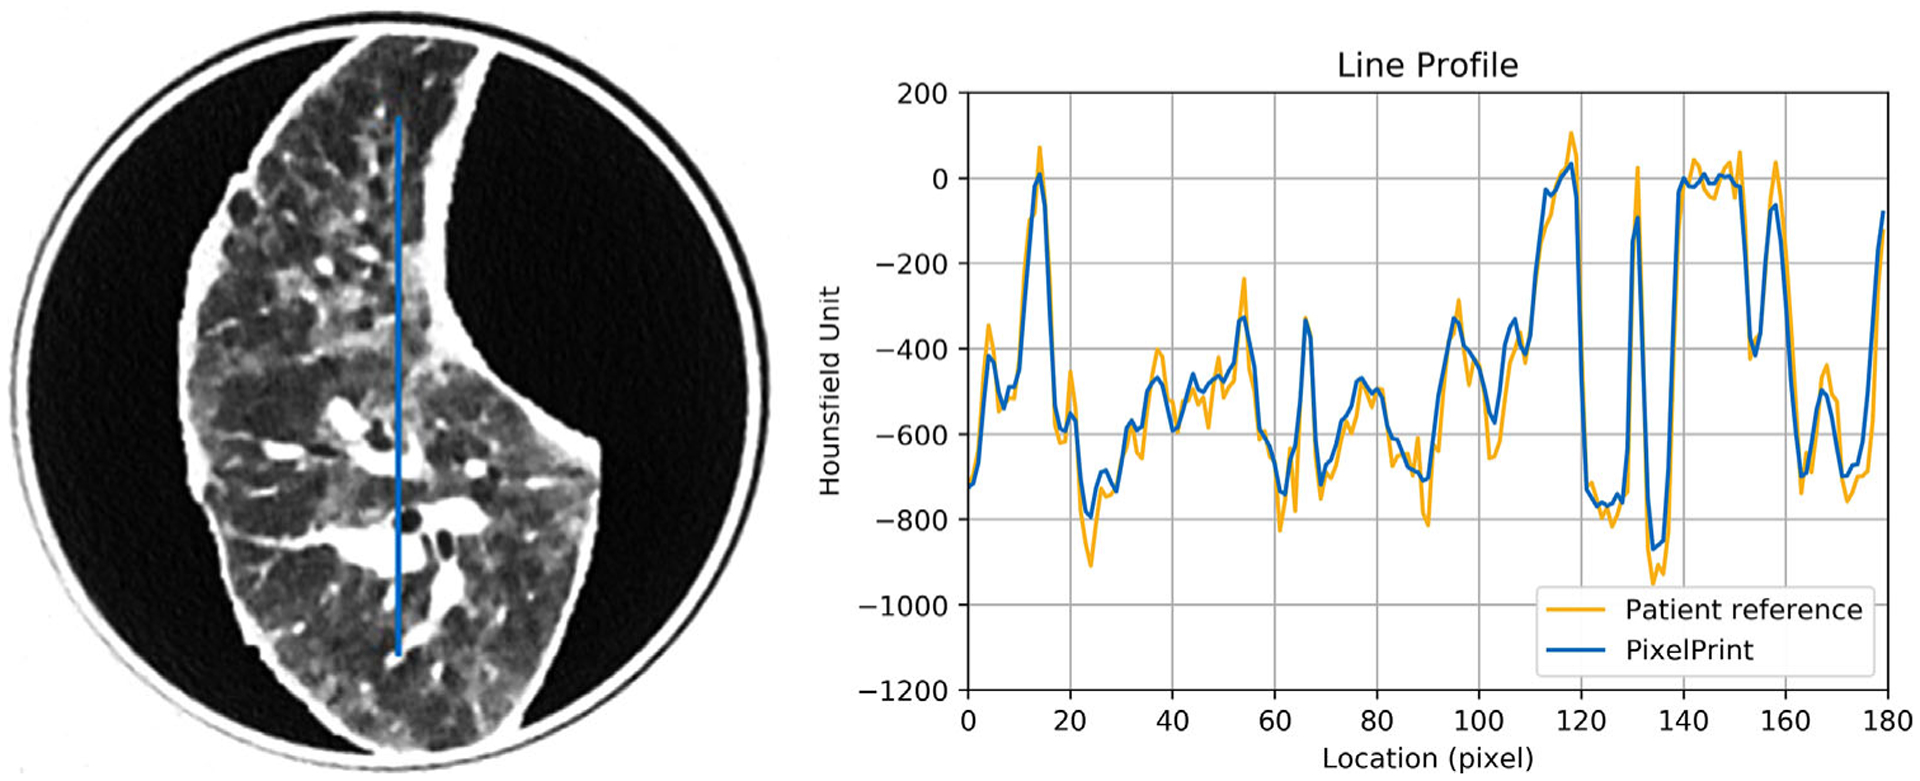
Line profile of the patient-based phantom (blue) versus the same location from the original patient image (yellow). Window level is −500 HU. Window width is 1000 HU
FIGURE 7.
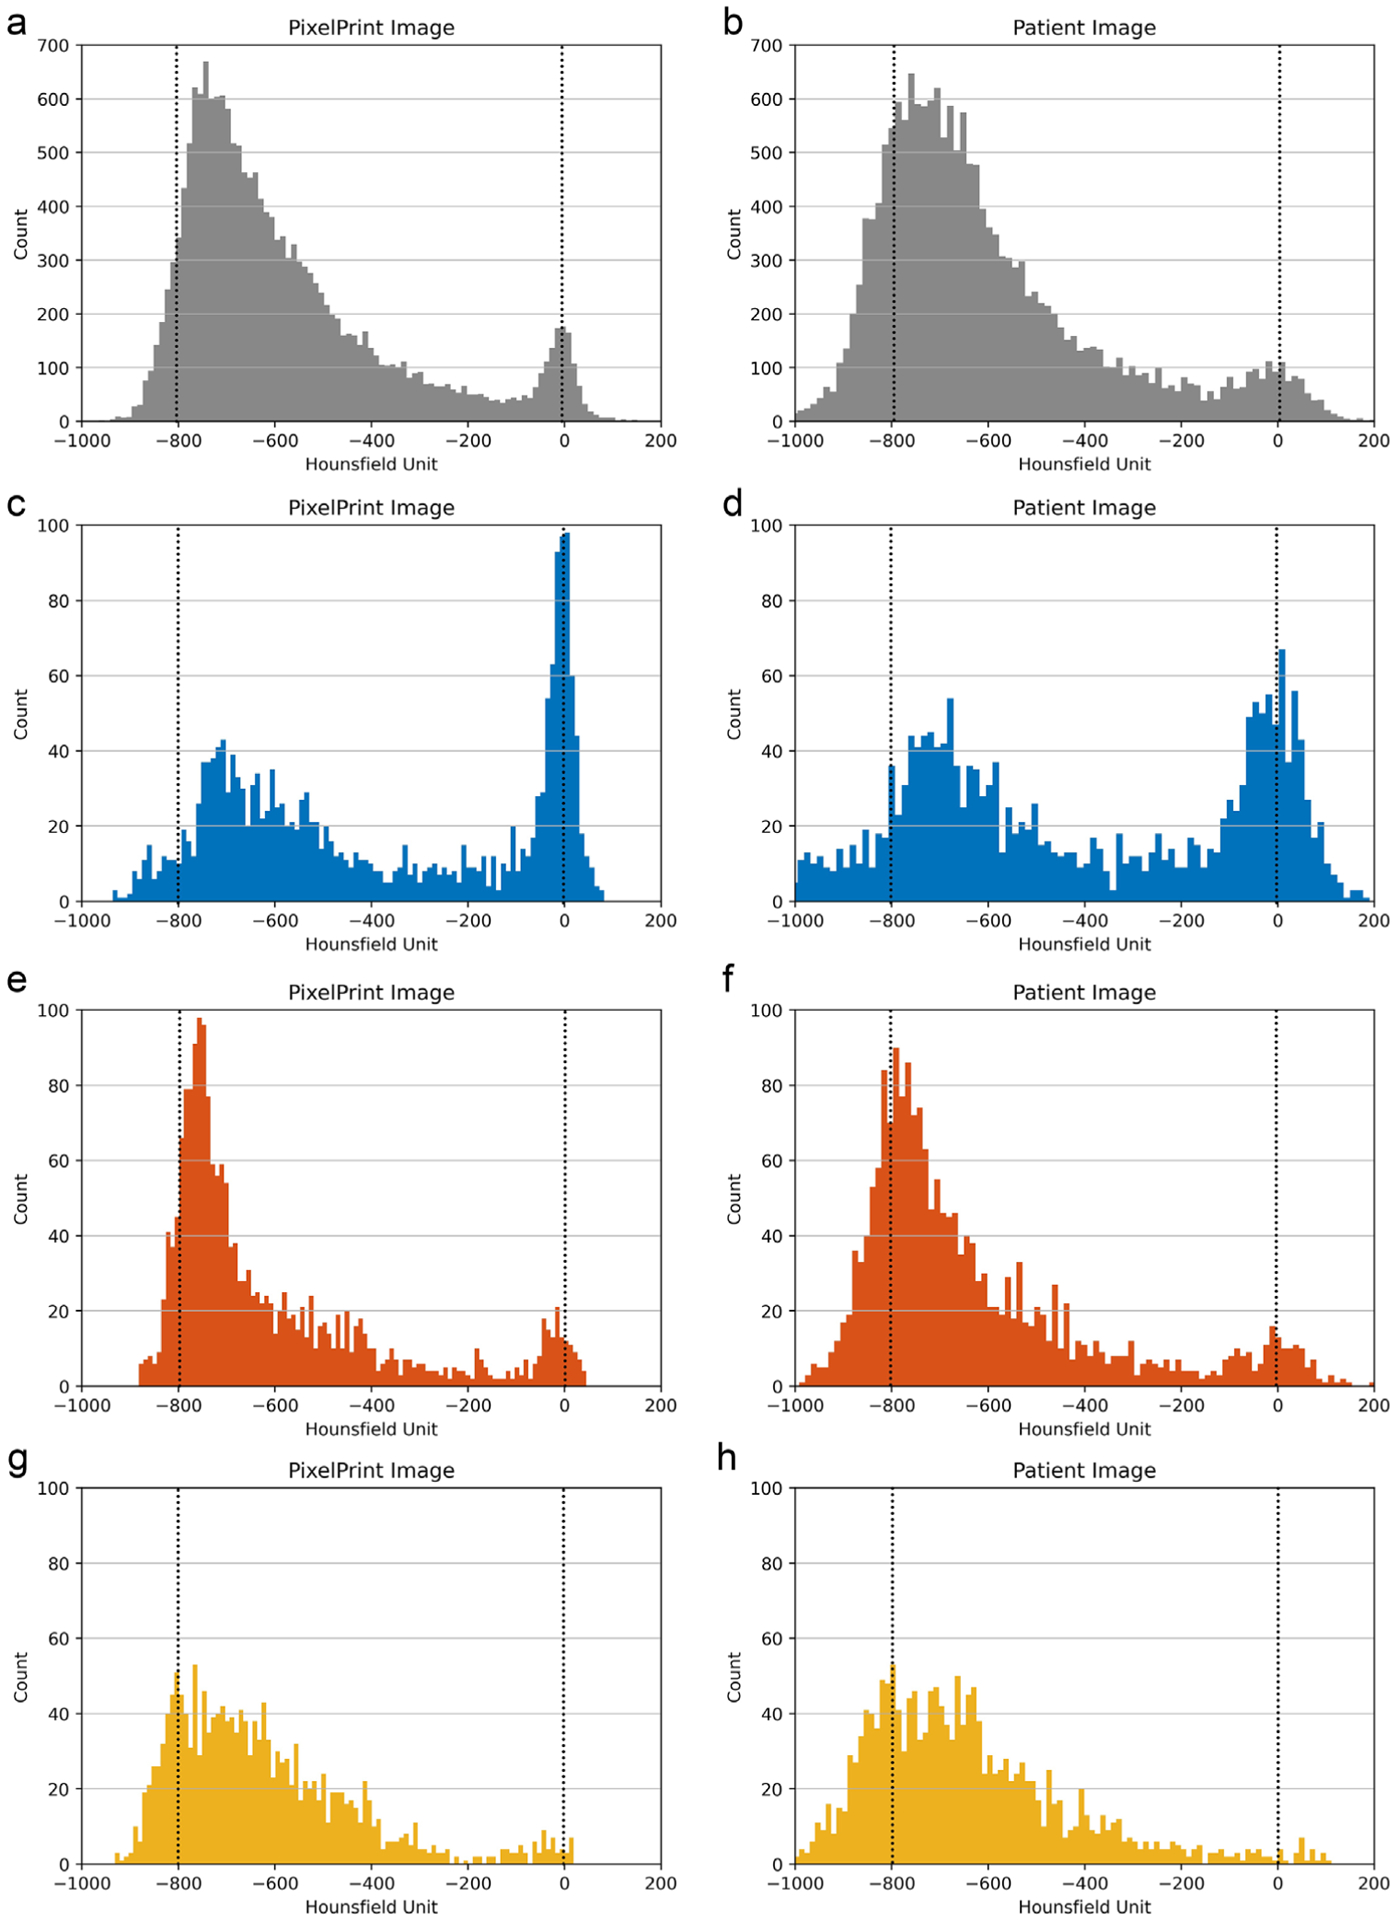
Histogram of (a, b) the whole lung and (c-h) the regions of interest selected in Figure 2. (a, c, e, g) are from PixelPrint phantom CT images. (b, d, f, h) are from original patient CT images. Blue, red, and yellow indicate the selected regions in Figure 2. Note: due to the 10% and 100% cut-off, signal accumulates at 0 HU and −800 HU in PixelPrint (dashed lines)
4 |. DISCUSSION
This paper introduces a 3D printing method, PixelPrint, which allows the generation of patient-based lung phantoms with accurate organ geometry, image textures, and attenuation profiles. This method allows direct conversion of CT DICOM images into 3D printer instructions. Compared to existing 3D printing methods, PixelPrint enables unique features:(i) PixelPrint controls the extrusion density by modulating the printing speed while holding the extrusion rate per unit time constant. (ii) PixelPrint utilizes a single 0.25 mm nozzle to precisely lay filament lines with width from 0.1 to 1.0 mm.(iii) PixelPrint focuses on creating patient-based lung tissue structures and textures. (iv) PixelPrint prints the entire image, edge to edge, without segmentation, rather than printing separate regions with segmentation. By eliminating segmentation, PixelPrint produces smooth, lifelike transitions between regions of different densities. PixelPrint produces no boundary effects. The algorithm is strictly analytical with no filtering and no tuning parameters. The one-step translation of image data reduces information loss (due to segmentation and triangulation steps in the 3D modeling) and maintains spatial resolution. Regarding resolution, our variable-speed printing concept allows us to control density on a voxel-by-voxel basis. Thus, we are enabling a cost-effective manufacturing process that generates realistic models of human lungs without sacrificing spatial and contrast resolution.
Over the last decade, several approaches have been proposed to produce clinically applicable CT phantoms. Madamesila et al. characterized 3D prints with various infill densities for quality assurance performances in CT.20 Kairn et al. introduced a method to generate a patient-based lung phantom.27 They segmented CT images of the lung into three different regions and produced a tissue equivalent lung phantom. However, their approach is not able to meet the resolution requirements to represent structures in the lung parenchyma. Hernandez-Giron et al. and Joemai et al. developed a printed lung for image quality assessment in CT; their prints contain vascular structures with limited realistic lung textures.10,28 Tino et al. uses a dual-head printer to create high-density patient-based bone phantoms21 with segmentation to create STL models. Okkalidis et al. demonstrated an algorithm,17,18 translating DICOM images to printer instructions and printing patient-specific skull and chest phantoms. Results showed a reliable match in HU; however, detailed structures and textures within the lung, for example, have not been presented. Compared to this approach, PixelPrint uses a constant extrusion rate per unit time and varies the print speed in order to vary the infill ratio. This method results in subpixel line width response and hence results in much better resolution. PixelPrint is designed to create small lung structures such as COVID-19 pathological changes in the range of −800 to 0 HU. Although the idea is similar, PixelPrint deploys new printing patterns and a print-speed control mechanism to achieve the desired resolution for lung CT. Of note, PixelPrint also eliminates the need for contour detection and morphological operations. Jahnke et al. introduced an alternative approach29,30 of stacking radiopaque 2D prints to form patient-based 3D phantoms. Although this is not an FDM printing-based method and can achieve high resolution in head or abdominal phantoms, it lacks the capacity for chest phantoms with density volumes below −200 HU inside the lung. As of today, 3D printers have become widely available, and a growing number of 3D printing medical applications have been introduced. Future studies will be essential to determine the difference between technologies and to establish standardization metrics for reproducibility and accuracy.
Our method enables the creation of real ground truth from clinical CT data, opening opportunities in the clinical and research arena. For day-to-day operations, our phantom concepts allow optimizing CT protocols with a focus on specific clinical tasks. For example, the clinical introduction of advanced nonlinear reconstruction algorithms31 can be challenging due to the limited clinical value of technical phantoms and ethical difficulties of scanning patients twice for this purpose. With our phantoms, an ample parameter space can be evaluated to determine the optimal solution with respect to radiation exposure and diagnostic image quality. A positive effect could be achieved for CT research and development by accelerating clinical evaluations with patient-based phantoms. Predominantly novel data-driven developments in artificial intelligence and radiomics can gain significantly from early access to realistic clinical data. One open challenge is the effect of differences in CT protocols and inter-vendor variabilities on radiomic features.32–35 With a representative group of patient-based phantoms manufactured with PixelPrint, one would be able to evaluate this effect fully and determine a robust and rigorous operating space for radiomic feature extraction. Further, the same group of phantoms may assist as a tool to evaluate and validate harmonization strategies.
The present study has some limitations. Only one patient-based phantom was evaluated for this proof-of-concept study. Follow-up studies will provide additional data and measurements to describe specific lung diseases such as COVID-19 pneumonia. For our initial study, we have focused on generating realistic models of the human lung. Future studies will be essential to add the capability to print soft tissue and bone to cover a broader range of anatomical regions and tissue x-ray attenuation. With our current setup, we observed slightly deviated accuracy for densities above 0 HU, which will need to be investigated if this is caused by filament material, printhead, or other parameter choices. When compared to the original patient data, there is a slight difference in noise pattern and spatial resolution. PixelPrint creates the printer instruction based on the patient input data. Those CT slices are contaminated with noise and resolution limited by the MTF of the individual patient scan protocol (system parameter, reconstruction filter, etc.). That information inherited from the patient scan is also included in the phantom print. Finally, the phantom is imaged with the identical patient scan protocol on the same scanner. We believe that the accumulation of effects is partly responsible for the observed changes. Future studies will be necessary to reduce those effects. This paper uses only PLA as filament material. PLA accurately depicts lung and soft tissue, but other materials, or multiple materials, could improve the dynamic range of lung phantoms and extend PixelPrint to phantoms which represent bone and other higher attenuation tissue. Further, the current configuration of PixelPrint is optimized for the spatial resolutions of conventional CT systems when employing lung imaging protocols. Follow-up developments will be necessary to upgrade PixelPrint for the current clinical introduction of ultra-high-resolution CT.36,37 At the same time, such ultra-high resolution, as well as micro CT systems, can be utilized to overcome the lack of standard methods to assess reproducibility and accuracy of 3D-printed phantoms by visualizing the printed structures. This step would allow to incorporate 3D printing more widely in routine practice. Finally, additional objective measurements of image textures can be beneficial to evaluate PixelPrint phantoms, such as spatial resolution analysis,14 Haralick’s texture feature,38 and power spectrum analysis.
Finally, we would like to allow the larger medical, academic, and industrial CT community to have access to PixelPrint. We can make copies of our phantoms available as well as customized phantoms based on specific CT images, which could include various lung diseases. For additional information, please see the project home-page: www.pennmedicine.org/CTResearch/PixelPrint
5 |. CONCLUSION
In conclusion, the present study illustrates the possibility of creating 3D-printed patient-based lung phantoms with accurate organ geometry, image texture, and attenuation profiles. This may lead to a paradigm change for the development of novel CT hardware and software by enabling accelerated evaluation and validation with realistic patient-based data. Ultimately this will shape the clinical day-to-day routine and benefit patients with novel and standardized CT imaging.
ACKNOWLEDGMENT
We acknowledge support through the National Institutes of Health (R01CA249538 & R01EB030494).
Funding information
National Institutes of Health, Grant/Award Numbers: R01CA249538, R01EB030494
Footnotes
CONFLICT OF INTEREST
The authors declare no conflict of interest.
DATA AVAILABILITY STATEMENT
The data that support the findings of this study are available on request from the corresponding author.
REFERENCES
- 1.Mitsouras D, Liacouras PC, Wake N, Rybicki FJ. RadioGraphics update: medical 3D printing for the radiologist. RadioGraphics. 2020;40(4):E21–E23. 10.1148/rg.2020190217. [DOI] [PubMed] [Google Scholar]
- 2.Filippou V,Tsoumpas C.Recent advances on the development of phantoms using 3D printing for imaging with CT,MRI,PET,SPECT, and ultrasound. Med Phys. 2018;45(9):e740–e760. 10.1002/mp.13058 [DOI] [PMC free article] [PubMed] [Google Scholar]
- 3.Rengier F, Mehndiratta A, Von Tengg-Kobligk H, et al. 3D printing based on imaging data: review of medical applications. Int J Comput Assist Radiol Surg.2010;5(4):335–341. 10.1007/s11548-010-0476-x [DOI] [PubMed] [Google Scholar]
- 4.Shahrubudin N, Lee TC, Ramlan R. An overview on 3D printing technology: technological, materials, and applications. Procedia Manuf. 2019;35:1286–1296. 10.1016/j.promfg.2019.06.089 [DOI] [Google Scholar]
- 5.Tino R, Yeo A, Leary M, Brandt M, Kron T. A systematic review on 3D-printed imaging and dosimetry phantoms in radiation therapy. Technol Cancer Res Treat. 2019;18:1–14. 10.1177/1533033819870208 [DOI] [PMC free article] [PubMed] [Google Scholar]
- 6.Leng S, McGee K, Morris J, et al. Anatomic modeling using 3D printing: quality assurance and optimization. 3D Print Med. 2017;3(1):1–14. 10.1186/s41205-017-0014-3 [DOI] [PMC free article] [PubMed] [Google Scholar]
- 7.Dangelmaier J, Bar-Ness D, Daerr H, et al. Experimental feasibility of spectral photon-counting computed tomography with two contrast agents for the detection of endoleaks following endovascular aortic repair. Eur Radiol. 2018;28(8):3318–3325. 10.1007/s00330-017-5252-7 [DOI] [PMC free article] [PubMed] [Google Scholar]
- 8.Kopp FK, Daerr H, Si-Mohamed S, et al. Evaluation of a preclinical photon-counting CT prototype for pulmonary imaging. Sci Rep. 2018;8(1):17386. 10.1038/s41598-018-35888-1 [DOI] [PMC free article] [PubMed] [Google Scholar]
- 9.Muenzel D, Bar-Ness D, Roessl E, et al. Spectral photon-counting CT: initial experience with dual-contrast agent K-edge colonography. Radiology. 2017;283(3):723–728. 10.1148/radiol.2016160890 [DOI] [PubMed] [Google Scholar]
- 10.Hernandez-Giron I, den Harder JM, Streekstra GJ, Geleijns J, Veldkamp WJH. Development of a 3D printed anthropomorphic lung phantom for image quality assessment in CT. Phys Medica. 2019;57:47–57. 10.1016/j.ejmp.2018.11.015 [DOI] [PubMed] [Google Scholar]
- 11.Abdullah KA, McEntee MF, Reed W, Kench PL. Development of an organ-specific insert phantom generated using a 3D printer for investigations of cardiac computed tomography protocols. J Med Radiat Sci. 2018;65(3):175–183. 10.1002/jmrs.279 [DOI] [PMC free article] [PubMed] [Google Scholar]
- 12.Li J, Gang G, Brehler M, Shi H, Stayman J. 3D-printed textured phantoms for assessment of high resolution CT. Med Phys. 2019;46:E209–E210. [Google Scholar]
- 13.Shi H, Gang G, Li J, Liapi E, Abbey C, Stayman JW. Performance assessment of texture reproduction in high-resolution CT. In: Samuelson FW, Taylor-Phillips S, eds. Medical Imaging 2020: Image Perception, Observer Performance, and Technology Assessment. SPIE-Intl Soc Optical Eng.; 2020:25. 10.1117/12.2550579 [DOI] [PMC free article] [PubMed] [Google Scholar]
- 14.Solomon J, Ba A, Bochud F, Samei E. Comparison of low-contrast detectability between two CT reconstruction algorithms using voxel-based 3D printed textured phantoms. Med Phys. 2016;43(12):6497–6506. 10.1118/1.4967478 [DOI] [PubMed] [Google Scholar]
- 15.Pardo GLA, Conzelmann J, Genske U, Hamm B, Scheel M, Jahnke P. 3D printing of anatomically realistic phantoms with detection tasks to assess the diagnostic performance of CT images. Eur Radiol. 2020;30(8):4557–4563. 10.1007/s00330-020-06808-7 [DOI] [PMC free article] [PubMed] [Google Scholar]
- 16.Pegues H, Knudsen J, Tong H, et al. Using inkjet 3d printing to create contrast-enhanced textured physical phantoms for CT. In: Vol 10948. SPIE-Intl Soc Optical Eng. 2019:181. 10.1117/12.2512890 [DOI] [Google Scholar]
- 17.Okkalidis N A novel 3D printing method for accurate anatomy replication in patient-specific phantoms. Med Phys. 2018;45(10):4600–4606. 10.1002/mp.13154 [DOI] [PubMed] [Google Scholar]
- 18.Okkalidis N, Marinakis G. Technical note: accurate replication of soft and bone tissues with 3D printing. Med Phys. 2020;47(5):2206–2211. 10.1002/mp.14100 [DOI] [PubMed] [Google Scholar]
- 19.Leary M, Tino R, Keller C, et al. Additive manufacture of lung equivalent anthropomorphic phantoms: a method to control Hounsfield number utilizing partial volume effect. J Eng Sci Med Diagnostics Ther. 2020;3(1):011001. 10.1115/1.4044460 [DOI] [Google Scholar]
- 20.Madamesila J, McGeachy P, Barajas JEV, Khan R. Characterizing 3D printing in the fabrication of variable density phantoms for quality assurance of radiotherapy. Phys Medica. 2016;32(1):242–247. 10.1016/j.ejmp.2015.09.013 [DOI] [PubMed] [Google Scholar]
- 21.Tino R, Yeo A, Brandt M, Leary M, Kron T. The interlace deposition method of bone equivalent material extrusion 3D printing for imaging in radiotherapy. Mater Des. 2021;199:109439. 10.1016/j.matdes.2020.109439 [DOI] [Google Scholar]
- 22.Hamedani BA, Melvin A, Vaheesan K, Gadani S, Pereira K, Hall AF. Three-dimensional printing CT-derived objects with controllable radiopacity.J Appl Clin Med Phys.2018;19(2):317–328. 10.1002/acm2.12278 [DOI] [PMC free article] [PubMed] [Google Scholar]
- 23.Hazelaar C, Van Eijnatten M, Dahele M, et al. Using 3D printing techniques to create an anthropomorphic thorax phantom for medical imaging purposes. Med Phys. 2018;45(1):92–100. 10.1002/mp.12644 [DOI] [PubMed] [Google Scholar]
- 24.Kairn T, Crowe SB, Markwell T, Erratum to: world congress on medical physics and biomedical engineering,Toronto,Canada,7–12 June 2015. IFMBE Proc. 2015;51:728–731. 10.1007/978-3-319-19387-8 [DOI] [Google Scholar]
- 25.Leary M, Kron T, Keller C, et al. Additive manufacture of custom radiation dosimetry phantoms: an automated method compatible with commercial polymer 3D printers. Mater Des. 2015;86:487–499. 10.1016/j.matdes.2015.07.052 [DOI] [Google Scholar]
- 26.Bradski G The OpenCV library. Dr Dobb’s J Softw Tools. 2000;25(11):120–123. [Google Scholar]
- 27.Kairn T, Zahrani M, Cassim N, Livingstone AG, Charles PH, Crowe SB. Quasi-simultaneous 3D printing of muscle-, lung- and bone-equivalent media: a proof-of-concept study. Phys Eng Sci Med. 2020;43(2):701–710. 10.1007/s13246-020-00864-5 [DOI] [PubMed] [Google Scholar]
- 28.Joemai RMS, Geleijns J. Assessment of structural similarity in CT using filtered backprojection and iterative reconstruction: a phantom study with 3D printed lung vessels. Br J Radiol. 2017;90(1079):20160519. 10.1259/bjr.20160519 [DOI] [PMC free article] [PubMed] [Google Scholar]
- 29.Jahnke P, Limberg FRP, Gerbl A, et al. Radiopaque three-dimensional printing: a method to create realistic CT phantoms. Radiology. 2017;282(2):569–575. 10.1148/radiol.2016152710 [DOI] [PubMed] [Google Scholar]
- 30.Jahnke P, Schwarz S, Ziegert M, Schwarz FB, Hamm B, Scheel M. Paper-based 3D printing of anthropomorphic CT phantoms: feasibility of two construction techniques. Eur Radiol. 2019;29(3):1384–1390. 10.1007/s00330-018-5654-1 [DOI] [PubMed] [Google Scholar]
- 31.Willemink MJ, Noël PB. The evolution of image reconstruction for CT—from filtered back projection to artificial intelligence. Eur Radiol. 2019;29(5):2185–2195. 10.1007/s00330-018-5810-7 [DOI] [PMC free article] [PubMed] [Google Scholar]
- 32.Ger RB, Zhou S, Chi PCM, et al. Comprehensive investigation on controlling for CT imaging variabilities in radiomics studies. Sci Rep. 2018;8(1):13047. 10.1038/s41598-018-31509-z [DOI] [PMC free article] [PubMed] [Google Scholar]
- 33.Mackin D, Fave X, Zhang L, et al. Measuring computed tomography scanner variability of radiomics features. Invest Radiol. 2015;50(11):757–765. 10.1097/RLI.0000000000000180 [DOI] [PMC free article] [PubMed] [Google Scholar]
- 34.Larue RTHM, van Timmeren JE, de Jong EEC, et al. Influence of gray level discretization on radiomic feature stability for different CT scanners, tube currents and slice thicknesses: a comprehensive phantom study. Acta Oncol (Madr). 2017;56(11):1544–1553. 10.1080/0284186X.2017.1351624 [DOI] [PubMed] [Google Scholar]
- 35.Ligero M, Jordi-Ollero O, Bernatowicz K, et al. Minimizing acquisition-related radiomics variability by image resampling and batch effect correction to allow for large-scale data analysis. Eur Radiol. 2021;31(3):1460–1470. 10.1007/s00330-020-07174-0 [DOI] [PMC free article] [PubMed] [Google Scholar]
- 36.Oostveen LJ, Boedeker KL, Brink M, Prokop M, de Lange F, Sechopoulos I. Physical evaluation of an ultra-high-resolution CT scanner. Eur Radiol. 2020;30(5):2552–2560. 10.1007/s00330-019-06635-5 [DOI] [PMC free article] [PubMed] [Google Scholar]
- 37.Sandfort V, Persson M, Pourmorteza A, Noël PB, Fleischmann D, Willemink MJ. Spectral photon-counting CT in cardiovascular imaging. J Cardiovasc Comput Tomogr. 2021;15(3):218–225. 10.1016/j.jcct.2020.12.005 [DOI] [PubMed] [Google Scholar]
- 38.Haralick RM. Statistical and structural approaches to texture. Proc IEEE. 1979;67(5):786–804. 10.1109/PROC.1979.11328 [DOI] [Google Scholar]
Associated Data
This section collects any data citations, data availability statements, or supplementary materials included in this article.
Data Availability Statement
The data that support the findings of this study are available on request from the corresponding author.


