Abstract
The GRAS (gibberellic acid insensitive, repressor of GAI and scarecrow) transcription factors (TFs) regulate diverse biological processes involved in plant growth and development. These TFs are also known to regulate gene expression in response to various abiotic stress factors like cold, drought, etc. In chickpea one of the most devastating abiotic stress factors is terminal drought. The GRAS TF family has not been characterized in chickpea (Cicer arietinum L.) until now. In this study, we report 46 GRAS TF genes (CaGRAS genes) in the chickpea genome. The CaGRAS proteins were categorized into nine subfamilies based on their phylogenetic relationship with known GRAS members of Arabidopsis and soybean. The PAT subfamily was the largest consisting of ten CaGRAS members whereas the LAS subfamily was the smallest with only one member. Gene duplication analysis revealed that segmental duplication was the primary reason for the expansion of this gene family within the chickpea genome. The gene expression levels of CaGRAS genes were analysed using two different chickpea varieties contrasting for drought tolerance trait, i.e., ICC 4958 (drought tolerant) and ICC 1882 (drought sensitive). On exposure to drought stress, the two chickpea genotypes, exhibited differential drought response, which was quantified and estimated in terms of differences in leaf relative water content (RWC). The well-watered or control plants of the drought tolerant variety were able to maintain a higher leaf RWC by the end of the drought stress period, whereas the control plants of the drought sensitive variety continued to show a decline in leaf RWC. The two genotypes also differed in their root morphologies, under well-watered and drought stress conditions. The gene expression analysis revealed a potential role of PAT, SCR, SCL3 and SHR GRAS members in the regulation of differential response to drought, in the root tissues, for both the genotypes. CaGRAS 12 (SCR) was identified as a drought-responsive GRAS TF gene, which could serve as a potential candidate gene for utilization in developing chickpea varieties with improved drought tolerance. This study demonstrates the drought-responsive expression of CaGRAS genes in chickpea and also describes the morpho-physiological response of chickpea plants to drought stress conditions.
Supplementary Information
The online version contains supplementary material available at 10.1007/s13205-021-03104-z.
Keywords: Chickpea, GRAS, Phylogeny, Roots, Terminal drought, Transcription factors
Introduction
Transcription factors (TFs) are DNA binding proteins which bind to the regulatory elements of genes, in the promoter and enhancer regions and modulate gene expression. The role of TFs in inducing specific plant responses to both biotic and abiotic stress factors has been extensively elaborated. Owing to their ability to regulate a wide variety of genes, these proteins are known to control different metabolic pathways and thus have predominant roles in governing the behaviour of an organism in response to environmental perturbations. Across the plant kingdom, more than 0.3 million TFs have been identified (Plant TFDB v5.0, Jin et al. 2017). These belong to 58 different families. Amongst the major TF families which have been well characterized in plants are the MYB, bHLH, WRKY, ERF, etc., families (Ambawat et al. 2013; Phukan et al. 2016; Goossens et al. 2017; Xie et al. 2019). The availability of whole genome sequences of different species, has allowed the identification of unidentified TF families. The GRAS TF family has been identified in more than 20 genera, a few of them being Arabidopsis thaliana, Oryza sativa, Populus trichocarpa, Brachypodium distachyon, Selaginella moellendorffii, Physcomitrella patens, Brassica napus, Zea mays, Medicago truncatula, Glycine max, Nelumbo nucifera, Gossypium hirsutum, Lycopersicon esculentum, Isatis indigotica, Prunus mume, etc. (Cenci and Rouard 2017). This family derives its name from the three first identified members, i.e., gibberellic acid insensitive (GAI), repressor of GAI (RGA) and scarecrow (SCR). The GRAS proteins play critical roles in diverse processes such as signal transduction, axillary shoot meristem formation and maintenance, male gametogenesis, radial patterning of root tissues, etc. These proteins are typically composed of 400–700 amino acids and possess a GRAS domain in the C-terminal sequence. The domain consists of certain conserved sequence motifs, mostly found in the sequential order of leucine heptad repeat I (LHRI), VHIID, leucine heptad repeat II (LHRII), PFYRE and SAW motifs. The high degree of conservation of these motifs is indicative of their importance in determining the molecular function of the GRAS proteins. While several other TF families like NAC, ERF, WRKY, NF-Y, etc. have been identified in chickpea (Ha et al. 2014; Agarwal et al. 2016; Kumar et al. 2016; Chu et al. 2018) the GRAS TF family still remains uncharacterized.
The GRAS TF family has been classified into different subfamilies. These vary in their numbers across species and recently 17 subfamilies of GRAS proteins have been reported in angiosperms (Cenci and Rouard 2017). These include the Scarecrow (SCR), Scarecrow-Like 3 (SCL3), Short Root (SHR), Phytochrome A Signal Transduction (PAT), Required for Arbuscule Development 1 (RAD1), Scarecrow-Like A (SCLA), DELLA, Reduced Arbuscular Mycorrhization 1 (RAM1), Dwarf and Low-Tillering (DLT), Scarecrow-Like B (SCLB), LISCL, Scarecrow-Like 4 and 7(SCL4/7), Lateral Suppressor (LAS), Hairy Meristem (HAM), Nodulation Signaling Pathway 1 (NSP1), Nodulation Signaling Pathway 2 (NSP2) and Scarecrow-Like 32 (SCL32) subfamilies. However, not all subfamilies are represented in all species. Members of few of these individual subfamilies have been functionally characterized in some species. In Arabidopsis, the LAS proteins are associated with the formation of lateral shoots during vegetative growth (Cenci and Rouard 2017). The SHR and SCR family of TFs are involved in the formation of ground tissue in the root apical meristem in Arabidopsis. This is facilitated by the formation of a SHR/SCR complex which regulates the cell division process of the cortex endodermal initial cells (Giovanna et al. 2018). In white lupin (Lupinus albus), the suppression of LaSCR1 via RNAi, led to decreased root numbers, indicating the potential role of the protein in supporting root growth (Sbabou et al. 2010). The GRAS proteins have also been demonstrated to play important roles in response to abiotic stress factors like drought stress, salinity stress, etc. The BrLAS gene from Brassica rapa, confers enhanced drought tolerance in transgenic Arabidopsis plants which overexpressed this gene (Li et al. 2018). The transgenic plants showed decreased ROS accumulation and increased antioxidant enzyme activity, when subjected to drought treatment compared to the wild-type plants. Similarly, the transgenic rice lines which overexpressed the GRAS transcription factor gene, OsGRAS23 were shown to have enhanced drought tolerance compared to the wild-type plants. This gene is localized at the QTL interval previously identified for drought tolerance in rice (Xu et al. 2015). In a similar study, overexpression of GmGRAS37 in soybean resulted in improved tolerance to drought and salinity stress. The transgenic plants had lower levels of H2O2, had longer roots and showed delayed wilting, as some of the visible phenotypic differences (Wang et al. 2020a). The gene SlGRAS in tomato is induced in response to ethephon (Eth), gibberellic acid (GA), indole acetic acid (IAA) and salicylic acid (SA) (Huang et al. 2016). In chickpea, root transcriptome analysis through RNA-Seq revealed that the SCR gene was differentially expressed in roots of salt sensitive and tolerant genotypes, which were subjected to salinity stress (Kaashyap et al. 2018).
Considering the putative role of these TFs, particularly the SCR, SCL3 and SHR TFs, in controlling the root morphology, it was hypothesized that these might have a significant function in the regulation of gene expression in root tissues. Since, root morphology has been shown to have profound effects on drought responsiveness of genotypes, the GRAS proteins could be potentially involved in the regulation of gene expression of drought-responsive genes. The presence of a prolific, deep rooting system is a favourable trait associated with the ability of plants to be able to avoid or circumvent drought stress conditions. In fact, the drought tolerance trait of certain genotypes has been attributed to the presence of such longer roots. These roots allow these genotypes to mine water from greater depths of soil under water-limiting conditions. In chickpea, for instance, the drought tolerance of ICC 4958, a variety which is widely used as a donor parent for drought tolerance trait in breeding programmes, is partly associated with its prolific root system, in terms of greater root length and volume (Saxena et al. 1993). The present study was, therefore, undertaken to (a) identify and characterize the GRAS TFs in chickpea (b) examine the expression of these TFs in the root tissues in genotypes, contrasting with respect to root morphological traits, under both well-watered and drought stress conditions.
Materials and methods
Plant materials and drought stress imposition
Two desi (indigenous) chickpea genotypes, ICC 4958 (drought tolerant, DT) and ICC 1882 (drought sensitive, DS), were grown in completely randomized design (CRD) in 12 inch (30 cm) diameter plastic pots kept in a net house, at ICAR-NIPB, during rabi (November–March) 2019–2020. Three seeds per pot, were sown at a depth of 2 cm. For each genotype 12 pots were sown, amounting to a total of 36 seeds. Thinning was done 15 days after sowing and two healthy plants were retained in each pot. Finally for each genotype 24 plants were obtained. One-half of these plants were grown under well-watered conditions (control, C), while the other half were subjected to drought stress conditions (treated, T), for both the genotypes. The latter were subjected to drought stress at 76 days after sowing (76 DAS), by withholding irrigation. At this stage, an equal amount of water (1 L) was provided to only the control plants (C), while the treated plants (T) were not watered thereafter. This day was considered as day 0. Since, in chickpea, terminal drought is the most damaging form of drought stress, the drought stress was imposed only after the initiation of flowering in the genotypes. After 50 days of stress treatment, the leaf and root tissues of the genotypes were collected in liquid nitrogen and stored at − 80 °C for subsequent analysis.
Relative water content (RWC) and soil moisture content (SMC) estimation
The leaf RWC was estimated at intervals of 18, 36 and 50 days after drought stress initiation, to monitor the progression of drought stress and to achieve the optimum differences in RWC of plants between the treatments (control versus stress). For the determination of RWC, the third fully expanded leaves from the top were collected before noon from the plants. These were collected on day 0, day 18, day 36 and day 50. The leaves were weighed to record the fresh weights (FW). The leaf samples were then immersed in double-distilled water in covered petriplates for 4 h and weighed to record turgid weights (TW). The samples were then dried at 65 °C in an oven for 24–48 h and were weighed to record the dry weights (DW). The experiment was performed for five biological replicates for each treatment. The RWC (%) values were calculated according to the formula given below (Barrs and Weatherley 1962):
The SMC was estimated by the gravimetric method (Black 1965). Soil samples from a depth of 15–30 cm were taken in aluminium moisture boxes, from the pots using soil augers at day 0 and day 126. Fresh weights (W1) of the soil samples were recorded. These were then oven-dried at 100–110 °C for 24 h and re-weighed (W2). The soil moisture content was calculated using the following formula:
where C1 = moisture box weight.
Root scanning
Since, the two genotypes differ significantly in their root morphology, root scanning was also performed for the roots of the plants. The roots of plants (126 DAS) were carefully extracted. The recovered roots were washed thoroughly and then suspended in a transparent tray which was filled with water (2–3 mm ht). This allowed dispersion of roots which were then scanned using the image analysis system (WinRhizo, Regent Instruments INC., Quebec, Canada). The roots were characterized for traits like root length, volume, surface area and diameter.
Identification of GRAS genes in chickpea
Nucleotide and protein sequence files of chickpea (CDC Frontier genome Cav1.0, assembly ASM33114v1) were retrieved from NCBI RefSeq. A local nucleotide and protein database of annotated chickpea genes was created using NCBI command-line tools, BLAST + . The Hidden Markov Model (HMM) profile of GRAS TF (PF03514.14) was downloaded from the Pfam database and it was used to scan the chickpea proteins using HMMERv3 (Prince and Pickett 2002). The identified proteins were confirmed for the presence of the GRAS domain by searching them against the NCBI CD and SMART databases. The genomic and cDNA sequences of the proteins were acquired from the chickpea genome assembly database.
Bioinformatic analysis of CaGRAS proteins
The protein sequences were analysed for determination of protein length (number of amino acids), molecular weight (Da) and theoretical isoelectric point (pI), through the online ExPASy website (http://web.expasy.org/) (Bjellqvist et al. 1993). The Cellov2.5 webserver was used for in silico prediction of the subcellular location of the GRAS proteins (http://cello.life.nctu.edu.tw/). The conserved motifs in the GRAS domain at the C terminus were identified using the MEME suite webserver online program; (http://meme-suite.org/tools/meme) where the maximum number of motifs was set to ten with a width ranging from 6 to 50 (Bailey et al. 2009). The sequence homology between Arabidopsis thaliana scarecrow protein, a member of GRAS family of proteins and chickpea scarecrow protein, was determined through MSA using Clustal Omega (https://www.ebi.ac.uk/Tools/msa/clustalo/). Network analysis was done using the STRING database (https://string-db.org/) to determine the physical interaction between the CaGRAS proteins.
Gene structure and genomic organization of the identified genes
The gene structures of CaGRAS genes were determined by comparing the coding sequences with the corresponding full-length genic sequences, using the Gene Structure Display Server (Hu et al. 2015). The physical locations of GRAS genes on the chickpea chromosomes were extracted from the genomic database at NCBI. The visualization of distribution of CaGRAS genes across the chickpea genome was done using the MapChart tool (Voorrips 2002).
To infer the syntenic relationship of the GRAS genes in different species (Arabidopsis thaliana, Cajanus cajan, Cicer arietinum, Glycine max and Medicago truncatula) an analysis using the MCScanX algorithm was performed and plots were generated using the Dual Synteny Plotter function in TBtools (Chen et al. 2020). For this purpose, the genome sequence files and the gene annotation files were retrieved from NCBI. The assembly accessions of the files were GCF_000331145.1 (Cicer arietinum), GCF_000001735.4 (Arabidopsis thaliana), GCF_003473485.1 (Medicago truncatula), GCA_000004515.5 (Glycine max) and GCF_000340665.1 (Cajanus cajan). The duplicated genes were identified using the MCScanX algorithm. The Ka/Ks (non-synonymous/ synonymous substitution rates) ratios of the duplicated genes were calculated to study the molecular evolutionary rates for each gene pair through TBtools. The divergence time of these gene pairs was estimated using the formula “t = Ks/2r”, with r (1.5 × 10⁻⁸) representing neutral substitution. This was expressed in ‘million years ago’ (Mya).
Phylogenetic tree analysis
A total of 200 GRAS proteins were analysed for phylogeny. These belonged to Glycine max (117), Arabidopsis thaliana (37) and Cicer arietinum (46). These were aligned through multiple sequence alignment (MSA) using the Muscle tool. MEGA7 was used to construct the phylogenetic tree with bootstrapping for 1000 replicates and with the following main parameters: p distance and pairwise deletion (https://www.megasoftware.net/). The CaGRAS proteins were classified into different GRAS subfamilies based on the records of the Arabidopsis AtGRAS proteins in the TAIR database (https://www.arabidopsis.org/) and also as per the previously identified subfamily members in soybean (Wang et al. 2020b). The phylogenetic tree was visualized through iTOL v 6.1.1 (Letunic and Bork 2019).
Differential gene expression analysis of CaGRAS genes
Transcriptome data derived from root tissues which were collected at flowering (50 DAS) and podding or pod formation stages (70 DAS), for the two varieties ICC 4958 and ICC 1882, exposed to drought stress, were accessed from NCBI GEO datasets (BioProject ID: PRJNA288321, Garg et al. 2016). The FPKM (Fragments per kilobase of transcript per million mapped reads) values derived from RNA-Seq data, were converted to log 2 FC for the CaGRAS loci, for generation of the heatmap. The heatmap depicting the differential expression of the CaGRAS genes was drawn by the software TBtools. The genes with a log 2 FC ≥ 2 were considered to be upregulated (overexpressed) and those with a log 2 FC ≤ − 2 were considered to be downregulated (underexpressed).
Identification of drought-responsive CaGRAS genes through qRT-PCR
Total RNA was isolated from frozen root and leaf tissues using Spectrum™ Plant Total RNA Kit (Sigma Life Science). The isolated RNA was eluted in 50 µl of DEPC treated water. It was quantified using Nanodrop spectrophotometer (NanoDrop™ Lite Spectrophotometer, Thermo Fisher Scientific). The quality of RNA was estimated by the A260/280 ratios. The RNA was converted into cDNA by cDNA synthesis kit (Invitrogen™SuperScript™ III First-Strand Synthesis System) following the manufacturer’s instructions. Real-time quantitative PCR (qRT-PCR) was performed using SYBR Green mix (TaKaRa) on a Real-Time PCR Thermocycler (Eppendorf RealPlex 2 qPCR). The following thermal cycling conditions were used: 94 °C for 10 min, 40 cycles with each cycle consisting of 94 °C for 30 sec and 60 °C for 15 sec, followed by melting curve analysis. The gene expression analysis was carried for seven CaGRAS genes. Three biological replicates were included for each treatment, each consisting of three technical replicates (2 × 2 × 3 × 3 samples). The relative fold differences were calculated based on the comparative Ct method using the 2 − △△Ct method (Livak and Schmittgen 2001), using the GAPDH gene as an internal reference gene. T test was conducted to study the statistical significance of the results. All the primer sequences for qRT-PCR are listed in Supplementary Table1.
Results
Soil moisture content (SMC)
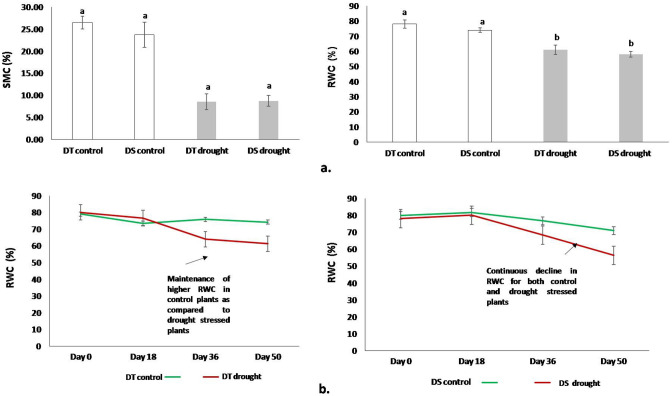
It has been reported in various crop species that a SMC, varying from 25 to 30% of SMC at FC (field capacity), can be considered as severe drought stress (Pang et al. 2017). Since the drought stress has been quantified based on the % age of SMC at FC, it was important to first determine the SMC at field capacity. This was estimated to be 30% (calculated separately). The SMC in control pots was maintained at ~ 80–90% of SMC at field capacity (FC) and that of drought stress treatment pots at ~ 30% of SMC at FC (Fig. 1a). These conditions simulated the terminal drought stress conditions in chickpea, as the soil moisture content was allowed to decrease post-flowering and this was continued until the end of the growing season.
Fig. 1.
a The changes in SMC and RWC, in response to drought stress conditions for the two genotypes, ICC 4958 (drought tolerant, DT) and ICC 1882 (drought sensitive, DS). The control and drought stressed plants, for both the genotypes, were 126 days old. The RWC and SMC values were estimated just before harvesting the plants. The control plants for both the genotypes were well-watered but the drought stressed plants were exposed to drought stress conditions for 50 days by withholding water. Bar graphs indicate an average of five biological replicates. Vertical bars represent the mean ± SE. Statistical significance was tested by one-way ANOVA followed by Tukey’s post hoc test. The different letters above each column represent significant difference at p < 0.01. b The decline in RWC of plants, monitored over a period of 50 days after stress initiation; Day 0 is the day of drought stress initiation, when the plants were 76 days old; vertical bars indicate ± SEM
Relative water content (RWC)
The RWC of the plants was used as an indicator for the quantification of drought stress during the entire experimental period. The control plants maintained a higher RWC than the drought stressed plants for both the genotypes. A steep decline in RWC was observed after 18 days of stress treatment. While, the control plants of ICC 4958 (DT) were able to maintain nearly constant RWC levels, the control ICC 1882 (DS) plants showed a significant decline in RWC levels throughout the plant growth. At the end of the stress period, an average RWC reduction of 15–20% in treated plants, compared to control plants (p < 0.01), was achieved for both the genotypes (Fig. 1).
Characterization of root morphological traits
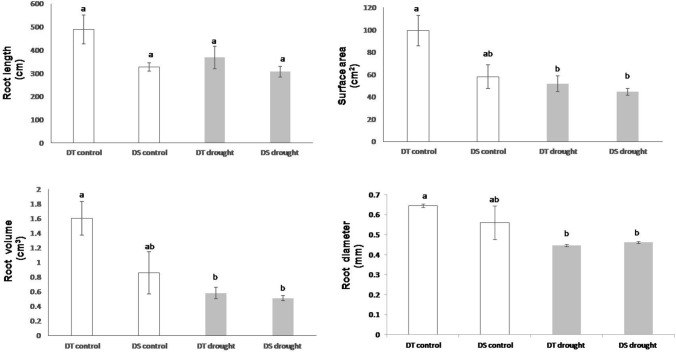
It was observed that the roots of the drought sensitive genotype (ICC 1882) were approximately 30% smaller than the drought tolerant genotype (ICC 4958). The root length, surface area and root volume of the roots were reduced in the treated plants compared to the control plants for both the genotypes. Application of drought stress resulted in a significant reduction in surface area and root volume, by 50% and 60%, respectively, in plants exposed to drought stress, over the control plants, for the tolerant genotype ICC 4958 (p < 0.05) (Fig. 2). However, for the drought stress treated plants, there was very little difference in the root diameter, for both the tolerant and sensitive genotypes, as compared to the control plants.
Fig. 2.
Differences in root morphological characters in control and treated plants, in response to drought stress conditions, for the two genotypes ICC 4958 (DT) and ICC 1882 (DS). Error bars indicate standard errors of means of five biological replicates. Statistical significance was tested by one-way ANOVA followed by Tukey’s post hoc test. The different letters above each column represent significant difference at p < 0.05
Identification and structural analysis of CaGRAS genes
The HMMER search using PF03154.11 (pfam database) as a query, led to the identification of a total of 56 CaGRAS proteins. Three proteins amongst these did not contain the characteristic GRAS domain and were, therefore, removed. An examination of the remaining 53 proteins resulted in the identification of 46 GRAS genes. The seven additional proteins were found to be the splice variants originating from seven GRAS loci. In total thus, 46 CaGRAS genes were identified which encoded for 53 GRAS proteins.
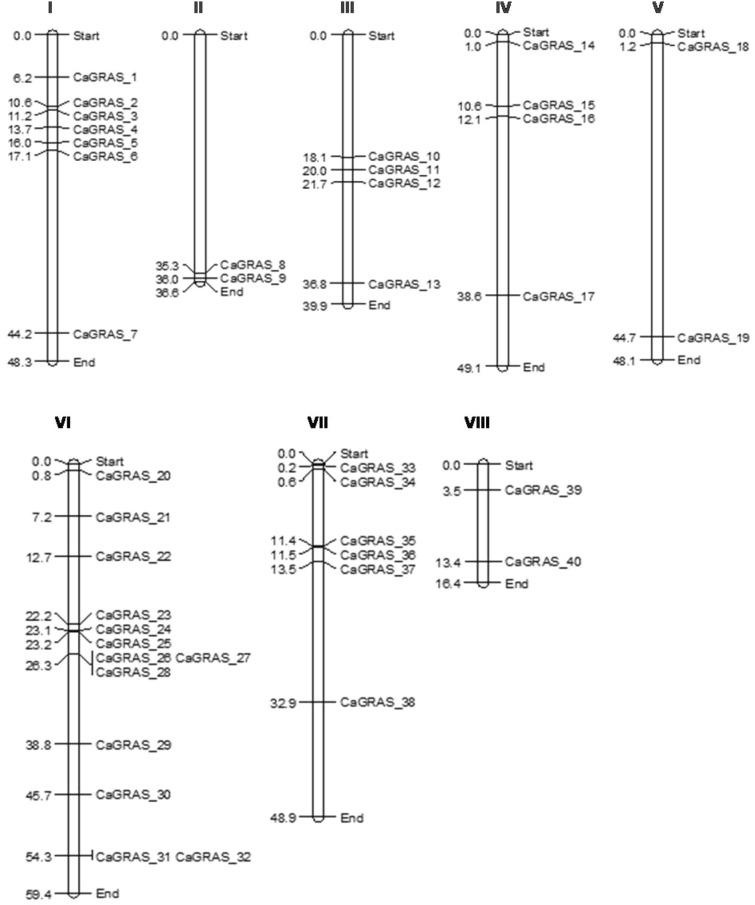
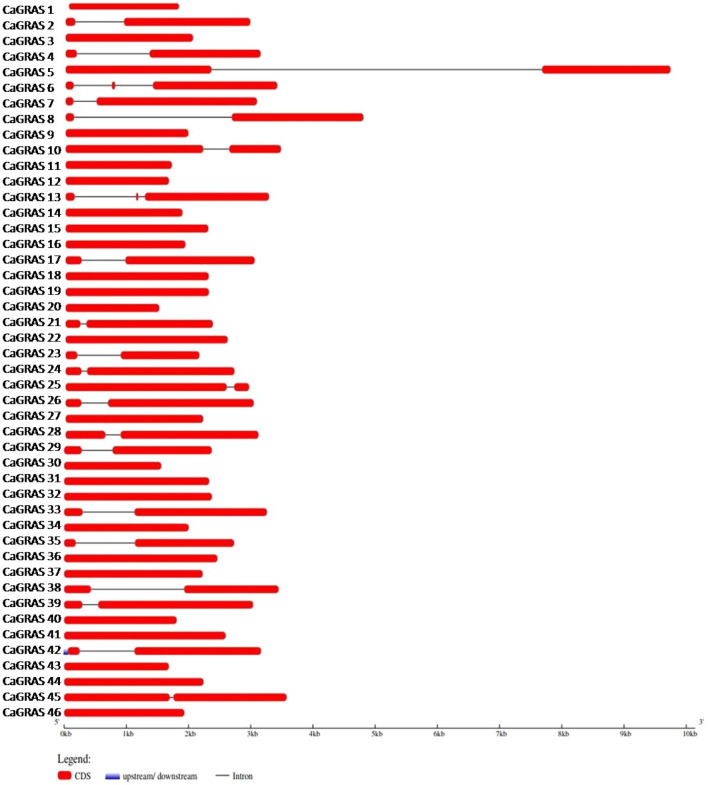
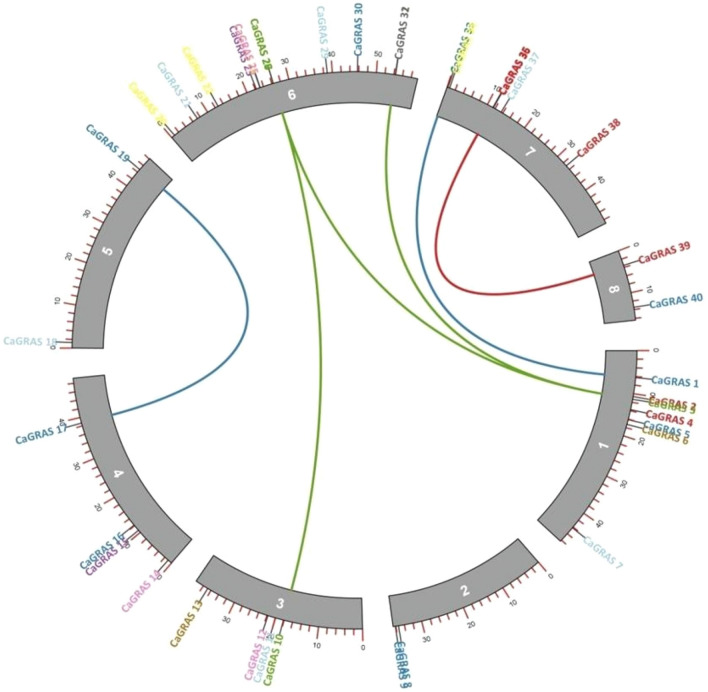
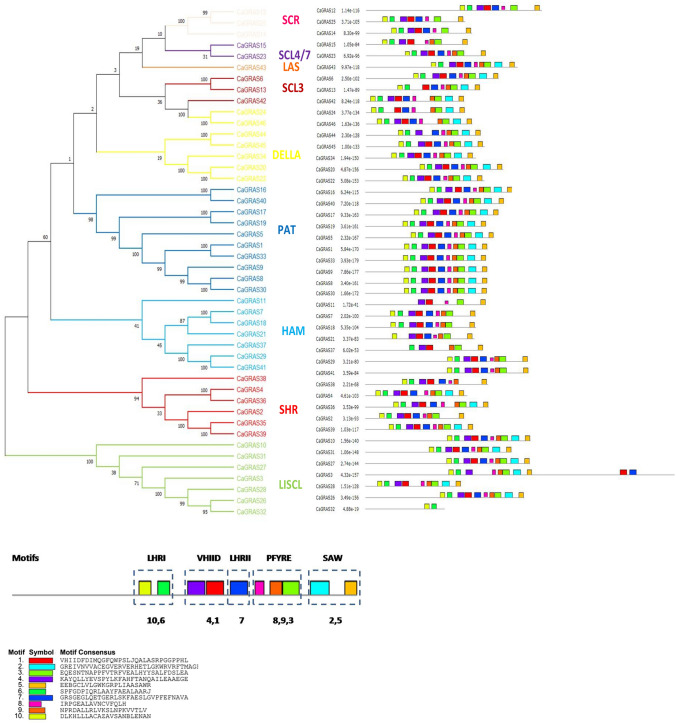
Out of the 46 CaGRAS genes, 40 could be mapped to the chickpea chromosomes while the remaining 6 mapped to unplaced scaffolds in the assembly. The highest number of GRAS genes were identified on chromosome 6 (13) and the least number (2) on chromosomes 2, 5 and 8. The CaGRAS genes were named based on their linear order on the chromosomes, with the CaGRAS 1 gene being present at the first position on chromosome 1 (Fig. 3). This was done in accordance with the naming pattern adopted for the GRAS genes in Medicago truncatula (Zhang et al. 2017) and Tartary buckwheat (Liu et al. 2019). The number of introns in the CaGRAS genes ranged from 0 to 3. More than half the genes were found to be intronless (24/46). Twenty genes contained a single intron and two genes contained two introns (Fig. 4). Majority of the PAT gene subfamily were mono-exonic. A list of all the CaGRAS genes and their chromosomal locations is provided in Supplementary Table 2. The gene and protein sequences of the identified CaGRAS genes are given as Supplementary Information.
Fig. 3.
Positions of the CaGRAS genes on chickpea chromosomes. The numbers on the left indicate the physical positions of the CaGRAS genes in Mb (megabases). The numbers on the top panel represent the chromosome number. Six genes were mapped on scaffolds which are not depicted here
Fig. 4.
Exon–intron structure of the CaGRAS genes. The lengths of the exons and introns were drawn to scale
Synteny and gene duplication
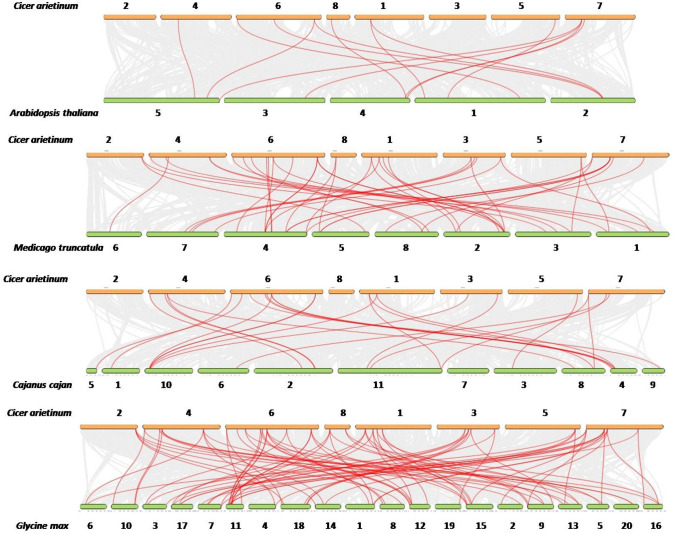
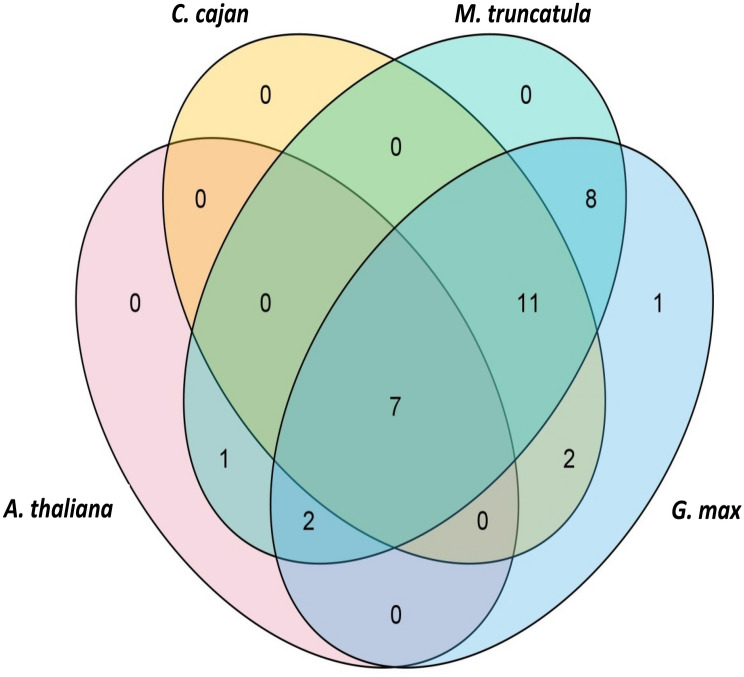
The number of syntenic GRAS gene pairs identified in Arabidopsis thaliana, Medicago truncatula, Cajanus cajan and Glycine max were 13, 46, 25 and 81, respectively (Fig. 5). Seven CaGRAS genes were found to have syntenic genes in all the four species examined, i.e., CaGRAS 3, CaGRAS 16, CaGRAS 19, CaGRAS 20, CaGRAS 31, CaGRAS 36 and CaGRAS 37 (Fig. 6, Supplementary Table 3). This indicates that the GRAS genes might have evolved from a common ancestor in different plant species. Gene duplication analysis led to the identification of six duplicated CaGRAS gene pairs within the chickpea genome (Fig. 7). Since these belonged to different chromosomes, it could be inferred that these genes underwent segmental duplications. These results suggest that the expansion of the GRAS gene family in chickpea is due to segmental duplication events rather than tandem duplication events. The Ka/Ks ratios for all these gene pairs were < 1 (Table 1). This indicates the possibility of the existence of negative selective pressure or purifying selection, which is associated with the protein sequences. The approximate time of origin of the CaGRAS genes ranges from somewhere between 10.96 million years ago (Mya) (Ks = 0.85) and 28.16 Mya (Ks = 2.19).
Fig. 5.
Synteny analyses of the GRAS genes between chickpea and A. thaliana, M. truncatula, C. cajan and G. max. The collinear blocks between genomes are depicted by the gray lines. The syntenic GRAS gene pairs are highlighted with the red lines. The numbers indicate the chromosome numbers in the genomes
Fig. 6.
The GRAS syntenic gene pairs identified between chickpea and A. thaliana, M. truncatula, C. cajan and G. max. Seven GRAS genes were identified to be conserved in all the species examined
Fig. 7.
The distribution of CaGRAS genes across the chickpea chromosomes with duplicated CaGRAS gene pairs connected by solid lines. The green lines depict the LISCL genes, blue lines the PAT genes and red line indicates genes belonging to the SHR subfamily
Table 1.
Detailed information of duplication events among the identified CaGRAS genes in chickpea
| S. No | Gene 1 | Gene 2 | Chromosome localization | Duplication event | Ka | Ks | Ka/Ks | Time (Mya) |
|---|---|---|---|---|---|---|---|---|
| 1 | CaGRAS 3 | CaGRAS 28 | 1,6 | Segmental | 0.24 | 1.02 | 0.23 | 13.19 |
| 2 | CaGRAS 3 | CaGRAS 31 | 1,6 | Segmental | 0.27 | 1.12 | 0.24 | 14.38 |
| 3 | CaGRAS 1 | CaGRAS 33 | 1,7 | Segmental | 0.21 | 1.09 | 0.19 | 14.06 |
| 4 | CaGRAS 10 | CaGRAS 26 | 3,6 | Segmental | 0.49 | 2.19 | 0.22 | 28.16 |
| 5 | CaGRAS 17 | CaGRAS 19 | 4,5 | Segmental | 0.14 | 0.85 | 0.16 | 10.96 |
| 6 | CaGRAS 35 | CaGRAS 39 | 7,8 | Segmental | 0.20 | 0.88 | 0.22 | 11.31 |
Ka indicates the non-synonymous substitutions per non-synonymous site, Ks indicates synonymous substitutions per synonymous site, T approximate time of the duplication event, Mya million years ago
In silico characterization of CaGRAS proteins and sequence homology
The length of the CaGRAS proteins ranged from 358 to 1415 amino acids. The theoretical pI of the proteins ranged from 4.87 to 7.63, with an average of 5.75 indicating that these proteins are weakly acidic at physiological pH (Supplementary Table 2). All the proteins possessed the GRAS domain at the C-terminal ends. The length of the GRAS domain ranged from 60 amino acids to 420 amino acids. The CaGRAS 3 protein consisted of two such domains and was, therefore, the largest GRAS protein that was identified (1,415 amino acids long). Similar GRAS proteins containing two GRAS domains have also been found in tomato (Huang et al. 2015). An additional DELLA domain was found to be present at the N terminal end of three GRAS proteins. In addition to the LHRI, VHIID, LHRII, PFYRE and SAW motifs present in the GRAS domain, a few other sequence motifs were identified at the N terminal ends of the proteins, such as WIYLD, EDR1, etc. The LHRI, VHIID, LHRII, PFYRE and SAW motifs were further composed of submotifs. The LHRI motif consisted of the submotifs 10 and 6; the VHIID motif consisted of the submotifs 4 and 1; the LHRII motif consisted of the submotif 7; the PFYRE motif consisted of submotifs 8, 9 and 3; the SAW motif comprised of submotifs 2 and 5 (Fig. 8). The VHIID motif was the most conserved with a sequence identity of 27%, followed by the SAW (25%) and PFYRE motifs (24%). The LHRI motif was the least conserved with an identity of 15%. SCR, SCL4/7 and HAM subfamilies lacked the submotif 2 of the SAW motif. This submotif (RVER) has also been found missing in the HAM subfamily in rice and Arabidopsis (Tian et al. 2004). From the motif analysis, it could be identified that the CaGRAS 32 protein did not have all the conserved sequence motifs but it was still considered to be a putative GRAS protein as it had the GRAS domain at the C-terminal end.
Fig. 8.
The distribution of conserved motifs in CaGRAS proteins. Neighbor-joining tree of CaGRAS proteins is shown on the left. Numbers at the nodes indicate bootstrap values. CaGRAS proteins are categorized into nine distinct clusters namely SCR, SCL4/7, LAS, SCL3, DELLA, PAT, HAM, SHR and LISCL. The horizontal coloured boxes indicate conserved motifs within each protein with description of the consensus sequences
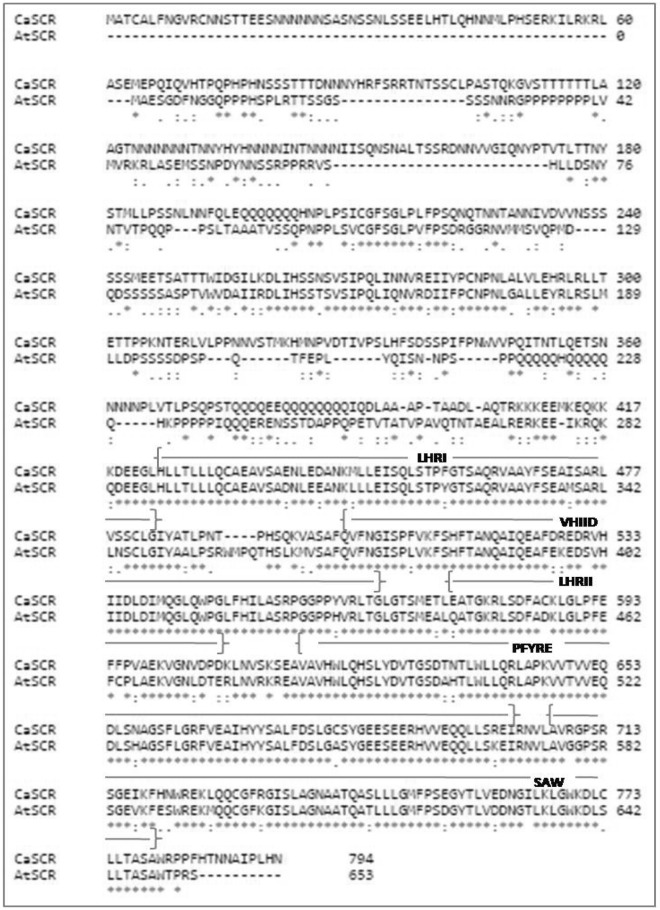
To examine the sequence conservation of the motifs, the Arabidopsis thaliana scarecrow protein (NP_190990.1) was aligned with the chickpea scarecrow protein (XP_004492611, CaGRAS 12). There was 62.69% of sequence identity between the two proteins. Most of the variability was confined to the N terminal sequence and a high degree of sequence conservation was observed at the C-terminal region (Fig. 9). It could possibly hint towards a similar biological function of the two proteins. The vast majority of the CaGRAS proteins were predicted to be localized in the nucleus. This reconfirms the cellular function for these proteins as putative TFs. However, a few of them were also predicted to be localized in the cytoplasm and plasma membrane (Supplementary Table 2).
Fig. 9.
Sequence alignment of the Arabidopsis and chickpea (CaGRAS 12) SCR proteins, with details of the conserved sequence motifs present, i.e., LHRI, VHIID, LHRII, PFYRE and SAW. *indicates positions which have a single, fully conserved residue; : indicates conservation between groups of strongly similar properties
Protein–protein interaction network
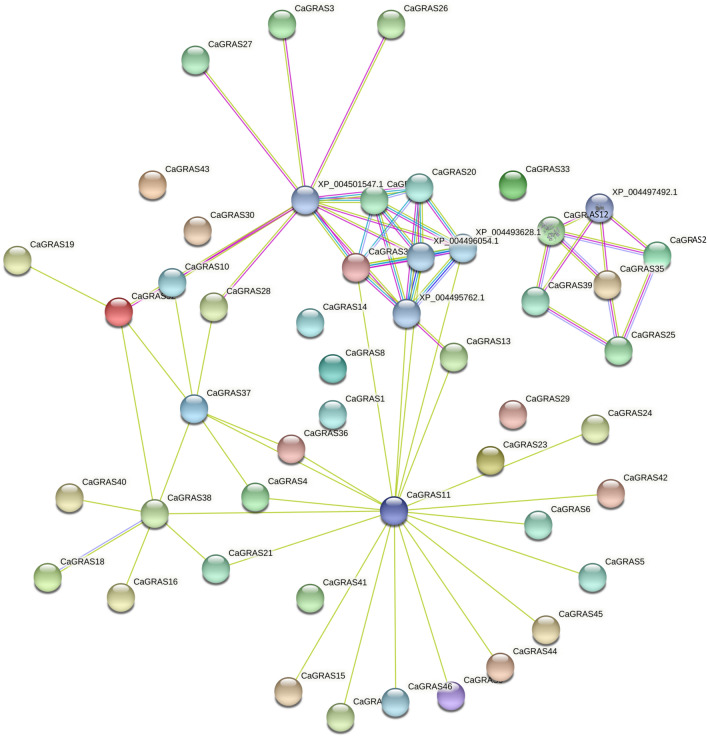
The interaction network depicting the functional and physical interactions between the CaGRAS proteins consisted of 49 nodes and 70 edges with a PPI enrichment p value of < 1.0 × 10⁻¹⁶ (Fig. 10). The predicted functional partners of the proteins were majorly GID1 like gibberellins receptor proteins with confidence scores > 0.9. The interaction between CaGRAS 12 (scarecrow) and CaGRAS 39 (shortroot) had a confidence score of 0.869. Putative homologs of these proteins have been found to be interacting in Arabidopsis thaliana. A module involving interaction between CaGRAS 25 (SCR), CaGRAS 35 (SHR), CaGRAS 39 (SHR), CaGRAS 2 (SHR), CaGRAS 12 (SCR) with a putative zinger finger protein was observed. From the protein–protein interaction, it can be inferred that CaGRAS 11 (HAM) could be a vital member of the chickpea GRAS TF family interacting with many other members of the GRAS family. However, further experimental validation is required to prove this contention.
Fig. 10.
The protein interaction networks of the CaGRAS proteins. The experimentally validated interactions, as reported in previously published papers, are represented with pink edges. The filled nodes depict the proteins with known 3D structures
Phylogenetic analysis
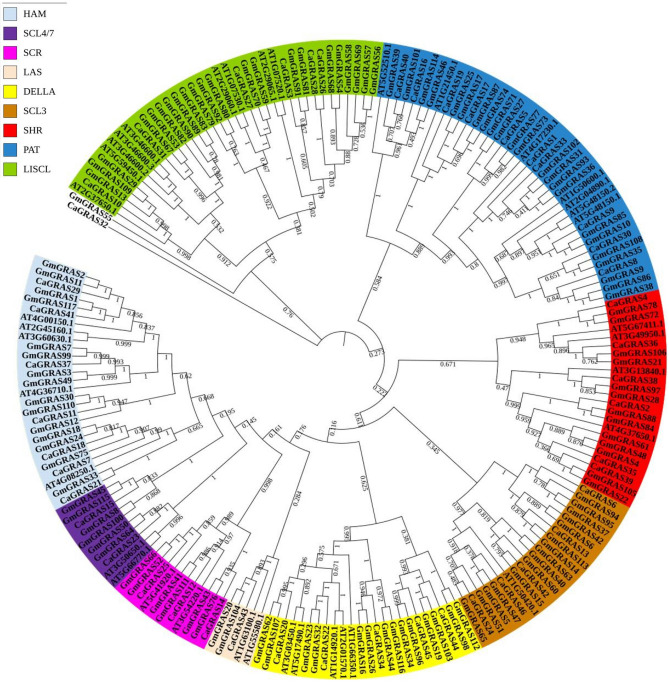
To analyse the phylogenetic relationship between the GRAS proteins, a phylogenetic tree was constructed using the reported Arabidopsis thaliana (37) and Glycine max (117) GRAS proteins. Based on this analysis, the CaGRAS proteins could be classified into nine subfamilies, i.e., DELLA, HAM, LAS, LISCL, PAT, SCL3, SCL4/7, SCR and SHR (Fig. 11). The PAT subfamily consisted of the maximum number of proteins (10) followed by the LISCL, DELLA and HAM subfamilies with 7 members each. The LAS subfamily consisted of only a single protein (CaGRAS 43). These numbers are similar to the number of members described in different GRAS subfamilies in Brassica napus (Guo et al. 2019). CaGRAS 32 could not be classified into any of the subfamilies, based on the phylogeny with Arabidopsis and soybean. However, it was placed in the LISCL subfamily based on its sequence similarity with other LISCL CaGRAS proteins (Fig. 8).
Fig. 11.
Phylogenetic relationships of GRAS proteins from Arabidopsis thaliana, Cicer arietinum and Glycine max. The proteins are clustered into nine subfamilies, represented in nine different colours. Numbers at the nodes indicate bootstrap values
Differential gene expression analysis
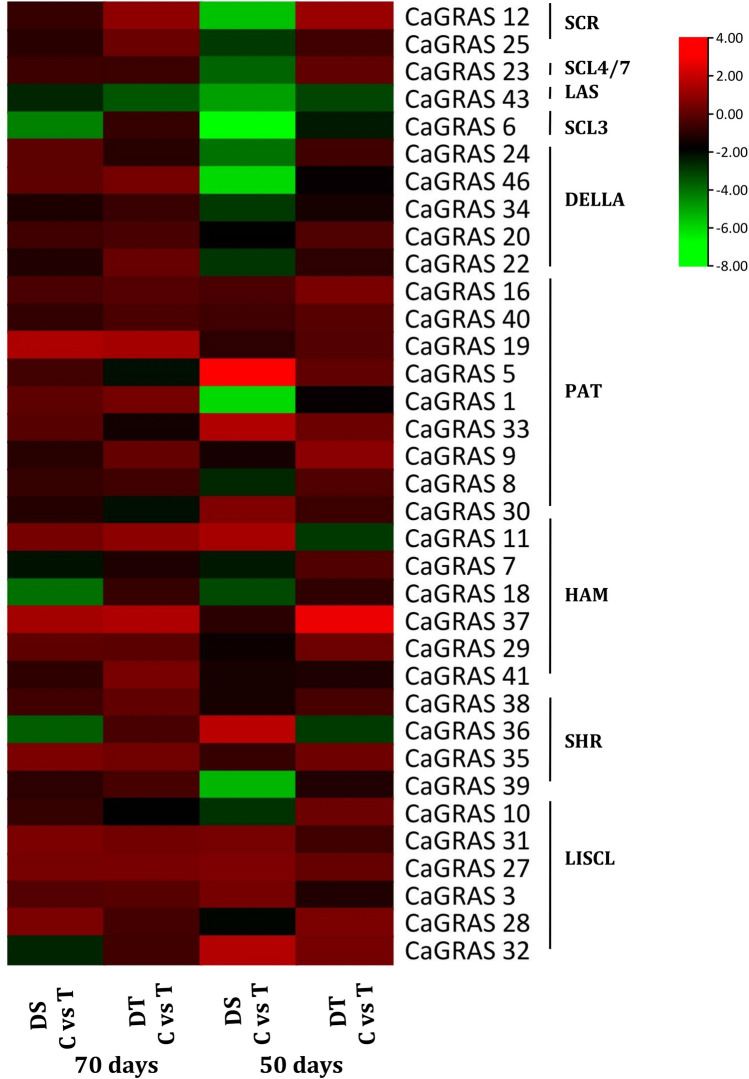
Differential gene expression analysis resulted in the identification of a higher number of differentially expressed CaGRAS genes (18) for the tissues collected at 50 DAS (vegetative stage) compared to the 70 days (podding stage) samples (8). Also, higher differences in gene expression were observed for the DS (drought sensitive, ICC 1882) genotype in comparison with the DT (drought tolerant, ICC 4958) genotype for both time points. For the 50 days time point, a total of 16 DEGs were identified in the DS genotype (DS C vs T) while 4 DEGs were identified for the DT genotype (DT C vs T). For the 70 days time point, 6 and 3 DEGs were identified for the DS and DT genotypes, respectively. The gene expression levels of the CaGRAS genes were thus observed to vary with the developmental stage and the external environmental conditions. The genes which are differentially expressed between the DS T vs DT T, reflect the genotype specific response to drought stress conditions. The genes CaGRAS 6 (SCL3) and CaGRAS 36 (SHR) were upregulated with a FC > 5 and 4, respectively, in the DT genotype compared to the DS genotype, when exposed to drought stress (Fig. 12). Amongst the different CaGRAS subfamilies, the genes belonging to the DELLA and PAT subfamilies showed the highest degree of differential regulation in response to the drought stress treatment.
Fig. 12.
Gene expression profiles of CaGRAS genes in root tissues in plants subjected to drought stress treatment; DT: drought tolerant variety; DS: drought sensitive variety; the FPKM values were transformed into log2FC and comparisons between the control (C) and stress (T) conditions were made for each of the genotypes
Expression of CaGRAS genes in chickpea in response to drought stress
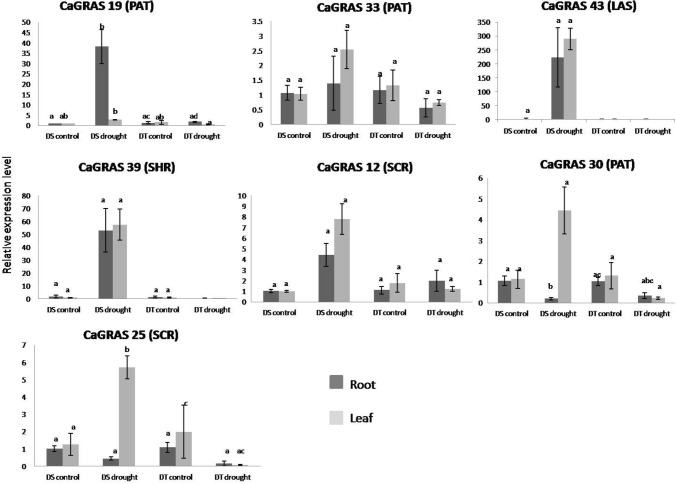
Further, to identify the drought-responsive CaGRAS TF genes in chickpea qRT-PCR was performed (Fig. 13). The qRT-PCR results indicated an upregulation of CaGRAS 19 (PAT) in the root and CaGRAS 43 (LAS) in both root and leaf tissues, of the DS genotype in response to drought stress. The expression of the CaGRAS 12 (SCR) gene was upregulated in the root tissues of both DS and DT genotypes in response to drought stress, albeit to a lesser extent in the DT genotype. However, it was downregulated in leaf tissues of the DT genotype on exposure to drought stress whereas a similar pattern of expression was observed in the leaf tissues of the DS genotype as was observed in the root tissues of this genotype.
Fig. 13.
Gene expression patterns of 7 CaGRAS genes in leaf and root tissues, estimated by qRT-PCR analysis for the DT: drought tolerant variety; DS: drought sensitive variety. The relative expression levels which were normalized to GAPDH were determined by the comparative CT method (2 − ΔΔCT). Three biological and technical replicates were used for each experiment. Error bars indicate standard errors of means. The different letters above each column represent significant difference at p < 0.05
Discussion
Drought is one of the most damaging abiotic stress factors, which severely limits chickpea production across the world. It has been reported that drought stress in chickpea, can lead to yield losses as high as 45–50% (Kaloki et al. 2019). Differences in root system architecture play critical roles in the differential response of varieties to drought. The presence of a deeper rooting system is considered to be a desired trait in conferring drought tolerance (Purushothaman et al. 2017). Genes governing root traits are regulated by a gamut of transcription factors. A TF family, members of which have been reported to have important roles in the root elongation and patterning, is the GRAS TF family. The SCL3, SCR and SHR subfamilies of the GRAS family of TFs are involved in the regulation of root cell elongation and stem cell maintenance during both root and shoot development (Zhang et al. 2017). In the present study, a total of 46 GRAS genes were identified in the chickpea genome. This number is comparable to the number of GRAS genes identified in castor bean (46), but lesser than those in rice (60) and other legumes like Medicago (59) and soybean (117). The significantly higher number of GRAS genes identified in soybean is possibly because of the genome duplication of soybean twice, which has led to the duplication of as high as 75% of soybean genes (Bhattacharjee et al. 2015). The other possible reasons for variations in the number of GRAS genes could be due to differences in genome sizes and the differences in the number of annotated protein-coding genes in the assemblies. All the CaGRAS proteins contained the typical C-terminal conserved GRAS domain and varied in size from 358 to 1415 amino acids. This range is well within the range of protein length described for GRAS proteins in other plant species like M. truncatula, Z. mays, G. max, etc. (Zhang et al. 2017; Guo et al. 2017; Cenci and Rouard 2017). The GRAS domain was composed of conserved sequence motifs namely the LHRI, VHIID, LHRII, PFYRE and SAW motifs. In terms of sequence identity, the VHIID motif was found to be the most conserved. The highest degree of sequence conservation of the VHIID motif is suggestive of its critical importance in governing the functional activities of the CaGRAS proteins. Notably, one of the GRAS proteins, CaGRAS 32 did not contain the VHIID, LHRII, PFYRE and SAW motifs, however, it showed a 62% sequence identity, with more than 88% of coverage with scarecrow like protein of Medicago truncatula (e value = 2 × 10–120). This provided compelling evidence for this protein to be considered as a GRAS protein in chickpea. With regards to the conserved motifs, it was observed that the PAT subfamily of proteins possessed all the conserved motifs of the GRAS domain whereas the SCR, SCL4/7 and HAM subfamilies were the most variable in terms of motif conservation. The PAT subfamily identified in Capsicum annuum also had the highest conservation of sequence motifs compared to the other nine subfamilies identified (Liu et al. 2018). In addition to the GRAS domain, a few members of the DELLA subfamily contained the N terminal DELLA domain. DELLA proteins are gibberellin-responsive negative regulators of growth-related proteins. The gibberellin receptor GID 1 forms a complex with DELLA proteins and targets them for proteolysis. The interacting partners of these DELLA proteins identified were GID like receptor proteins (XP_004493628.1, XP_004495762.1, XP_004496054.1) with a confidence score as high as 0.941. This validates the identity of DELLA proteins and is indicative of their possible function in gibberellin signaling pathways in chickpea. However, not all the DELLA CaGRAS proteins possessed the DELLA domain. A possible reason for this could have been the loss of the DELLA domain in these proteins as has been observed in rice for the DELLA proteins Os01g45860 and Os05g49930 (Cenci and Rouard 2017).
A high degree of synteny was observed between the GRAS genes in chickpea and soybean with as many as 81 pairs of syntenic genes. In contrast, 13 pairs of syntenic GRAS genes were identified between chickpea and Arabidopsis. This is in concurrence with the syntenic relationship described for the F-box genes of chickpea with Arabidopsis thaliana, Medicago truncatula and soybean (Gupta et al. 2015). Seven CaGRAS genes were found to have a syntenic relationship with genes of all the four species, i.e., A. thaliana, C. cajan, G. max and M. truncatula. Three of these genes, CaGRAS 3 (LISCL), CaGRAS 19 (PAT) and CaGRAS 31 (LISCL) were also found to be duplicated within the chickpea genome. This is suggestive of a similar and conserved molecular function of these genes across the species. Duplications were mostly observed for the LISCL and PAT genes. The higher number of these proteins, amongst the GRAS subfamilies, reported in different plant species, can thus be explained based on higher duplication events within these gene families. There were no tandem duplications identified for the CaGRAS genes within the chickpea genome. The absence of tandem duplications in the proliferation of a multigene family has been previously reported in case of the Nuclear Factor –Y (NF –Y) TF family in chickpea (Chu et al. 2018) and homeobox gene family in soybean (Bhattacharjee et al. 2015). It has been purported that the absence of tandem duplications within gene families allows retention of duplicated genes in the genome, which might otherwise be lost. The functional redundancy of these genes, however, cannot be ruled out. Out of the six pairs of duplicated genes, for two pairs of genes, the expression profile was different between the individual members of the duplicated gene pair (CaGRAS 1/CaGRAS 33; CaGRAS 35/CaGRAS 39). This could possibly be due to different evolutionary outcomes of the genes, with them acquiring different functions over the course of evolution (Zhang et al. 2017).
The two genotypes ICC 4958 (DT) and ICC 1882 (DS) exhibited differential drought responsiveness. For plants subjected to drought stress, for both the genotypes there was very little reduction in RWC for the initial 18 days after onset of stress. For the DS variety, the RWC of both the well-watered and drought stressed plants was almost equal for the initial 18 days after the water was withheld. Since ICC 1882 lagged in its flowering and its pace of attaining maturity was lower compared to ICC 4958, it, therefore, maintained a higher RWC initially. It was around this time (18 days and beyond) that the RWC began to decline for both the genotypes for the drought stressed plants. Beyond the 18 days point, there was a steeper reduction in RWC of drought stressed plants for the DS genotype compared to the DT genotype. Chickpea being a hardy crop in terms of drought resilience can withstand drought for longer periods and hence there is a delayed onset of RWC reduction. In other plants like wheat and tobacco, this begins as early as 4–6 days after drought stress initiation (Weng et al. 2015; Su et al. 2017). In chickpea, it has been observed that there is a progressive reduction in the fraction of transpirable soil water (FTSW), which is the plant available soil moisture, starting from the day of water being withheld for plants 100 DAS, up until an average of 20 days, when there is the highest reduction in FTSW (Pang et al. 2017). However, the threshold FTSW is dependent on the genotype but the range is expected to remain similar. Given that the same amount of irrigation was supplied to the control plants for the two genotypes, the DT control plants were able to maintain a higher RWC than the DS control plants throughout the experiment.
Under terminal drought conditions, where plants depend heavily on stored soil moisture for survival, root traits have a significant impact on drought tolerance. At the end of the experimental period, it was observed that there was a higher percentage reduction in root length, surface area and volume for the tolerant genotype under drought stress compared to the drought sensitive genotype. The differential root growth behaviour of these genotypes has been previously described by Purushothaman et al. 2017. It has been demonstrated that the roots of ICC 4958, the DT variety, grow and proliferate at a much faster pace and by 35 DAS the roots become well established. For ICC 1882, however, the highest root growth is observed at a much later stage, i.e., pod filling stage. Since, the drought was imposed at 76 DAS, after flowering was initiated in ICC 4958, the roots of ICC 4958 were most likely already developed unlike ICC 1882. It is speculated that since ICC 4958 attained physiological maturity much before ICC 1882, its roots had already set in for death, by the time the plants were harvested (126 DAS). This could be the reason for the observed differences in the reduction of traits like root length (RL), surface area (SA) and root volume (RV) between the DS and DT varieties, when exposed to drought stress conditions. However, unlike other traits like RL, SA and RV, the root diameter did not change significantly between the drought stressed and control plants, for both the genotypes. This could be due to the “agravitropic” growth response of roots, where the root length decreases but the diameter increases, under depleting soil moisture conditions. A similar observation has been reported in chickpea plants that were subjected to salinity stress. It was observed that when two chickpea genotypes, JG 11 and ICCV 2, contrasting for salt stress tolerance were grown under salinity stress, there was an increased growth in root diameter while the root length reduced in both genotypes (Kaashyap et al. 2018).
The gene expression patterns of the CaGRAS genes for root tissues collected at 50 and 70 days of crop growth, was found to be significantly different for the PAT and DELLA subfamilies of the CaGRAS genes. These genes showed a greater change in gene expression in general for the two genotypes between the two time points. This suggests possible roles of proteins involved in phytochrome A and gibberellin signaling during prolonged drought stress. The DELLA proteins are known to promote the survival of plants under stress conditions by minimizing the accumulation of ROS within the cells, thus delaying cell death (Zawaski and Busov 2014). The relative abundance of the DELLA proteins in the roots of the DT variety compared to the DS variety (as inferred from the transcriptome data) might confer an improved tolerance to the DT variety to drought stress. The CaGRAS 12 gene (SCR) was found to be overexpressed in the DT variety compared to the DS variety in response to drought stress treatment at 50 days. However, this was not entirely validated in the qPCR results, where it was observed that the gene was overexpressed in roots of both the DS and DT varieties in response to drought stress, albeit with a higher FC in the DS variety. In the leaf tissues, the gene was overexpressed in response to drought stress in the DS variety but underexpressed in the DT variety when exposed to drought stress. The in silico protein–protein interaction analysis revealed an interaction between the SCR and SHR proteins and a zinc finger protein, JACKDAW-like. This protein is known to regulate the expression of SCR and SHR genes, thereby controlling the asymmetric cell division (Welch et. al. 2007). The SCR and SHR proteins are also known to regulate the development of root apical meristem in Arabidopsis (Giovanna et al. 2018). It can, therefore, be concluded that the CaGRAS 12 (SCR) gene is a drought-responsive TF gene in chickpea roots. The upregulation of the majority of GRAS genes, examined through qRT-PCR in the DS variety could be the possible reasons for the lesser reduction in root length, volume and surface area in the DS variety compared with the DT variety. A similar observation was also reported on analysis of RNA-Seq data generated from the roots of DS and DT “kabuli” chickpea varieties. It was observed that the GRAS TF genes were upregulated in the roots of Hashem (DS variety) while no upregulation of these genes was observed in the roots of Bivanij, the DT variety (Mahdavi Mashaki et al. 2018).
Therefore, it can be concluded that drought tolerance in chickpea is governed by many TFs, the GRAS family of TFs being one of them. The genes belonging to the SCR, SHR and SCL3 are differentially expressed in response to drought in the roots and can therefore, be used as potential candidate genes for enhancing drought tolerance in chickpea breeding programs.
Conclusion
The present study describes the genome-wide identification of GRAS genes in chickpea. The expression analysis of these genes has led to the identification of drought-responsive CaGRAS genes. A deeper, more profuse root system is a desirable trait, which has been shown to confer drought tolerance in crop plants. The GRAS genes might have putative roles in governing root system architecture and therefore, can serve as potential candidate genes for developing varieties with deeper and more prolific rooting system, which consequently also have improved drought tolerance.
Supplementary Information
Below is the link to the electronic supplementary material.
Acknowledgements
The authors would like to thank the Director, ICAR-NIPB for constant support and guidance.
Author contributions
Conceptualization and experimental design SY, VP and PKJ, laboratory work and statistical analysis SY, YKY, DK, SM, manuscript preparation and editing was performed by all the authors.
Funding
We gratefully acknowledge the financial support from NAHEP-CAAST to SY and DST-SERB (CRG/2019/006643) to PKJ.
Availability of data and material
Not applicable.
Code availability
Not applicable.
Declarations
Conflict of interest
The authors declare that they have no conflict of interest in the publication.
Accession numbers
The FPKM values from RNA-seq. data were retrieved from NCBI Geo data set BioProject ID: PRJNA288321.
References
- Agarwal G, Garg V, Kudapa H, Doddamani D, Pazhamala LT, Khan AW, Thudi M, Lee SH, Varshney RK. Genome-wide dissection of AP2/ERF and HSP90 gene families in five legumes and expression profiles in chickpea and pigeonpea. Plant Biotechnol J. 2016;14(7):1563–1577. doi: 10.1111/pbi.12520. [DOI] [PMC free article] [PubMed] [Google Scholar]
- Ambawat S, Sharma P, Yadav NR, Yadav RC. MYB transcription factor genes as regulators for plant responses: an overview. Physiol Mol Biol Plants. 2013;19(3):307–321. doi: 10.1007/s12298-013-0179-1. [DOI] [PMC free article] [PubMed] [Google Scholar]
- Bailey TL, Boden M, Buske FA, Frith M, Grant CE, Clementi L, Ren J, Li WW, Noble WS. MEME SUITE: tools for motif discovery and searching. Nucleic Acids Res. 2009;37(Web Server):W202–W208. doi: 10.1093/nar/gkp335. [DOI] [PMC free article] [PubMed] [Google Scholar]
- Barrs HD, Weatherley PE. A re-examination of the relative turgidity technique for estimating water deficit in leaves. Aust J Biol Sci. 1962;15:413–428. doi: 10.1071/BI9620413. [DOI] [Google Scholar]
- Bhattacharjee A, Ghangal R, Garg R, Jain M. Genome-wide analysis of homeobox gene family in legumes: identification, gene duplication and expression profiling. PLoS ONE. 2015;10:e0119198. doi: 10.1371/journal.pone.0119198. [DOI] [PMC free article] [PubMed] [Google Scholar]
- Bjellqvist B, Hughes G, Pasquali C, Nicole P, Florence R, SanchezJean-Charles FS, Denis H. The focusing positions of polypeptides in immobilized pH gradients can be predicted from their amino acid sequences. Electrophoresis. 1993;14:1023–1031. doi: 10.1002/elps.11501401163. [DOI] [PubMed] [Google Scholar]
- Black CA. Methods of soil analysis: part I physical and mineralogical properties, including statistics of measurement and sampling. Madison: American Society of Agronomy; 1965. [Google Scholar]
- Cenci A, Rouard M. Evolutionary analyses of GRAS transcription factors in angiosperms. Front Plant Sci. 2017;8:273. doi: 10.3389/fpls.2017.00273. [DOI] [PMC free article] [PubMed] [Google Scholar]
- Chen CJ, Chen H, Zhang Y, Thomas HR, Frank MH, He YH, Xia R. TBtools—an integrative toolkit developed for interactive analyses of big biological data. Mol Plant. 2020;13(8):1194–1202. doi: 10.1016/j.molp.2020.06.009. [DOI] [PubMed] [Google Scholar]
- Chu HD, Nguyen KH, Watanabe Y, Le DT, Pham TL, Mochida K, Tran LS. Identification, structural characterization and gene expression analysis of members of the nuclear factor-Y family in chickpea (Cicer arietinum L.) under dehydration and abscisic acid treatments. Int J Mol Sci. 2018;19:3290. doi: 10.3390/ijms19113290. [DOI] [PMC free article] [PubMed] [Google Scholar]
- Garg R, Shankar R, Thakkar B, Kudapa H, Krishnamurthy L, Mantri N, Varshney RK, Bhatia S, Jain M. Transcriptome analyses reveal genotype- and developmental stage-specific molecular responses to drought and salinity stresses in chickpea. Sci Rep. 2016;6:19228. doi: 10.1038/srep19228. [DOI] [PMC free article] [PubMed] [Google Scholar]
- Giovanna DR, Riccardo DM, Raffaele DI. Building the differences: a case for the ground tissue patterning in plants. Proc R Soc B. 2018;285:20181746. doi: 10.1098/rspb.2018.1746. [DOI] [PMC free article] [PubMed] [Google Scholar]
- Goossens J, Fernández-Calvo P, Schweizer F, Goossens A. Role and functioning of bHLH transcription factors in jasmonate signalling. J Exp Bot. 2017;68:1333–1347. doi: 10.1093/jxb/erw440. [DOI] [PubMed] [Google Scholar]
- Guo Y, Wu H, Li X, Li Q, Zhao X, Duan X, An Y, Lv W, An H. Identification and expression of GRAS family genes in maize (Zea mays L.) PLoS ONE. 2017;12(9):e0185418. doi: 10.1371/journal.pone.0185418. [DOI] [PMC free article] [PubMed] [Google Scholar]
- Guo P, Wen J, Yang J, Ke Y, Wang M, Liu M, Ran F, Wu Y, Li P, Li J, Du H. Genome-wide survey and expression analyses of the GRAS gene family in Brassica napus reveals their roles in root development and stress response. Planta. 2019;250:1051–1072. doi: 10.1007/s00425-019-03199-y. [DOI] [PubMed] [Google Scholar]
- Gupta S, Garg V, Kant C, Bhatia S. Genome-wide survey and expression analysis of F-box genes in chickpea. BMC Genomics. 2015;16:67. doi: 10.1186/s12864-015-1293. [DOI] [PMC free article] [PubMed] [Google Scholar]
- Ha CV, Nasr Esfahani M, Watanabe Y, Tran UT, Sulieman S, Mochida K, Van Dong N, Lam-Son TP. Genome-wide identification and expression analysis of the CaNAC family members in chickpea during development, dehydration and ABA treatments. PLoS ONE. 2014;9(12):e114107. doi: 10.1371/journal.pone.0114107. [DOI] [PMC free article] [PubMed] [Google Scholar]
- Hu B, Jin J, Guo AY, Zhang H, Luo J, Gao G. GSDS 2.0: an upgraded gene feature visualization server. Bioinformatics. 2015;31(8):1296–1297. doi: 10.1093/bioinformatics/btu817. [DOI] [PMC free article] [PubMed] [Google Scholar]
- Huang W, Xian Z, Kang X, Tang N, Li Z. Genome-wide identification, phylogeny and expression analysis of GRAS gene family in tomato. BMC Plant Biol. 2015;15:209. doi: 10.1186/s12870-015-0590-6. [DOI] [PMC free article] [PubMed] [Google Scholar]
- Huang W, Peng S, Xian Z, Lin D, Hu G, Yang L, Ren M, Li Z. Overexpression of a tomato miR171 target gene SlGRAS24 impacts multiple agronomical traits via regulating gibberellin and auxin homeostasis. Plant Biotechnol J. 2016;15(4):472–488. doi: 10.1111/pbi.12646. [DOI] [PMC free article] [PubMed] [Google Scholar]
- Jin JP, Tian F, Yang DC, Meng YQ, Kong L, Luo JC, Gao G. PlantTFDB 4.0: toward a central hub for transcription factors and regulatory interactions in plants. Nucleic Acids Res. 2017;45(D1):D1040–D1045. doi: 10.1093/nar/gkw982. [DOI] [PMC free article] [PubMed] [Google Scholar]
- Kaashyap M, Ford R, Kudapa H, Jain M, Edwards D, Varshney R, Mantri N. Differential regulation of genes involved in root morphogenesis and cell wall modification is associated with salinity tolerance in chickpea. Sci Rep. 2018;8:4855. doi: 10.1038/s41598-018-23116-9. [DOI] [PMC free article] [PubMed] [Google Scholar]
- Kaloki P, Devasirvatham V, Tan DK. Chickpea abiotic stresses: combating drought, heat and cold. In: de Oliveira AB, editor. Abiotic and biotic stress in plants. London: Intech; 2019. [Google Scholar]
- Kumar K, Srivastava V, Purayannur S, Kaladhar VC, Cheruvu PJ, Verma PK. WRKY domain-encoding genes of a crop legume chickpea (Cicer arietinum): comparative analysis with Medicago truncatula WRKY family and characterization of group-III gene (s) DNA Res. 2016;23(3):225–239. doi: 10.1093/dnares/dsw010. [DOI] [PMC free article] [PubMed] [Google Scholar]
- Letunic I, Bork P. Interactive Tree Of Life (iTOL) v4: recent updates and new developments. Nucleic Acids Res. 2019;47(W1):W256–W259. doi: 10.1093/nar/gkz239. [DOI] [PMC free article] [PubMed] [Google Scholar]
- Li P, Zhang B, Su T, Li P, Xin X, Wang W, Zhao X, Yu Y, Zhang D, Yu S, Zhang F. BrLAS, a GRAS transcription factor from Brassica rapa, is involved in drought stress tolerance in transgenic Arabidopsis. Front Plant Sci. 2018;9:1792. doi: 10.3389/fpls.2018.01792. [DOI] [PMC free article] [PubMed] [Google Scholar]
- Liu B, Sun Y, Xue J, Jia X, Li R. Genome-wide characterization and expression analysis of GRAS gene family in pepper (Capsicum annuum L.) PeerJ. 2018;6:4796. doi: 10.7717/peerj.4796. [DOI] [PMC free article] [PubMed] [Google Scholar]
- Liu M, Huang L, Ma Z, Sun W, Wu Q, Tang Z, Bu T, Li C, Chen H. Genome-wide identification, expression analysis and functional study of the GRAS gene family in Tartary buckwheat (Fagopyrumtataricum) BMC Plant Biol. 2019;19:342. doi: 10.1186/s12870-019-1951-3. [DOI] [PMC free article] [PubMed] [Google Scholar]
- Livak KJ, Schmittgen TD. Analysis of relative gene expression data using realtime quantitative PCR and the 2−ΔΔCT method. Methods. 2001;25(4):402–408. doi: 10.1006/meth.2001.1262. [DOI] [PubMed] [Google Scholar]
- Mahdavi Mashaki K, Garg V, Nasrollahnezhad Ghomi AA, Kudapa H, Chitikineni A, Zaynali Nezhad K, Yamchi A, Soltanloo H, Varshney RK, Thudi M. RNA-Seq analysis revealed genes associated with drought stress response in kabuli chickpea (Cicer arietinum L.) PLoS ONE. 2018;13(6):e0199774. doi: 10.1371/journal.pone.0199774. [DOI] [PMC free article] [PubMed] [Google Scholar]
- Pang J, Turner NC, Du Y-L, Colmer TD, Siddique KHM. Pattern of water use and seed yield under terminal drought in chickpea genotypes. Frontiers in Plant Science. 2017;8:1375. doi: 10.3389/fpls.2017.01375. [DOI] [PMC free article] [PubMed] [Google Scholar]
- Phukan UJ, Jeena GS, Shukla RK. WRKY transcription factors: molecular regulation and stress responses in plants. Front Plant Sci. 2016;7:760. doi: 10.3389/fpls.2016.00760. [DOI] [PMC free article] [PubMed] [Google Scholar]
- Prince VE, Pickett FB. Splitting pairs: the diverging fates of duplicated genes. Nat Rev Genet. 2002;3:827–837. doi: 10.1038/nrg928. [DOI] [PubMed] [Google Scholar]
- Purushothaman R, Krishnamurthy L, Upadhyaya HD, Vadez V, Varshney RK. Root traits confer grain yield advantages under terminal drought in chickpea (Cicer arietinum L.) Field Crop Res. 2017;201:146–161. doi: 10.1016/j.fcr.2016.11.004. [DOI] [PMC free article] [PubMed] [Google Scholar]
- Saxena NP, Krishnamurthy L, Johansen C. Registration of a drought-resistant Chickpea Germplasm. Crop Sci. 1993;33:1424. doi: 10.2135/cropsci1993.0011183X003300060088x. [DOI] [Google Scholar]
- Sbabou L, Bucciarelli B, Miller S, Liu J, Berhada F, Filali-Maltouf A, Allan D, Vance C. Molecular analysis of SCARECROW genes expressed in white lupin cluster roots. J Exp Bot. 2010;61:1351–1363. doi: 10.1093/jxb/erp400. [DOI] [PMC free article] [PubMed] [Google Scholar]
- Su X, Wei F, Huo Y, Xia Z. Comparative physiological and molecular analyses of two contrasting flue-cured tobacco genotypes under progressive drought stress. Front Plant Sci. 2017;8:827. doi: 10.3389/fpls.2017.00827. [DOI] [PMC free article] [PubMed] [Google Scholar]
- Tian C, Wan P, Sun S, Li J, Chen M. Genome-wide analysis of the GRAS gene family in rice and Arabidopsis. Plant Mol Biol. 2004;54:519–532. doi: 10.1023/B:PLAN.0000038256.89809.57. [DOI] [PubMed] [Google Scholar]
- Voorrips RE. MapChart: software for the graphical presentation of linkage maps and QTLs. J Hered. 2002;93(1):77–78. doi: 10.1093/jhered/93.1.77. [DOI] [PubMed] [Google Scholar]
- Wang TT, Yu TF, Fu JD, Su HG, Chen J, Zhou YB, Chen M, Guo J, Ma YZ, Wei WL, Xu ZS. Genome-wide analysis of the GRAS gene family and functional identification of GmGRAS37 in drought and salt tolerance. Front Plant Sci. 2020;11:604690. doi: 10.3389/fpls.2020.604690. [DOI] [PMC free article] [PubMed] [Google Scholar]
- Wang L, Ding X, Gao Y, Yang S. Genome-wide identification and characterization of GRAS genes in soybean (Glycine max) BMC Plant Biol. 2020;20:415. doi: 10.1186/s12870-020-02636-5. [DOI] [PMC free article] [PubMed] [Google Scholar]
- Welch D, Hassan H, Blilou I, Immink R, Heidstra R, Scheres B. Arabidopsis JACKDAW and MAGPIE zinc finger proteins delimit asymmetric cell division and stabilize tissue boundaries by restricting SHORT-ROOT action. Genes Dev. 2007;21(17):2196–2204. doi: 10.1101/gad.440307. [DOI] [PMC free article] [PubMed] [Google Scholar]
- Weng M, Cui L, Liu F, Zhang M, Shan L, Yang S, Deng X. Effects of drought stress on antioxidant enzymes in seedlings of different wheat genotypes. Pak J Bot. 2015;47(1):49–56. [Google Scholar]
- Xie Z, Nolan TM, Jiang H, Yin Y. AP2/ERF transcription factor regulatory networks in hormone and abiotic stress responses in Arabidopsis. Front Plant Sci. 2019;10:228. doi: 10.3389/fpls.2019.00228. [DOI] [PMC free article] [PubMed] [Google Scholar]
- Xu K, Chen S, Li T, Ma X, Liang X, Ding X, Liu H, Luo L. OsGRAS23, a rice GRAS transcription factor gene, is involved in drought stress response through regulating expression of stress-responsive genes. BMC Plant Biol. 2015;15:141. doi: 10.1186/s12870-015-0532-3. [DOI] [PMC free article] [PubMed] [Google Scholar]
- Zawaski C, Busov VB. Roles of gibberellin catabolism and signaling in growth and physiological response to drought and short-day photoperiods in Populus trees. PLoS ONE. 2014;9(1):e86217. doi: 10.1371/journal.pone.0086217. [DOI] [PMC free article] [PubMed] [Google Scholar]
- Zhang H, Cao Y, Shang C, Li J, Wang J, Wu Z, Ma L, Qi T, Fu C, Bai Z, Hu B. Genome-wide characterization of GRAS family genes in Medicago truncatula reveals their evolutionary dynamics and functional diversification. PLoS ONE. 2017;12(9):e0185439. doi: 10.1371/journal.pone.0185439. [DOI] [PMC free article] [PubMed] [Google Scholar]
Associated Data
This section collects any data citations, data availability statements, or supplementary materials included in this article.
Supplementary Materials
Data Availability Statement
Not applicable.
Not applicable.


