

Abstract
Objective: To compare the prognostic factors of Siewert type II AEG patients who had received neoadjuvant radiotherapy (nRT) versus those who did not receive nRT. Nomograms for outcome prediction were constructed for the two treatment modalities. Materials and methods: Data for 1,745 Siewert II type AEG patients who underwent radical surgery between 2010 and 2015 were retrieved from SEER (Surveillance, Epidemiology, and End Results) database. Patients were assigned to neoadjuvant radiotherapy (nRT) and non-neoadjuvant radiotherapy (non-nRT) groups based on treatment modality. Independent prognostic predictors were used to develop nomograms. Concordance index (C-index), receiver operating characteristic (ROC), calibration curves, and decision curve analyses (DCA) were used to determine the performance and prognostic value of the nomograms. The predictive accuracy of nomograms was compared with the prognostic value of the Tumor-Node-Metastasis (TNM) staging system. Results: The results showed that age, lymph node rate (LNR), and the number of removed lymph nodes (RLN) were independent prognostic factors for CSS in the nRT group. Tumor size, tumor grade, T stage, LNR, and therapy type were independent prognosis factors for CSS in patients in the non-nRT group. The C-indices for the nomograms were 0.652 (95% CI, 0.614-0.690) and 0.663 (95% CI, 0.606-0.720) in the training and validation cohort, respectively, for the nRT group. C-indices for the nomogram in non-nRT group were 0.754 (95% CI, 0.723-0.785) and 0.747 (95% CI, 0.688-0.800) for the training and validation cohorts, respectively. C-indices and ROC curves showed good predictive value compared with the TNM staging system in both groups. C-indices, as well as the AUC values of the nomograms and the TNM staging system for both cohorts in the non-nRT group were higher compared with those in the nRT group. Analysis of the survival calibration curve revealed high consistency between actual versus predicted outcomes determined by the nomograms. Decision curve analyses revealed that the new models had higher prediction value and clinical significance compared with TNM staging system. Conclusion: The established nomograms showed high prognostic value for Siewert type II AEG patients in both nRT and non-nRT groups. In addition, the nomogram and the TNM staging systems showed better prognostic performance for patients in the non-nRT group compared with patients in the nRT group.
Keywords: Esophagogastric junction adenocarcinoma, neoadjuvant radiotherapy, cancer specific survival, prognosis, nomogram, SEER
Introduction
Incidence of adenocarcinoma affecting the esophagogastric junction (AEG) has significantly increased for decades [1,2]. The Siewert method shows that the Type I AEG tumors have an epicenter approximately 1-5 cm above the esophagogastric junction (EGJ), while the type II AEGs have epicenter between 1 cm above and 2 cm below the EGJ, whereas that of type III AEGs is about 2-5 cm below the EGJ [3]. Siewert type II tumors are referred as positive AEG cases and effective treatment methods have not been fully explored [4]. Surgical resection is the conventional curative treatment for AEG [5], however, it is associated with poor prognosis [6]. Combined modality therapy enhances AEG survival which is superior to use of resection alone [7]. The CROSS trial reported higher survival rates for advanced esophageal cancer patients who underwent preoperative chemoradiotherapy compared to those undergone surgery alone [8]. Currently, advanced Siewert type II AEG is mainly treated using neoadjuvant chemoradiotherapy plus surgery in the US [9].
The tumor-node-metastasis (TNM) staging system developed by AJCC (American Joint Committee on Cancer) is conventionally used for evaluation of cancer prognosis. Distinct staging groups including pathologic staging (pTNM) and post-neoadjuvant pathologic staging (ypTNM) are used in the 8th edition staging system [10]. Notably, preoperative radiotherapy allows clinical downstaging and thus improving R0 resection [11,12]. However, it can lead to disappearance of anatomical markers in postoperative pathological specimens and induce histological changes [13,14]. Therefore, the prognostic value of pathological staging after neoadjuvant radiotherapy is poor and effective methods should be explored. In addition, other independent prognostic factors such as sex, age, and tumor size may significantly affect survival prediction. Prognosis heterogeneity exists even among patients with the same TNM stage. Nomograms allow for individualized survival prediction and exhibit higher accuracy compared with traditional TNM staging in various cancers [15,16].
Although population-based studies have explored prognostic factors in Siewert II AEG patients, prognostic factors in Siewert type II AEG patients who received neoadjuvant radiotherapy have not been compared with those who have not received neoadjuvant radiotherapy [17,18]. In the current study, data were retrieved from SEER (Surveillance, Epidemiology and End Results) to explore potential prognostic factors for Siewert II AEG patients. Independent prognostic factors were used to develop nomograms and the prognostic value was compared with that of the TNM staging system.
Materials and methods
Patient selection and ethics statement
SEER is a public database that comprises clinical and survival data from 18 population-based cancer registries, representing approximately 28% of cancer patients in the US [19]. SEER*stat software (version 8.3.8) was used for data retrieval (https://seer.cancer.gov/data-software/). Data were deposited anonymously and publicly accessible, therefore, ethical approval was not required. Patients diagnosed with Siewert type II AEG who underwent primary resection and regional lymph nodes dissection between January 2010 and December 2015 were included in the study. Although the SEER database did not provide detailed information on Siewert AEG classification, Siewert type II patients with ‘Primary Site’ classified as ‘Cardia, and NOS’ and ‘collaborative staging (CS) Schema V0204’ classified as ‘EsophagusGEJunction’ were selected [20,21]. Patient inclusion criteria were as follows: (1) patients with histologically confirmed AEG (codes for adenocarcinoma subtypes were 8140-8147, 8160-8162, 8180-8221, 8250-8507, 8514-8551, 8571-8574, 8576, and 8940-8941 based on ICD-O-3) [22], (2) patients who had undergone radical surgery (surgery encode 30-80), (3) patients who had undergone regional lymph node dissection, and (4) patients with no distant metastasis. Patients with multiple primary tumors, patients with missing or with unknown clinical records, and patients with follow-up time <1 month were excluded from the study. Patient selection procedure is presented as a flowchart in Figure S1.
Data collection
Data retrieved from the database included: age at diagnosis, race (black, white, and others), gender, tumor grade, T stage, N stage, TNM stage, tumor size, number of removed lymph nodes (RLN), number of positive lymph nodes, primary site surgery, radiation status, radiation sequence, chemotherapy status, cause-specific death classification, and survival time. Notably, the 7th edition TNM staging was adopted from 2010, therefore, patients diagnosed before 2010 were excluded from analysis. Patients diagnosed after 2015 were also excluded to ensure adequate follow-up time. Histological grade for AEG was reclassified using 8th edition TNM staging system as follows: G1: well differentiated, G2: moderately differentiated, G3: poorly differentiated and undifferentiated, GX: grade cannot be assessed. Lymph node ratio (LNR) of each patient was calculated by comparing the number of positive lymph node relative to the total number of dissected lymph nodes. A total of 1745 patients met the inclusion criteria thus they were included in the study. X-tile was used to determine optimal cutoff values for age (47 and 71 years), tumor size (29 and 42 mm), RLN (16), and LNR (10% and 30%) (Figure S2). Patients were assigned to neoadjuvant radiotherapy (nRT) and non-neoadjuvant radiotherapy (non-nRT) groups based on the treatment method. The 8th TNM stages for the nRT group were obtained from the pathological information of patients and the 8th AJCC edition staging guidelines. The 8th TNM stages were not determined in the non-nRT group because information on the period the patients received chemotherapy (concurrent with radiation, adjuvant after surgery, or both) was not available in SEER database [10]. The endpoint in this study was cancer-specific survival (CCS), which was defined as the time between surgery and cancer-related death or time of last follow-up. The 3- and 5-year CSS rates for the two groups were calculated at the same time. The final follow-up was conducted in September 2016.
Statistical analysis
Patients in the nRT and non-nRT groups were randomly assigned to a training cohort (used to construct the nomogram) and a validation cohort (used to validate the model built by the training cohort) at a 7:3 ratio. Comparison between the validation cohort and the training cohort in the two groups was conducted using chi-square tests and represented as χ2. Univariate and multivariate Cox regression analyses were performed for both the nRT and non-nRT groups to identify independent prognostic variables associated with patient CSS. Hazard ratios (HRs) and 95% confidence intervals (CIs) were estimated from the model. Two-tailed P≤0.05 was considered statistically significant. A nomogram was constructed using the multivariate analysis results. Performance of the nomogram was explored by evaluation of the discrimination ability, calibration evaluation, and determination of the clinical significance. Discrimination ability of the nomogram was evaluated using Harrell’s concordance index (C-index) and receiver operating characteristic (ROC) curves. Differences of the C-index between the nomogram and TNM system were explored using rcorrp.cens package in R. Calibration curves were generated to compare predicted and observed probability. Decision curve analysis (DCA) was used to determine clinical value of the nomogram. Prognostic value of TNM staging system in the two groups was explored through Kaplan-Meier (KM) analysis and compared by log-rank test. Statistical analyses were performed on R version 4.0.3.
Results
Characteristics of patients
A total of 1,745 patients diagnosed with Siewert type II AEG were retrieved from the 2010-2015 SEER database. Notably, 823 patients were assigned to the nRT group and 576 were randomized into the training group whereas 247 were enrolled in into the validation group. Out of the 922 patients in the non-nRT group, 645 patients were assigned to the training cohort whereas 277 patients were assigned to the validation cohort. All patients in the nRT group received neoadjuvant radiotherapy combined with chemotherapy. In non-nRT group, 210 patients (22.8%) received adjuvant radiotherapy (aRT) combined with chemotherapy (CT), 266 (28.8%) received chemotherapy alone, and 446 (48.4%) patients did not receive adjuvant therapy. Demographic and clinical characteristics of patients in the 2 groups were not significantly different between the validation and training cohorts (P≥0.05). Median CSS rates of patients in nRT group and non-nRT group were 24 and 27 months, respectively. Treatment data, clinicopathological and demographic characteristics of patients in the two cohorts for the 2 groups are presented in Table 1.
Table 1.
Demographic, clinicopathological characteristics and treatment information of the training and validation cohorts
| Patient characteristics | nRT group (n=823) | non-NRT group (n=922) | ||||||
|---|---|---|---|---|---|---|---|---|
|
|
|
|||||||
| Training cohort n=576 | validation cohort n=247 | χ2 | P | Training cohort n=645 | validation cohort n=277 | χ2 | P | |
| Age, years | 2.789 | 0.248 | 2.507 | 0.286 | ||||
| <50 | 65 (11.3) | 34 (13.8) | 56 (8.7) | 33 (11.9) | ||||
| 50-71 | 429 (74.5) | 170 (68.8) | 416 (64.5) | 176 (63.5) | ||||
| >71 | 82 (14.2) | 43 (17.4) | 173 (26.8) | 68 (24.5) | ||||
| Gender | 0.088 | 0.766 | 0.021 | 0.886 | ||||
| Female | 91 (15.8) | 37 (15.0) | 119 (18.4) | 50 (18.1) | ||||
| Male | 485 (84.2) | 210 (85.0) | 526 (81.6) | 227 (81.9) | ||||
| Race | 1.487 | 0.475 | 0.386 | 0.825 | ||||
| Black | 22 (3.8) | 8 (3.2) | 36 (5.6) | 14 (5.1) | ||||
| White | 514 (89.2) | 227 (91.9) | 539 (83.6) | 236 (85.2) | ||||
| Others | 40 (6.9) | 12 (4.9) | 70 (10.9) | 27 (9.7) | ||||
| Grade | 3.263 | 0.353 | 0.938 | 0.816 | ||||
| G1 | 24 (4.2) | 10 (4.0) | 44 (6.8) | 19 (6.9) | ||||
| G2 | 200 (34.7) | 102 (41.3) | 228 (35.3) | 105 (37.9) | ||||
| G3 | 299 (51.9) | 115 (46.6) | 351 (54.4) | 146 (52.7) | ||||
| GX | 53 (9.2) | 20 (8.1) | 22 (3.4) | 7 (2.5) | ||||
| T stage | 1.052 | 0.789 | 2.387 | 0.496 | ||||
| T1 | 10 (1.7) | 6 (2.4) | 199 (30.9) | 87 (31.4) | ||||
| T2 | 82 (14.2) | 40 (16.2) | 94 (14.6) | 45 (16.2) | ||||
| T3 | 441 (76.6) | 184 (74.5) | 305 (47.3) | 132 (47.7) | ||||
| T4 | 43 (7.5) | 17 (6.9) | 47 (7.3) | 13 (4.7) | ||||
| N stage | 5.166 | 0.160 | 0.972 | 0.808 | ||||
| N0 | 162 (28.1) | 77 (31.2) | 294 (45.6) | 134 (48.4) | ||||
| N1 | 275 (47.7) | 99 (40.1) | 153 (23.7) | 63 (22.7) | ||||
| N2 | 108 (18.8) | 51 (20.6) | 101 (15.7) | 44 (15.9) | ||||
| N3 | 31 (5.4) | 20 (8.1) | 97 (15.0) | 36 (13.0) | ||||
| RLN | 0.201 | 0.654 | 0.804 | 0.370 | ||||
| <16 | 291 (50.5) | 129 (52.2) | 289 (44.8) | 133 (48.0) | ||||
| ≥33 | 285 (49.5) | 118 (47.8) | 356 (55.2) | 144 (52.0) | ||||
| Tumor size, mm | 4.354 | 0.113 | 0.417 | 0.812 | ||||
| <29 | 159 (27.6) | 73 (29.6) | 265 (41.1) | 108 (39.0) | ||||
| 29-42 | 191 (33.2) | 64 (25.9) | 164 (25.4) | 71 (25.6) | ||||
| >42 | 226 (39.2) | 110 (44.5) | 216 (33.5) | 98 (35.4) | ||||
| LNR, % | 3.317 | 0.190 | 2.224 | 0.329 | ||||
| <10 | 394 (68.4) | 167 (67.6) | 396 (61.4) | 179 (64.6) | ||||
| 10-30 | 117 (20.3) | 42 (17.0) | 117 (18.1) | 53 (19.1) | ||||
| >30 | 65 (11.3) | 38 (15.4) | 132 (20.5) | 45 (16.2) | ||||
| Therapy type | 0.400 | 0.819 | ||||||
| nRT+CT | 576 (100) | 247 (100) | ||||||
| aRT+CT | 145 (22.5) | 65 (23.5) | ||||||
| CT | 190 (29.5) | 76 (27.4) | ||||||
| none | 310 (48.1) | 136 (49.1) | ||||||
| TNM 7th stage | 7.451 | 0.281 | 8.778 | 0.186 | ||||
| IA | 12 (2.1) | 6 (2.4) | 113 (17.5) | 55 (19.9) | ||||
| IB | 24 (4.2) | 13 (5.3) | 85 (13.2) | 27 (9.7) | ||||
| IIA | 10 (1.7) | 9 (3.6) | 25 (3.9) | 10 (3.6) | ||||
| IIB | 170 (29.5) | 64 (25.9) | 112 (17.4) | 67 (24.2) | ||||
| IIIA | 216 (37.5) | 82 (33.2) | 116 (18.0) | 44 (15.9) | ||||
| IIIB | 97 (16.8) | 44 (17.8) | 73 (11.3) | 31 (11.2) | ||||
| IIIC | 47 (8.2) | 29 (11.7) | 121 (18.8) | 43 (15.5) | ||||
| TNM 8th stage | 6.694 | 0.153 | ||||||
| I | 46 (8.0) | 28 (11.3) | ||||||
| II | 113 (19.6) | 47 (19.0) | ||||||
| IIIA | 57 (9.9) | 17 (6.9) | ||||||
| IIIB | 313 (54.3) | 126 (51.0) | ||||||
| IVA | 47 (8.2) | 29 (11.7) | ||||||
Abbreviations: LNR, lymph node metastasis; RLN, number of removed lymph nodes; nRT, neoadjuvant radiotherapy; aRT, adjuvant radiotherapy; CT, chemotherapy.
Factors affecting the prognosis of patients in the training cohort
Univariate analysis showed that age, N stage, LNR, and RLN were potential prognostic markers for the CSS of patients in the nRT group (P≤0.05). Findings from multivariate analysis showed that age, LNR and RLN were independent predictors of CSS of patients in nRT group (Figure 1). Race, T stage, N stage, tumor grade, LNR, tumor size, and therapy type were potential predictors for CSS of patients in the non-nRT group (P≤0.05). However, multivariate analysis showed that only T stage, tumor grade, LNR, tumor size, and therapy type were independent predictors of CSS of patients in the non-nRT group (Figure 2).
Figure 1.
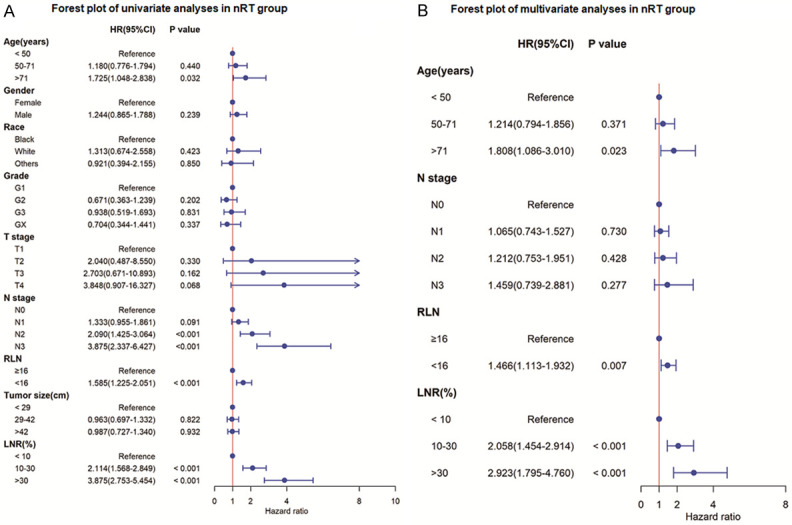
Forest plot of univariate and multivariate analyses for cancer-specific survival in nRT group. A. Univariate analysis of cancer-specific survival; B. Multivariate analysis of cancer-specific survival. LNR, lymph node metastasis; RLN, number of removed lymph nodes; HR, hazard ratio; CI, confidence interval.
Figure 2.
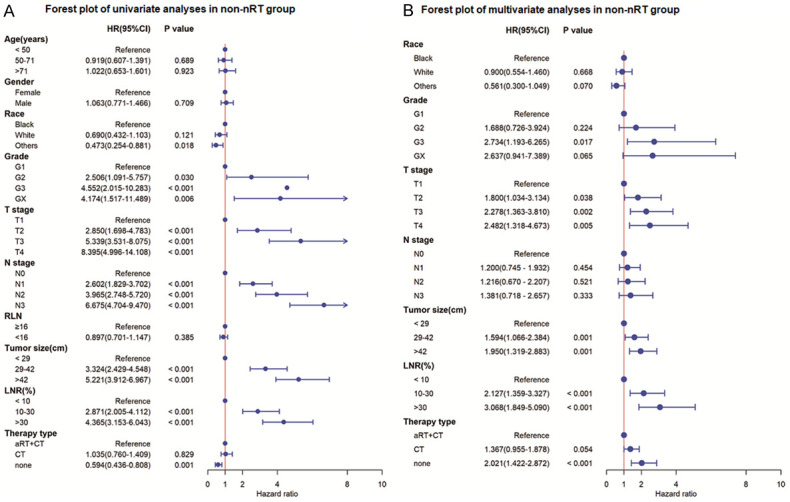
Forest plot of univariate and multivariate analyses for cancer-specific survival in non-nRT group. A. Univariate analysis of cancer-specific survival; B. Multivariate analysis of cancer-specific survival. LNR, lymph node metastasis; RLN, number of removed lymph nodes; nRT, neoadjuvant radiotherapy; aRT, adjuvant radiotherapy; CT, chemotherapy; HR, hazard ratio; CI, confidence interval.
Construction of CSS nomograms using the independent prognostic factors
Nomograms for the nRT and non-nRT group based on the identified independent prognostic factors. The nomograms for nRT group revealed that LNR was the most significant prognosis factor, followed by age and RLN. Notably, LNR contributed significantly to prognosis of patients, followed by T stage and differentiation grade. Therapy type and tumor size showed moderate effect on CSS rate in non-nRT group (Figure 3). Variables included in the nomogram were assigned scores which were used for prediction of the 3- and 5-year survival rates.
Figure 3.
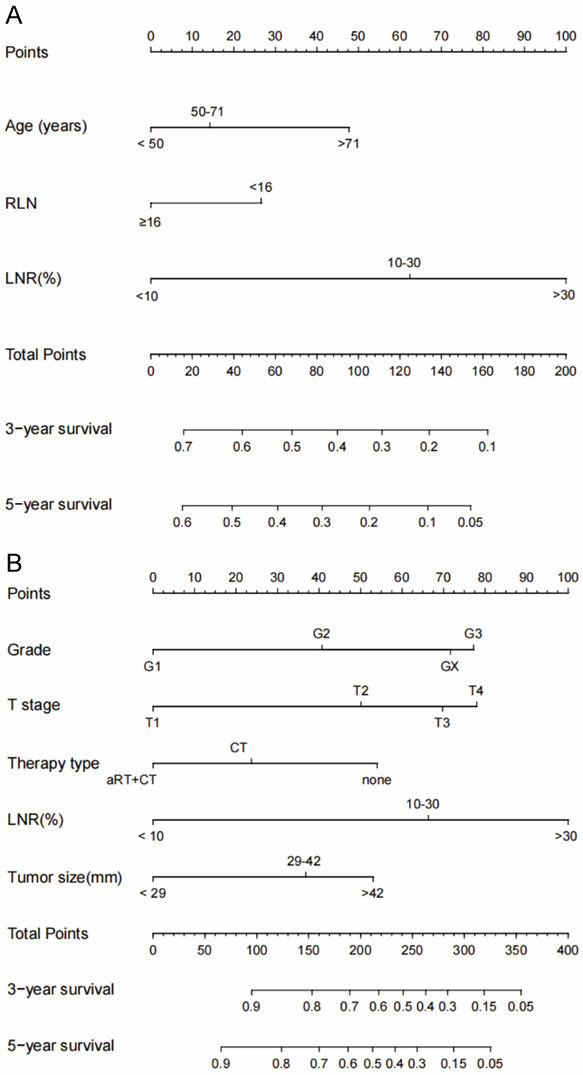
The 3- and 5-year CSS of Siewert Type II AEG patients in nRT group (A) and non-nRT group (B) as predicted by the nomograms. LNR, lymph node metastasis; RLN, number of removed lymph nodes; nRT, neoadjuvant radiotherapy; aRT, adjuvant radiotherapy; CT, chemotherapy.
Validation and comparison of the nomograms
The C-index of the nomogram for the training cohort of nRT group was 0.652 (95% CI: 0.614-0.690), which was significantly higher compared with C-index of TNM stage (7th TNM stage: C-index =0.595, 95% CI=0.556-0.634; 8th TNM stage: C-index =0.580, 95% CI=0.543-0.617) (P<0.05). The C-index of the nomogram for the training cohort of non-nRT group was 0.754 (95% CI: 0.723-0.785) which was significantly higher compared with the C-index of the 7th TNM stages at 0.717 (95% CI: 0.685-0.749; P<0.05). Similar findings were observed for the validation cohorts (Table 2). C-indices of the 7th TNM stage, as well as the C-index of the nomogram for or both cohorts in non-nRT group, were higher compared with the C-indices of the nRT group (0.681-0.754 vs. 0.580-0.663). The ROC curves for 3- and 5-years survival rated showed that the AUCs of the nomogram (3-year AUC: 73.1; 5-year AUC: 73.8) were higher compared with the AUCs for the 7th edition TNM stage (3-year AUC: 65.0; 5-year AUC: 68.5) and 8th edition TNM stage (3-year AUC: 61.7; 5-year AUC: 65.6) in the training (Figure 4A and 4B) and validation (Figure 4C and 4D) cohorts for the nRT group. Moreover, the AUCs of the nomogram for the non-nRT group were higher compared with the AUCs of the 7th edition TNM stage (3-year AUC: 80.9 vs. 78.5; 5-year AUC: 79.2 vs. 75.6) in the training (Figure 5A and 5B) and validation (Figure 5C and 5D) cohorts. Notably, the AUC values of the nomogram of the non-nRT group and 7th edition TNM stage were higher compared with the AUC values in the nRT group for the 3-year and 5-year survival rates, respectively. Calibration plots of the 2 groups showed good consistency between the actual and predicted 3- and 5-year CSS, in both cohorts (Figure 6). Furthermore, DCA showed that the nomograms had good and wide clinical applications in both cohorts. This finding indicates that the nomograms performed better compared with AJCC staging system in predicting 3-year and 5-year CSS in patients (Figures 7 and 8). Survival analysis using AJCC staging system showed that pT stage was not effective in stratifying patients between pT2 and pT4 in the nRT group (P=0.16). This implies that the 7th and 8th TNM editions were not effective in stratifying patients in stages IA and IIIA in the nRT group. However, the 7th TNM edition showed good prognostic stratification value in the non-nRT group, except for stage IB and IIA (Figure 9).
Table 2.
C-indices for the nomogram and TNM system in the two groups
| Characteristics | Training cohort | Validation cohort | ||||
|---|---|---|---|---|---|---|
|
|
|
|||||
| C-index | 95% CI | P value | C-index | 95% CI | P value | |
| nRT group | ||||||
| Nomogram | 0.652 | 0.614-0.690 | 0.663 | 0.606-0.720 | ||
| TNM 7th stage | 0.595 | 0.556-0.634 | 0.003* | 0.597 | 0.541-0.654 | 0.016* |
| TNM 8th stage | 0.580 | 0.543-0.617 | <0.001* | 0.588 | 0.534-0.641 | 0.007* |
| non-nRT group | ||||||
| Nomogram | 0.754 | 0.723-0.785 | 0.747 | 0.688-0.800 | ||
| TNM 7th stage | 0.717 | 0.685-0.749 | 0.027 | 0.681 | 0.625-0.736 | 0.016 |
compared with nomogram.
Figure 4.
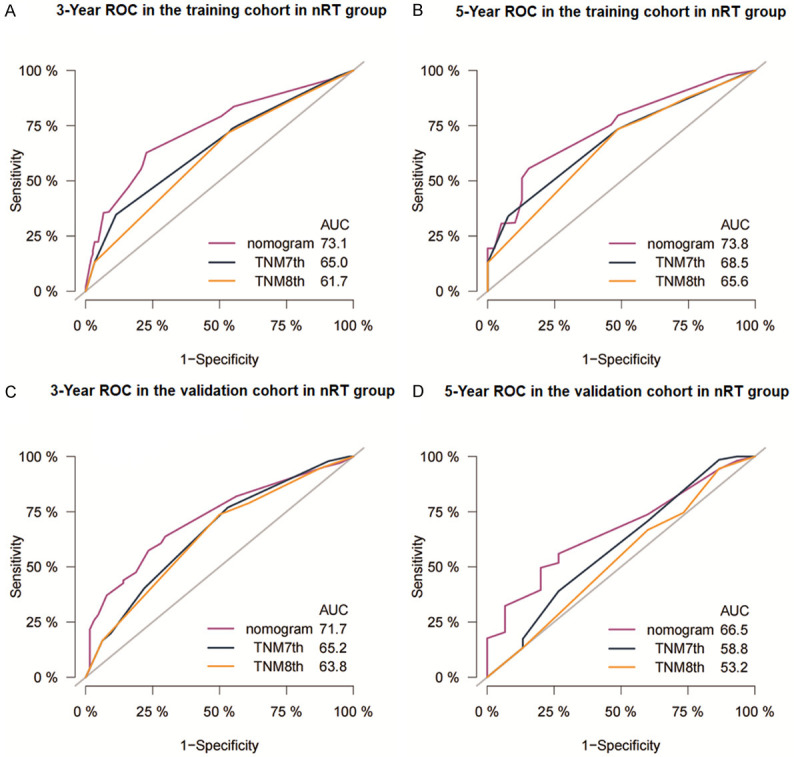
Receiver operating characteristic curves of nomogram and AJCC staging system for prediction of 3- and 5-year CSS for Siewert Type II AEG patients in the training cohort (A, B) and the validation cohort (C, D) in nRT group. AUC: Area under curve.
Figure 5.
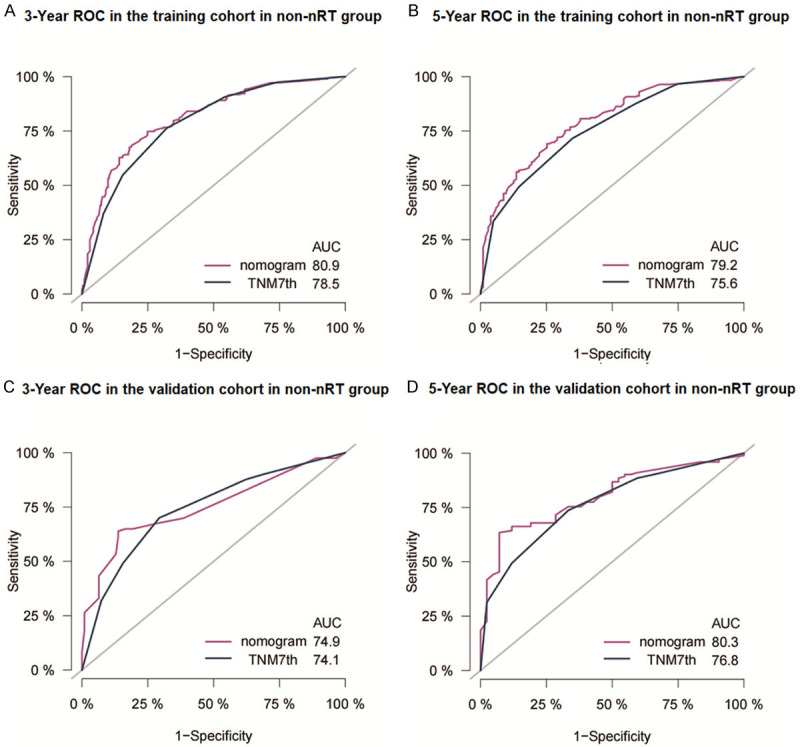
Receiver operating characteristic curves of nomogram and AJCC staging system for prediction of 3- and 5-year CSS for Siewert Type II AEG patients in the training cohort (A, B) and the validation cohort (C, D) in non-nRT group. AUC: Area under curve.
Figure 6.
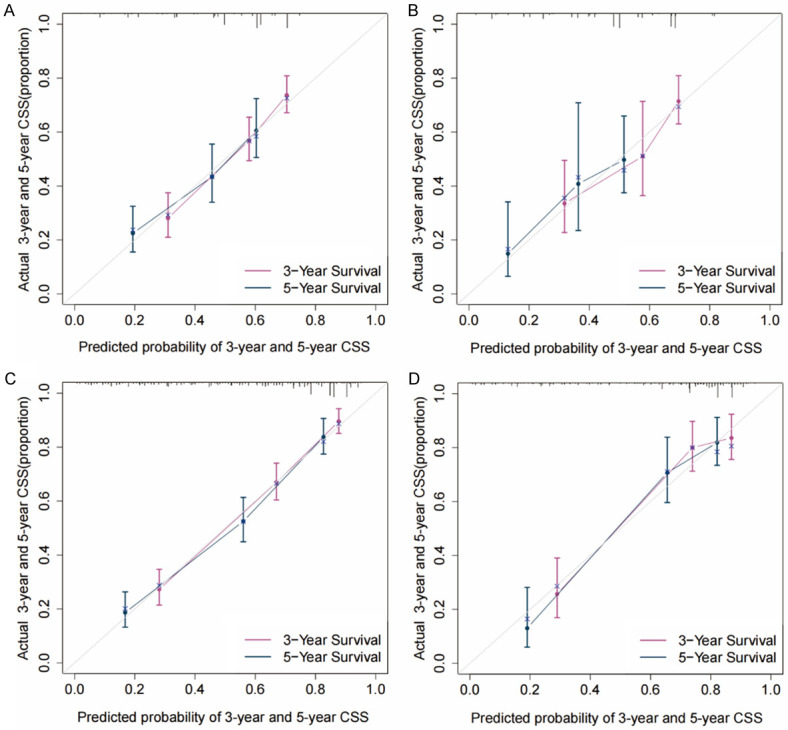
Calibration curves for the predicted 3- and 5-year CSS in training (A) and validation cohorts (B) of the nRT group and the training (C) and validation cohorts (D) of the non-nRT group. CSS: cancer-specific survival.
Figure 7.

Decision curve analysis (DCA) of the nomogram and AJCC staging models for predicting 3- and 5-year CSS in the training (A, B) and validation cohorts (C, D) of the nRT group.
Figure 8.

Decision curve analysis (DCA) of the nomogram model and AJCC staging model for predicting 3- and 5-year CSS in the training (A, B) and validation cohorts (C, D) of the non-nRT group.
Figure 9.
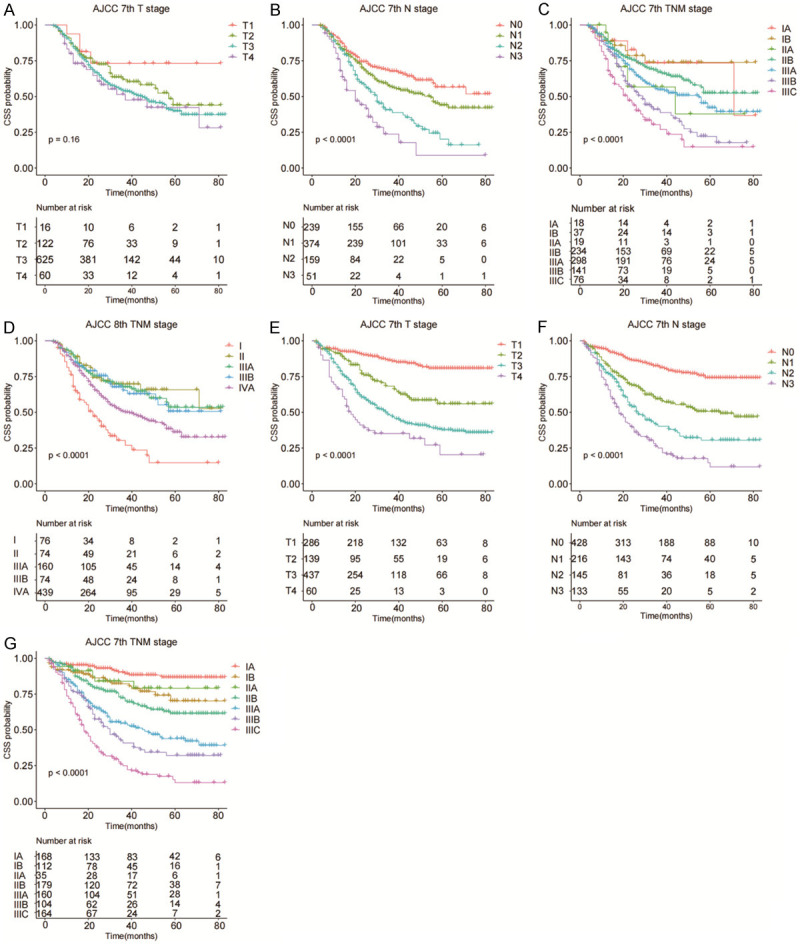
Survival analysis of patients in the nRT group based on ([A] pT stage; [B] pN stage; [C] AJCC 7th edition stages; [D] AJCC 8th edition stages) and the non-nRT group based on ([E] pT stage; [F] pN stage; [G] AJCC 7th edition stages).
Discussion
In the current study, prognostic factors were compared between patients who received or not neoadjuvant radiotherapy. Univariate and multivariate Cox regression analyses showed that age, LNR, and RLN were independent prognostic risk factors in the nRT group, whereas T stage, LNR, histological grade, tumor size, and therapy type were independent prognostic risk factors in the non-nRT group. The two treatment modalities present different prognostic characteristics. LNR was a significant and independent prognosis factor in the two groups and it exhibited better predictive ability compared with N stage. Univariate regression analysis of factors in the 2 groups showed that N stage and LNR prognosis values were significantly different in the two groups. N stage and LNR were included as covariates in the multivariate regression model and the findings indicated that LNR was an independent prognosis factor for the clinical outcomes of AEG patients. This indicates that LNR was a more effective prognostic factor compared with N stage. Similar findings have been reported previously for patients with Siewert Type II AEG [23]. RLN was also an independent prognostic factor in the nRT group. The optimal number of lymph nodes that should be removed after preoperative chemoradiation to achieve good prognosis has not been fully elucidated. Studies have reported that resection of 13-29 nodes improves PFS and OS of patients presenting with locally advanced esophageal squamous cell carcinoma receiving preoperative chemoradiation [24]. The present study showed that resecting >16 lymph nodes improved CSS in patients with Siewert II AEG after neoadjuvant radiotherapy which is consistent with previous findings. Age is an important independent risk factor. A Chinese population-based cohort study observed that elderly AEG patients, mainly males, had worse prognosis compared to younger patients [25,26]. Previous studies reported inconsistent results on the significance of pT stage for prognosis of patients receiving neoadjuvant radiotherapy. A previous study reported that ypT stage is an independent prognostic factor in AEG patients who underwent preoperative radiotherapy [27]. However, a recent study reported that pT stage could not independently predict the prognosis of AEGs patients undergoing preoperative radiotherapy [28]. Univariate regression or multivariate regression analysis in the current study indicated that pT stage is not a prognostic factor for AEG patients. Pathological factors such as LNR, pT stage, tumor size, and tumor grade in the non-nRT group were potential independent prognostic factors for AEG patients. The results showed that survival decreased with increase in LNR, tumor size, depth (pT), and tumor grade, which was consistent with previous findings [10,17]. Moreover, therapy type was an independent prognostic factor. The INT-0116 trial reported that postoperative radiotherapy combined with chemotherapy is more effective than surgery combined with chemotherapy or surgery alone [29]. In addition, a previous retrospective study reported that postoperative chemoradiation improved 3-year DFS rates after curative resection in EGJ adenocarcinoma patients with positive lymph nodes who had not received neoadjuvant chemotherapy [30]. The results for the present study showed that postoperative radiotherapy combined with chemotherapy exhibited high survival benefit in patients who did not receive preoperative radiotherapy.
Nomograms are widely used tools for evaluation of prognosis of various cancers owing to their reliability relative to traditional staging method. A previous study established a nomogram for patients who had received neoadjuvant radiotherapy [28], however, nomograms have not been established for patients who have not undergone neoadjuvant radiotherapy. The findings of the present study showed that the two treatment modalities had different prognostic characteristics. In this study, C-index analysis and receiver operating characteristic (ROC) curves revealed that the developed nomograms had superior discrimination power to the AJCC staging system. Calibration curve analysis showed that the prediction of the nomograms was consistent with the observed clinical features, indicating that the nomograms were reliable. DCA showed that the nomogram was superior in clinical applications compared to TNM staging system. In addition, the nomogram and 7th edition TNM stage for non-nRT group had higher prognostic value as exhibited by higher C-indexes and AUC values compared to the prognostic value of the nomogram of the nRT group.
Analysis of the survival curve for the TNM staging system showed that ypT stages were not effective in stratifying patients in the nRT group. However, TNM staging showed good prognostic stratification for patients in the non-nRT group. Therefore, ypT staging should be optimized and standardized in patients who undergo neoadjuvant radiotherapy and more sensitive and effective prognostic factors should be explored.
The study had a few limitations. First, the nomograms were based on a single dataset. Second, the order of chemotherapy and surgery was not available in SEER database, thus patients who underwent adjuvant and neoadjuvant chemotherapy could not be distinguished. Third, the current SEER database does not include some indicators such as the clinical response to neoadjuvant therapy and this may affect prognosis of patients who have received neoadjuvant radiotherapy, thus affecting accuracy of the prognostic prediction of patients in the nRT group.
In summary, the findings showed that nomograms are better indicators of prognosis than TNM staging in Siewert Type II AEG patients. In addition, nomogram and TNM staging system showed good prognostic performance in patients who did not receive neoadjuvant radiotherapy.
Disclosure of conflict of interest
None.
Supporting Information
References
- 1.Steevens J, Botterweck AA, Dirx MJ, van den Brandt PA, Schouten LJ. Trends in incidence of oesophageal and stomach cancer subtypes in Europe. Eur J Gastroenterol Hepatol. 2010;22:669–678. doi: 10.1097/MEG.0b013e32832ca091. [DOI] [PubMed] [Google Scholar]
- 2.Buas MF, Vaughan TL. Epidemiology and risk factors for gastroesophageal junction tumors: understanding the rising incidence of this disease. Semin Radiat Oncol. 2013;23:3–9. doi: 10.1016/j.semradonc.2012.09.008. [DOI] [PMC free article] [PubMed] [Google Scholar]
- 3.Siewert JR, Stein HJ. Classification of adenocarcinoma of the oesophagogastric junction. Br J Surg. 1998;85:1457–1459. doi: 10.1046/j.1365-2168.1998.00940.x. [DOI] [PubMed] [Google Scholar]
- 4.Giacopuzzi S, Bencivenga M, Weindelmayer J, Verlato G, de Manzoni G. Western strategy for EGJ carcinoma. Gastric Cancer. 2017;20:60–68. doi: 10.1007/s10120-016-0685-2. [DOI] [PubMed] [Google Scholar]
- 5.Yoon HH, Gibson MK. Combined-modality therapy for esophageal and gastroesophageal junction cancers. Curr Oncol Rep. 2007;9:184–192. doi: 10.1007/s11912-007-0020-5. [DOI] [PubMed] [Google Scholar]
- 6.Sanz Álvarez L, Turienzo Santos E, Rodicio Miravalles JL, Moreno Gijón M, Amoza Pais S, Sanz Navarro S, Rizzo Ramos A. Evidence in follow-up and prognosis of esophagogastric junction cancer. Cir Esp (Engl Ed) 2019;97:465–469. doi: 10.1016/j.ciresp.2019.03.012. [DOI] [PubMed] [Google Scholar]
- 7.Coccolini F, Nardi M, Montori G, Ceresoli M, Celotti A, Cascinu S, Fugazzola P, Tomasoni M, Glehen O, Catena F, Yonemura Y, Ansaloni L. Neoadjuvant chemotherapy in advanced gastric and esophago-gastric cancer. Meta-analysis of randomized trials. Int J Surg. 2018;51:120–127. doi: 10.1016/j.ijsu.2018.01.008. [DOI] [PubMed] [Google Scholar]
- 8.van Hagen P, Hulshof MC, van Lanschot JJ, Steyerberg EW, van Berge Henegouwen MI, Wijnhoven BP, Richel DJ, Nieuwenhuijzen GA, Hospers GA, Bonenkamp JJ, Cuesta MA, Blaisse RJ, Busch OR, ten Kate FJ, Creemers GJ, Punt CJ, Plukker JT, Verheul HM, Spillenaar Bilgen EJ, van Dekken H, van der Sangen MJ, Rozema T, Biermann K, Beukema JC, Piet AH, van Rij CM, Reinders JG, Tilanus HW, van der Gaast A CROSS Group. Preoperative chemoradiotherapy for esophageal or junctional cancer. N Engl J Med. 2012;366:2074–2084. doi: 10.1056/NEJMoa1112088. [DOI] [PubMed] [Google Scholar]
- 9.Hingorani M, Crosby T, Maraveyas A, Dixit S, Bateman A, Roy R. Neoadjuvant chemoradiotherapy for resectable oesophageal and gastro-oesophageal junction cancer--do we need another randomised trial? Clin Oncol (R Coll Radiol) 2011;23:696–705. doi: 10.1016/j.clon.2011.05.005. [DOI] [PubMed] [Google Scholar]
- 10.Rice TW, Gress DM, Patil DT, Hofstetter WL, Kelsen DP, Blackstone EH. Cancer of the esophagus and esophagogastric junction-major changes in the American Joint Committee on Cancer eighth edition cancer staging manual. CA Cancer J Clin. 2017;67:304–317. doi: 10.3322/caac.21399. [DOI] [PubMed] [Google Scholar]
- 11.Shridhar R, Dombi GW, Finkelstein SE, Meredith KL, Hoffe SE. Improved survival in patients with lymph node-positive gastric cancer who received preoperative radiation: an analysis of the surveillance, epidemiology, and end results database. Cancer. 2011;117:3908–3916. doi: 10.1002/cncr.25995. [DOI] [PubMed] [Google Scholar]
- 12.Newton AD, Datta J, Loaiza-Bonilla A, Karakousis GC, Roses RE. Neoadjuvant therapy for gastric cancer: current evidence and future directions. J Gastrointest Oncol. 2015;6:534–543. doi: 10.3978/j.issn.2078-6891.2015.047. [DOI] [PMC free article] [PubMed] [Google Scholar]
- 13.Chang F, Deere H, Mahadeva U, George S. Histopathologic examination and reporting of esophageal carcinomas following preoperative neoadjuvant therapy: practical guidelines and current issues. Am J Clin Pathol. 2008;129:252–262. doi: 10.1309/CCR3QN4874YJDJJ7. [DOI] [PubMed] [Google Scholar]
- 14.Hornick JL, Farraye FA, Odze RD. Prevalence and significance of prominent mucin pools in the esophagus post neoadjuvant chemoradiotherapy for Barrett’s-associated adenocarcinoma. Am J Surg Pathol. 2006;30:28–35. doi: 10.1097/01.pas.0000174011.29816.fa. [DOI] [PubMed] [Google Scholar]
- 15.Wang Y, Li J, Xia Y, Gong R, Wang K, Yan Z, Wan X, Liu G, Wu D, Shi L, Lau W, Wu M, Shen F. Prognostic nomogram for intrahepatic cholangiocarcinoma after partial hepatectomy. J. Clin. Oncol. 2013;31:1188–1195. doi: 10.1200/JCO.2012.41.5984. [DOI] [PubMed] [Google Scholar]
- 16.Shi X, Xu L, Ma B, Wang S. Development and validation of a nomogram to predict the prognosis of patients with gastric cardia cancer. Sci Rep. 2020;10:14143. doi: 10.1038/s41598-020-71146-z. [DOI] [PMC free article] [PubMed] [Google Scholar]
- 17.Feng Y, Jiang Y, Zhao Q, Liu J, Zhang H, Chen Q. Long-term outcomes and prognostic factor analysis of resected Siewert type II adenocarcinoma of esophagogastric junction in China: a seven-year study. BMC Surg. 2020;20:302. doi: 10.1186/s12893-020-00926-1. [DOI] [PMC free article] [PubMed] [Google Scholar]
- 18.Matsuda T, Kurokawa Y, Yoshikawa T, Kishi K, Misawa K, Ohi M, Mine S, Hiki N, Takeuchi H. Clinicopathological characteristics and prognostic factors of patients with Siewert type II esophagogastric junction carcinoma: a retrospective multicenter study. World J Surg. 2016;40:1672–1679. doi: 10.1007/s00268-016-3451-z. [DOI] [PubMed] [Google Scholar]
- 19.Engels EA, Pfeiffer RM, Ricker W, Wheeler W, Parsons R, Warren JL. Use of surveillance, epidemiology, and end results-medicare data to conduct case-control studies of cancer among the US elderly. Am J Epidemiol. 2011;174:860–870. doi: 10.1093/aje/kwr146. [DOI] [PMC free article] [PubMed] [Google Scholar]
- 20.Miccio JA, Oladeru OT, Yang J, Xue Y, Choi M, Zhang Y, Yoon H, Ryu S, Stessin AM. Neoadjuvant vs. adjuvant treatment of Siewert type II gastroesophageal junction cancer: an analysis of data from the surveillance, epidemiology, and end results (SEER) registry. J Gastrointest Oncol. 2016;7:403–410. doi: 10.21037/jgo.2015.10.06. [DOI] [PMC free article] [PubMed] [Google Scholar]
- 21.Xu J, Cao J, Wang L, Wang Z, Wang Y, Wu Y, Lv W, Hu J. Prognostic performance of three lymph node staging schemes for patients with Siewert type II adenocarcinoma of esophagogastric junction. Sci Rep. 2017;7:10123. doi: 10.1038/s41598-017-09625-z. [DOI] [PMC free article] [PubMed] [Google Scholar]
- 22.Zhu K, Xu Y, Fu J, Mohamud FA, Duan Z, Tan S, Zhao Z, Chen P, Zong L. Proximal gastrectomy versus total gastrectomy for Siewert type II adenocarcinoma of the esophagogastric junction: a comprehensive analysis of data from the SEER registry. Dis Markers. 2019;2019:9637972. doi: 10.1155/2019/9637972. [DOI] [PMC free article] [PubMed] [Google Scholar]
- 23.Zhang Y, Liu D, Zeng D, Chen C. Lymph node ratio is an independent prognostic factor for patients with Siewert type II adenocarcinoma of esophagogastric junction: results from a 10-year follow-up study. J Gastrointest Cancer. 2020;52:983–992. doi: 10.1007/s12029-020-00468-y. [DOI] [PubMed] [Google Scholar]
- 24.Guo JC, Lin CC, Huang TC, Huang PM, Kuo HY, Chang CH, Wang CC, Cheng JC, Yeh KH, Hsu CH, Lee JM. Number of resected lymph nodes and survival of patients with locally advanced esophageal squamous cell carcinoma receiving preoperative chemoradiotherapy. Anticancer Res. 2018;38:1569–1577. doi: 10.21873/anticanres.12386. [DOI] [PubMed] [Google Scholar]
- 25.Cao J, Yang T, Wang G, Zhang H, You Y, Chen J, Yang J, Yang W. Analysis of the clinicopathological features and prognostic factors in 734 cases of Chinese Hui and Han patients with adenocarcinoma of the esophagogastric junction. Surg Oncol. 2018;27:556–562. doi: 10.1016/j.suronc.2018.07.008. [DOI] [PubMed] [Google Scholar]
- 26.Rice TW, Apperson-Hansen C, DiPaola LM, Semple ME, Lerut TE, Orringer MB, Chen LQ, Hofstetter WL, Smithers BM, Rusch VW, Wijnhoven BP, Chen KN, Davies AR, D’Journo XB, Kesler KA, Luketich JD, Ferguson MK, Räsänen JV, van Hillegersberg R, Fang W, Durand L, Allum WH, Cecconello I, Cerfolio RJ, Pera M, Griffin SM, Burger R, Liu JF, Allen MS, Law S, Watson TJ, Darling GE, Scott WJ, Duranceau A, Denlinger CE, Schipper PH, Ishwaran H, Blackstone EH. Worldwide esophageal cancer collaboration: clinical staging data. Dis Esophagus. 2016;29:707–714. doi: 10.1111/dote.12493. [DOI] [PMC free article] [PubMed] [Google Scholar]
- 27.Ott K, Blank S, Becker K, Langer R, Weichert W, Roth W, Sisic L, Stange A, Jäger D, Büchler M, Siewert JR, Lordick F. Factors predicting prognosis and recurrence in patients with esophago-gastric adenocarcinoma and histopathological response with less than 10% residual tumor. Langenbecks Arch Surg. 2013;398:239–249. doi: 10.1007/s00423-012-1039-0. [DOI] [PubMed] [Google Scholar]
- 28.Liu F, Zhou R, Jiang F, Liu G, Li K, Zhu G. Proposal of a nomogram for predicting survival in patients with Siewert type II adenocarcinoma of the esophagogastric junction after preoperative radiation. Ann Surg Oncol. 2019;26:1292–1300. doi: 10.1245/s10434-019-07237-7. [DOI] [PMC free article] [PubMed] [Google Scholar]
- 29.Smalley SR, Benedetti JK, Haller DG, Hundahl SA, Estes NC, Ajani JA, Gunderson LL, Goldman B, Martenson JA, Jessup JM, Stemmermann GN, Blanke CD, Macdonald JS. Updated analysis of SWOG-directed intergroup study 0116: a phase III trial of adjuvant radiochemotherapy versus observation after curative gastric cancer resection. J. Clin. Oncol. 2012;30:2327–2333. doi: 10.1200/JCO.2011.36.7136. [DOI] [PMC free article] [PubMed] [Google Scholar]
- 30.Kofoed SC, Muhic A, Baeksgaard L, Jendresen M, Gustafsen J, Holm J, Bardram L, Brandt B, Brenø J, Svendsen LB. Survival after adjuvant chemoradiotherapy or surgery alone in resectable adenocarcinoma at the gastro-esophageal junction. Scand J Surg. 2012;101:26–31. doi: 10.1177/145749691210100106. [DOI] [PubMed] [Google Scholar]
Associated Data
This section collects any data citations, data availability statements, or supplementary materials included in this article.