

Key Points
Question
What is the accuracy of an algorithm using echocardiography and serum biomarkers for the timely diagnosis of cancer therapy–related cardiac dysfunction (CTRCD) defined using cardiovascular magnetic resonance (CMR).
Findings
In this cohort study, a combined approach of using echocardiographic 3-dimensional (3-D) left ventricular ejection fraction (LVEF), global longitudinal strain (GLS), and global circumferential strain (GCS) was associated with good discriminatory accuracy for concurrent CMR-detected CTRCD, but high-sensitivity troponin I and B-type natriuretic were not. When none of the 3-D LVEF, GLS, and GCS CTRCD criteria were met, the probability of CTRCD as defined by CMR was 1.0%.
Meaning
Combined use of echocardiography 3-D LVEF, GLS, and GCS in clinical practice may improve timely diagnosis of CTRCD.
This cohort study evaluates the accuracy of echocardiography and serum biomarkers in diagnosing cancer therapy–related cardiac dysfunction.
Abstract
Importance
Diagnosis of cancer therapy–related cardiac dysfunction (CTRCD) remains a challenge. Cardiovascular magnetic resonance (CMR) provides accurate measurement of left ventricular ejection fraction (LVEF), but access to repeated scans is limited.
Objective
To develop a diagnostic model for CTRCD using echocardiographic LVEF and strain and biomarkers, with CMR as the reference standard.
Design, Setting, and Participants
In this prospective cohort study, patients were recruited from University of Toronto–affiliated hospitals from November 2013 to January 2019 with all cardiac imaging performed at a single tertiary care center. Women with human epidermal growth factor receptor 2 (HER2)–positive early-stage breast cancer were included. The main exclusion criterion was contraindication to CMR. A total of 160 patients were recruited, 136 of whom completed the study.
Exposures
Sequential therapy with anthracyclines and trastuzumab.
Main Outcomes and Measures
Patients underwent echocardiography, high-sensitivity troponin I (hsTnI), B-type natriuretic peptide (BNP), and CMR studies preanthracycline and postanthracycline every 3 months during and after trastuzumab therapy. Echocardiographic measures included 2-dimensional (2-D) LVEF, 3-D LVEF, peak systolic global longitudinal strain (GLS), and global circumferential strain (GCS). LVEF CTRCD was defined using the Cardiac Review and Evaluation Committee Criteria, GLS or GCS CTRCD as a greater than 15% relative change, and abnormal hsTnI and BNP as greater than 26 pg/mL and ≥ 35 pg/mL, respectively, at any follow-up point. Combinations of echocardiographic measures and biomarkers were examined to diagnose CMR CTRCD using conditional inference tree models.
Results
Among 136 women (mean [SD] age, 51.1 [9.2] years), CMR-identified CTRCD occurred in 37 (27%), and among those with analyzable images, in 30 of 131 (23%) by 2-D LVEF, 27 of 124 (22%) by 3-D LVEF, 53 of 126 (42%) by GLS, 61 of 123 (50%) by GCS, 32 of 136 (24%) by BNP, and 14 of 136 (10%) by hsTnI. In isolation, 3-D LVEF had greater sensitivity and specificity than 2-D LVEF for CMR CTRCD while GLS had greater sensitivity than 2-D or 3-D LVEF. Regression tree analysis identified a sequential algorithm using 3-D LVEF, GLS, and GCS for the optimal diagnosis of CTRCD (area under the receiver operating characteristic curve, 89.3%). The probability of CTRCD when results for all 3 tests were negative was 1.0%. When 3-D LVEF was replaced by 2-D LVEF in the model, the algorithm still performed well; however, its primary value was to rule out CTRCD. Biomarkers did not improve the ability to diagnose CTRCD.
Conclusions and Relevance
Using CMR CTRCD as the reference standard, these data suggest that a sequential approach combining echocardiographic 3-D LVEF with 2-D GLS and 2-D GCS may provide a timely diagnosis of CTRCD during routine CTRCD surveillance with greater accuracy than using these measures individually.
Trial Registration
ClinicalTrials.gov Identifier: NCT02306538
Introduction
Left ventricular ejection fraction (LVEF) surveillance is widely used to identify cancer therapy–related cardiac dysfunction (CTRCD). Cardiovascular magnetic resonance (CMR) is considered the reference standard for measuring LVEF;1,2 however, its routine use for repeated monitoring is not feasible. Currently, 3-dimensional (3-D) echocardiographic LVEF is the most commonly endorsed method to monitor for CTRCD.3,4 Other measures, such as peak systolic global longitudinal (GLS) and circumferential strain (GCS), troponin, and natriuretic peptides, are also recommended to identify future CTRCD risk.3,4,5 Although future risk is important, diagnosing current CTRCD still remains a challenge, and late diagnosis can result in poor outcomes.6 A potential method to improve diagnostic accuracy is to use an algorithmic approach combining multiple imaging and serum biomarkers but, to our knowledge, this has not been studied.
In women with human epidermal growth factor receptor 2 (HER2)–positive breast cancer receiving treatment, we sought to compare the diagnostic performance of echocardiographic 2-dimensional (2-D) LVEF, 3-D LVEF, 2-D GLS, 2-D GCS, serum high-sensitivity troponin I (hsTnI), and B-type natriuretic peptide (BNP) with CMR in diagnosing CTRCD and to develop a CTRCD diagnostic algorithm using a combination of echocardiography measures and serum biomarkers. We hypothesized that a diagnostic algorithm combining multiple measures would have good discriminatory accuracy for CMR-defined CTRCD.
Methods
Patients
Between November 2013 and January 2019, women (18 years and older) with HER2-positive breast cancer (stages 1 to 3) scheduled to receive sequential anthracycline and trastuzumab therapy (with or without adjuvant radiotherapy) were prospectively recruited from University of Toronto–affiliated hospitals. Exclusion criteria were contraindications to CMR (eg, breast tissue expanders), life expectancy less than 12 months, participating in another oncology clinical trial, prior exposure to anthracyclines, and history of active or prior cardiac disease. Medical history and clinical assessment were collected at every follow-up. The study was approved by the institutional research ethics board at the University Health Network, and all patients signed written informed consent. The echocardiography study was performed using General Electric system E9 (General Electric Healthcare) following American Society of Echocardiography (ASE) guidelines.7
Transthoracic Echocardiography
All patients had transthoracic echocardiograms before anthracyclines (baseline), after anthracyclines but before trastuzumab, every 3 months during trastuzumab therapy (ie, at 3, 6, and 9 months), and after trastuzumab (at 12 months). The biplane Simpson method was used to quantify 2-D LVEF using dedicated 2- and 4-chamber views.7 Studies with poor image quality despite ultrasonic enhancing agent were excluded.
In each patient, 3-D full volumes (ie, more than 20 volumes per second) of the left ventricle (LV) were obtained from the apical view and the best 3-D image was chosen for 3-D LVEF measurement using a semiautomated algorithm (4D Auto LVQ, EchoPAC Version 202 [General Electric Healthcare]).7 Contour adjustments were made as necessary. Studies with poor image quality were excluded.
For GLS and GCS measurements, apical 4-, 3-, and 2-chamber LV images and 3 short-axis views (ie, basal, mid, and apex) were obtained for 3 cardiac cycles (40 to 80 frames per second) and stored in an uncompressed format for analysis. Peak systolic GLS was measured using automated contours on 3 long-axis views using EchoPAC version 202 (General Electric Healthcare) and peak systolic GCS using Q analysis version 202 (General Electric Healthcare). Contour adjustments were made as necessary; however, after 3 attempts, poorly tracked segments were excluded. GLS was recorded. If more than 3 segments were excluded, the mean of the remaining segments was used. GCS was calculated as a mean of circumferential strain (mean of the peaks) from all 3 short-axis views. All analyses were performed using deidentified images by an echocardiography-trained cardiologist blinded to all clinical information, and 2-D LVEF, 3-D LVEF, GLS, and GCS analyses were performed independently at different time points without knowledge of the other measurements.
Blood Biomarkers
Blood samples were collected by venipuncture at every time point on the day of imaging. HsTnI and BNP were measured on the Architect i2000 immunoassay analyzer (Abbott Diagnostics) using the manufacturer’s reagents. The limit of detection for the troponin assay is 2 pg/mL with coefficients of variation of 5.6% at 46 pg/mL and 4.3% at 1400 pg/mL. The limit of detection for the BNP assay is 10 pg/mL with coefficients of variation of 8.8% at 67 pg/mL and 8.2% at 300 pg/mL.
Cardiovascular Magnetic Resonance
All patients had 5 CMR studies, which were performed on the same day as echocardiography (except at 9 months into trastuzumab) on a 1.5-T magnet (Magnetom AvantoFit [Siemens Healthineers]). For cardiac function, balanced steady-state free precession (bSSFP) cine sequences in a stack of short-axis and long-axis (2-, 3-, and 4-chamber) orientation were acquired. Typical imaging parameters included repetition time/echo time of 2.8/1.2 milliseconds, flip angle 65°, slice thickness 8 mm (2-mm gap), in-plane spatial resolution 1.6 × 1.6 mm, and temporal resolution of 36 milliseconds. After deidentification, CMR analysis was performed by a radiologist blinded to clinical and echocardiography data using Circle cmr42 (Circle Cardiovascular Imaging). Semiautomated processing was used with tracing of smooth endocardial contours, including trabeculations and papillary muscles, into the blood pool.
Definitions
CMR was the reference standard for CTRCD. LVEF CTRCD was defined by the cardiac review and evaluation committee criteria for all modalities as a reduction of 10% or greater without heart failure symptoms or 5% or greater with heart failure symptoms from baseline to less than 55% at any time point during follow-up.8 We performed post hoc sensitivity analyses using definitions of CTRCD from the ASE and European Association of Cardiovascular Imaging (EACVI) (10% or greater change to less than 53%) and the European Society of Cardiology (ESC) (10% or greater change to less than 50%).3,9 When baseline LVEF was below the lower LVEF threshold, a further reduction of 10% or greater constituted CTRCD. A relative reduction greater than 15% in GLS compared with baseline at any point during follow-up defined GLS CTRCD.3 Because established definitions of GCS CTRCD do not exist, we used a 15% relative change.2 Abnormal hsTnI and BNP were defined as a new measurement compared with baseline of greater than 26 pg/mL (greater than 99th percentile) and 35 pg/mL or greater, respectively.10
Statistical Analysis
Continuous variables were summarized using means and SDs or medians and IQRs. Categorical variables were summarized as frequencies. To visualize serial LVEF, echocardiographic strain, and biomarkers over follow-up, we modeled the trajectories using generalized estimating equations with natural cubic splines. The corresponding 95% CIs were calculated using sandwich estimators.2 We also used generalized estimating equations to estimate the concurrent association between echocardiography measures and biomarkers with LVEF or CTRCD, adjusted for time, cumulative indexed epirubicin equivalent dose, mean heart radiation dose (time-varying covariate), and baseline clinical characteristics (ie, age, LVEF and strains, diabetes, hypertension, dyslipidemia, and smoking). The within- and between-patient effects of the various measures were estimated separately.11 Identity and logit link functions were used for the analysis of LVEF and CTRCD, respectively; independent working covariance was used to account for the endogeneity of the measures. To enhance comparison between imaging methods, we also standardized echocardiography measures by dividing all measurements by baseline SD. Missing observations were imputed (eTable 1 in the Supplement) using multivariate imputation by chained equations.12 Given the serial data, we imputed missing covariates based on covariate histories (ie, imputation at a specific time point was based on the information accumulated up to that point). On imputation, the regression results from the imputed data were combined using the Rubin rule.13
Concurrent agreement of CTRCD diagnosis by echocardiography and biomarkers with CMR was characterized. We calculated sensitivity, specificity, and positive and negative likelihood ratios for each time point.
We assessed the risk of concurrent CMR-based CTRCD using echocardiography and serum biomarkers using an integrated approach. Maximal hsTnI and BNP on or before each assessment were considered. Combinations of echocardiography and biomarker-based CTRCD diagnoses were assessed using a conditional inference tree.14 The model was tuned using repeated cross-validations. The optimal tuning parameters were determined by maximizing the scaled Brier scores15 (eMethods in the Supplement). We then summarized the model’s discriminatory accuracy using the receiver operating characteristic curves and determined model-based threshold values for the predicted scores to classify CTRCD. Consistent with the development of the decision tree model, 95% CIs for the area under the receiver operating characteristic curve (AUC) were based on by-patient bootstrap resampling. In sensitivity analysis, we applied this model to ASE/EACVI and ESC definitions of CTRCD to assess performance. To broaden clinical applicability, we approximated the final model’s discriminatory power against CMR CTRCD by replacing 3-D LVEF with 2-D LVEF and removing GCS or substituting it with a single midslice circumferential strain measurement.
Finally, we used multiple correspondence analysis to gain insights into the choice of parameters in the final tree model (eMethods in the Supplement).16 Statistical analyses assumed 2-sided significance level of P < .05 and were implemented using R version 3.5.3 with party, mlr, ROCR, pROC, and FactoMineR packages (The R Foundation).
Results
Patients
A total of 160 patients were recruited, 24 of whom were withdrawn (eFigure 1 in the Supplement). Baseline characteristics of the 136 included patients are summarized in the Table and comparison with the withdrawn patients is in eTable 2 in the Supplement. The mean (SD) age was 51.1 (9.2) years. In terms of treatment, 126 patients (93%) received epirubicin, 10 (7%) received doxorubicin, all received trastuzumab, and 120 (88%) received radiation. All CMR studies were analyzable, while 2-D LVEF, 3-D LVEF, GLS, and GCS were analyzable in 789 (97.4%), 740 (91.4%), 768 (94.8%), 752 (92.8%) studies, respectively, of the acquired images (eResults in the Supplement).
Table. Baseline Characteristics and Cancer Treatment Information.
| Characteristic | No. (%) | P value | ||
|---|---|---|---|---|
| Entire cohort (N = 136) | No CTRCD (N = 99) | CTRCD (N = 37) | ||
| Age, mean (SD), y | 51.1 (9.2) | 50.5 (9.0) | 52.6 (9.8) | .25 |
| Race and ethnicitya | .34 | |||
| Asian | 50 (37) | 37 (37) | 13 (35) | |
| Black | 4 (3) | 2 (2) | 2 (5) | |
| Non-Black Hispanic | 6 (4) | 3 (3) | 3 (8) | |
| White | 76 (56) | 57 (58) | 19 (51) | |
| Body mass index, mean (SD) | 26.2 (5.2) | 26.0 (5.1) | 26.6 (5.6) | .55 |
| Hypertension | 21 (15) | 16 (16) | 5 (14) | .80 |
| Diabetes | 5 (4) | 2 (2) | 3 (8) | .12 |
| Hyperlipidemia | 14 (10) | 6 (6) | 8 (22) | .02 |
| Current or former smoking | 33 (24) | 21 (21) | 12 (32) | .18 |
| Cardiac medications | ||||
| β-Blockers | 7 (5.1) | 5 (5.1) | 2 (5.4) | .99 |
| ACE inhibitors | 6 (4.4) | 3 (3.0) | 3 (8.1) | .34 |
| ARB | 7 (5.1) | 7 (7.1) | 0 | .19 |
| Statins | 9 (6.6) | 4 (4.0) | 5 (13.5) | .06 |
| Breast cancer laterality | .84 | |||
| Left sided | 79 (58) | 56 (57) | 23 (62) | |
| Right sided | 55 (40) | 41 (41) | 14 (38) | |
| Bilateral | 2 (1) | 2 (2) | 0 | |
| Breast cancer stage | .53 | |||
| Stage 1 | 16 (12) | 12 (12) | 4 (11) | |
| Stage 3 | 81 (60) | 60 (61) | 21 (57) | |
| Stage 3 | 38 (28) | 27 (27) | 11 (30) | |
| Stage 4b | 1 (1) | 0 | 1 (3) | |
| Epirubicin-equivalent dose, mean (SD), mg/m2 | 308.39 (19.62) | 308.82 (20.07) | 307.25 (18.58) | .67 |
| Heart radiation dose, mean (SD), cGy | 170.8 (75.9) | 165.5 (75.2) | 184.0 (77.1) | .25 |
| hHsTnI, pg/mL | 2.0 (2.0 to 3.0) | 2.0 (2.0 to 4.0) | 2.0 (2.0 to 2.0) | .002 |
| BNP, pg/mL | 16.9 (10.0 to 26.0) | 19.2 (10.0 to 25.6) | 13.6 (10.0 to 28.1) | .41 |
| 2-D LVEF, mean (SD) (n = 134) | 60 (4) | 60 (4) | 61 (4) | .34 |
| 3-D LVEF, mean (SD) (n = 127) | 61 (3) | 61 (3) | 62 (3) | .42 |
| CMR LVEF, mean (SD) | 63.2 (4.0) | 63.4 (4.0) | 62.4 (5.0) | .17 |
| CMR LVEF <55% | 5 (4) | 3 (3) | 2 (5) | .61 |
| Echo 2-D GLS, mean (SD), % (n = 128) | −20.4 (1.7) | −20.5 (1.5) | −20.3 (2.1) | .61 |
| Echo 2-D GLS <18% | 7 (5) | 3 (3) | 4 (12) | .08 |
| Echo 2-D GCS, mean (SD), % (n = 126) | −20.9 (2.2) | −21.0 (2.1) | −20.5 (2.6) | .26 |
| Echo 2-D GCS <18% | 30 (23) | 24 (26) | 6 (17) | .36 |
Abbreviations: ACE, angiotensin-converting enzyme inhibitors; ARB, angiotensin receptor blocker; BNP, B-type natriuretic peptide; CMR, cardiovascular magnetic resonance; CTRCD, cancer therapy-related cardiac dysfunction; GCS, global circumferential strain; GLS, global longitudinal strain; hsTnI, high sensitivity troponin I; LVEF, left ventricular ejection fraction.
Race data were based on patient self-report.
One patient had stage 3 disease at study enrollment but early during treatment was found to have solitary metastasis to the liver. This patient continued the same cancer regimen and therefore was kept in the study.
Association Between Echocardiography Measures, Biomarkers, and CMR CTRCD
Baseline mean (SD) LVEF by CMR for the cohort was 63.2% (4.0) (Table). Within-patient changes in 2-D LVEF, 3-D LVEF, GLS, and BNP but not GCS or hsTnI as continuous measures during therapy were significantly associated with concurrent changes in CMR LVEF (eFigures 2 and 3 in the Supplement).
CTRCD occurred in 37 of 136 patients (27%) by CMR, 30 of 131 (23%) by 2-D LVEF, 27 of 124 (22%) by 3-D LVEF, 53 of 126 (42%) by GLS, and 61 of 123 (50%) by GCS among those with analyzable images. Timing of onset of CTRCD by all imaging methods are shown in Figure 1. Strain-based CTRCD was seen more frequently and earlier in the treatment course than LVEF CTRCD, and CMR CTRCD occurred slightly earlier and more frequently than echocardiography 2-D LVEF–defined or 3-D LVEF–defined CTRCD. The LVEF and strain values at baseline and at the time of CTRCD or at the lowest measurements in those without CTRCD are shown in eFigures 4 and 5 in the Supplement. Abnormal BNP and hsTnI occurred in 32 of 136 patients (24%) and 14 of 136 patients (10%), respectively. When patients were dichotomized based on meeting CMR CTRCD criteria, there were differences in the trajectory of all echocardiography measures (Figure 2) but not hsTnI or BNP (P = .52 and 0.08).
Figure 1. Timing of Cancer Therapy–Related Cardiac Dysfunction (CTRCD).

Timing of CTRCD defined by echocardiography-measured strain, 2-dimensional (2-D) and 3-D left ventricular ejection fraction (LVEF), and abnormal levels of high-sensitivity troponin I (>26 mg/mL) and B-type natriuretic peptide (BNP; ≥35 pg/mL) in comparison with cardiovascular magnetic resonance (CMR)–defined CTRCD. A, When using global longitudinal strain (GLS) or global circumferential strain (GCS), a greater proportion of patients developed a change of more than 15% than with CMR-defined CTRCD and at an earlier time point, highlighting the sensitivity of this method. B, Using LVEF, CMR-defined CTRCD occurred slightly earlier and in a greater proportion of patients. C, Abnormal troponin developed earlier in the treatment course, while abnormal BNP occurred both early and toward the end of the treatment course.
Figure 2. Temporal Measurements of Left Ventricular Ejection Fraction (LVEF), Echocardiographic Strain, and Biomarkers .
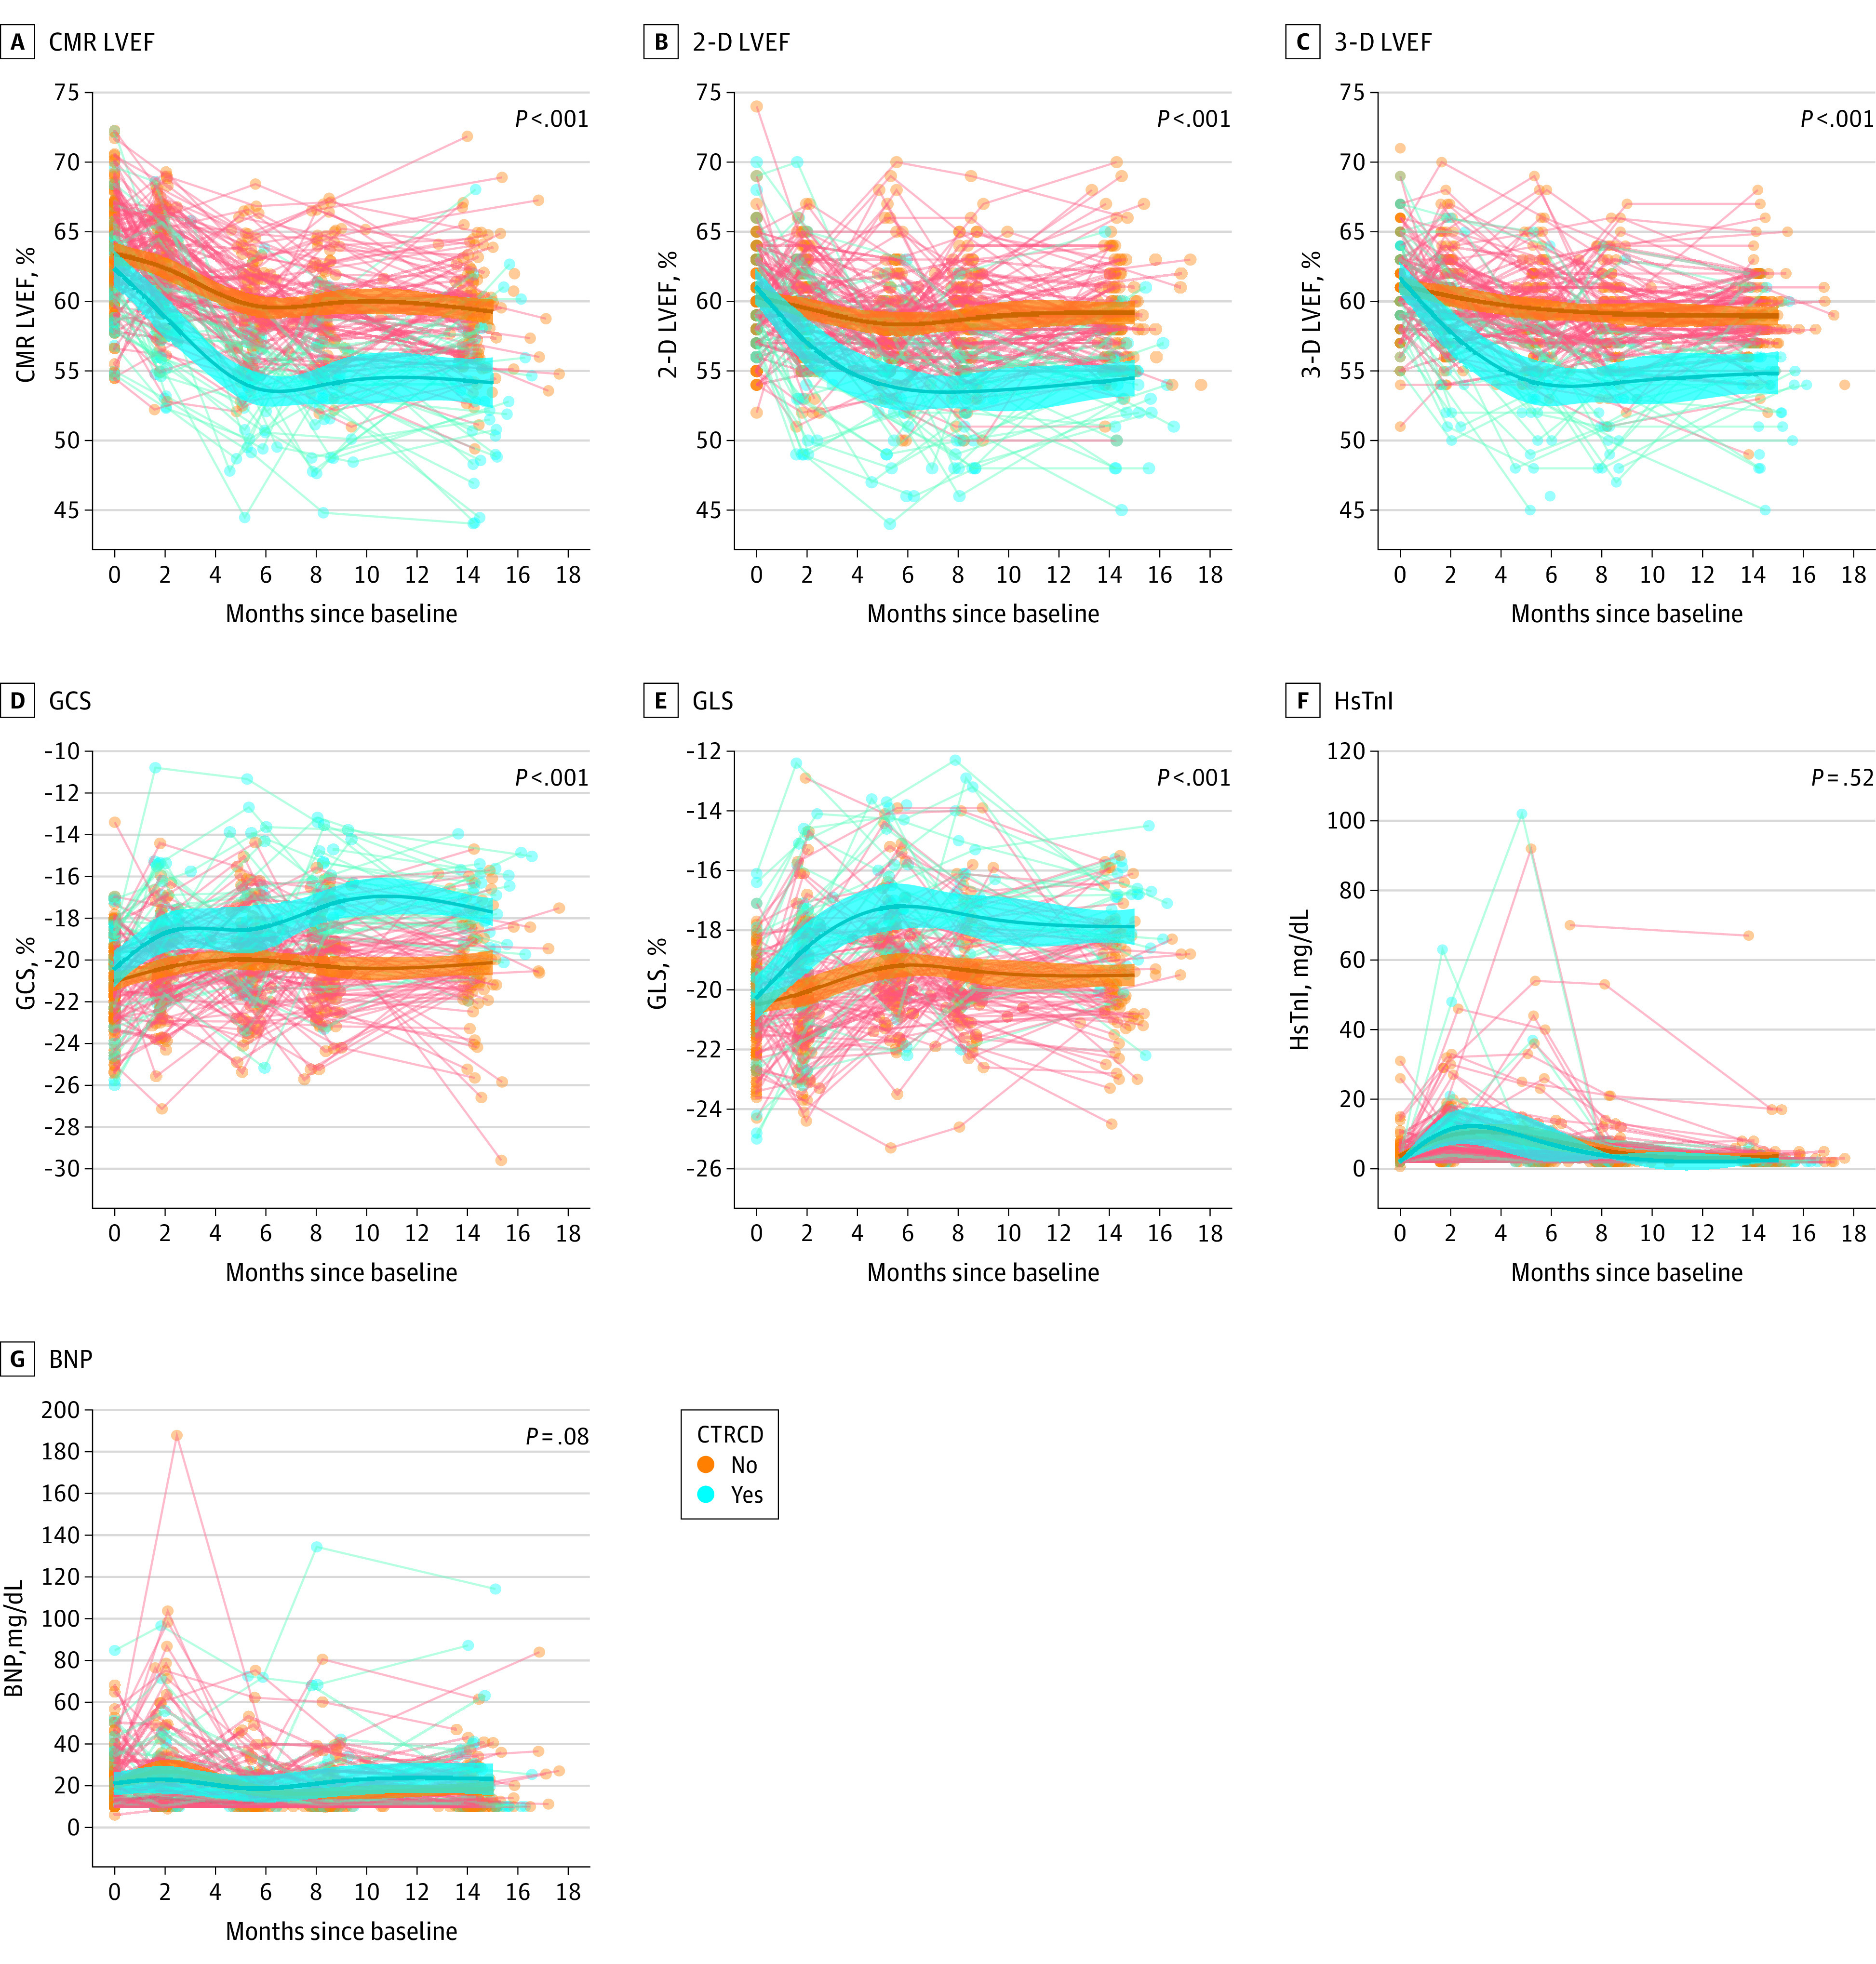
Measurements dichotomized based on patients with and without cardiovascular magnetic resonance (CMR)–defined cancer therapy–related cardiac dysfunction. There were clear and significant differences in the trajectories between the 2 cohorts for all measures except for high-sensitivity troponin I (HsTnI) and B-type natriuretic peptide (BNP). Each line represents 1 patient. 2-D indicates 2-dimensional; 3-D, 3-dimensional; GCS, global circumferential strain; GLS, global longitudinal strain.
Among the 37 patients who met CMR CTRCD criteria, considering those with analyzable images, 27 of 36 (75%) met 2-D LVEF, 26 of 32 (81%) 3-D LVEF, 31 of 34 (91%) GLS, and 33 of 34 (97%) GCS CTRCD criteria; 9 of 37 (24%) and 3 of 37 (8%) had new abnormal BNP and hsTnI, respectively (eTable 3 in the Supplement). There were significant concurrent associations between CMR CTRCD and 2-D LVEF, 3-D LVEF, and GLS CTRCD (eFigures 2 and 3 in the Supplement).
Compared with CMR-defined CTRCD individually, 3-D LVEF consistently had greater sensitivity, specificity, and positive and negative likelihood ratio than 2-D LVEF (eTable 4 in the Supplement). Overall, GLS had better accuracy than GCS for CMR CTRCD and better sensitivity than 2-D, 3-D LVEF, and GCS. Both hsTnI and BNP had good specificity but poor sensitivity and therefore low accuracy for concurrent CMR CTRCD.
An Integrated Approach to the Diagnosis of CTRCD
The tree model (Figure 3A) identified an approach combining 3-D LVEF, GLS, and GCS to be the most optimal for diagnosing CTRCD (AUC, 0.893; 95% CI, 0.829-0.945) (Figure 4A) and had higher AUC than using individual model components (eTable 5 in the Supplement). When 3-D LVEF CTRCD criteria were met, the estimated risk of CMR CTRCD was 76.9%. When 3-D LVEF, GLS, and GCS all failed to meet CTRCD criteria, the estimated risk of CMR CTRCD was 1.0%. The probability of concurrent CMR CTRCD when GLS and GCS criteria were both met was 15.9% and lower if only GLS or GCS criteria were met (Figure 4A). To optimize the diagnosis of CMR CTRCD, the decision rule that maximized sensitivity and specificity was to meet 3-D LVEF CTRCD criteria or both GLS and GCS CTRCD criteria. This rule had a sensitivity of 73.0% and specificity of 90.3% for CMR CTRCD (Figure 4A).
Figure 3. Fitted Regression Tree for the Diagnosis of Cardiovascular Magnetic Resonance (CMR) Cancer Therapy–Related Cardiac Dysfunction (CTRCD) Using Echocardiographic Methods.
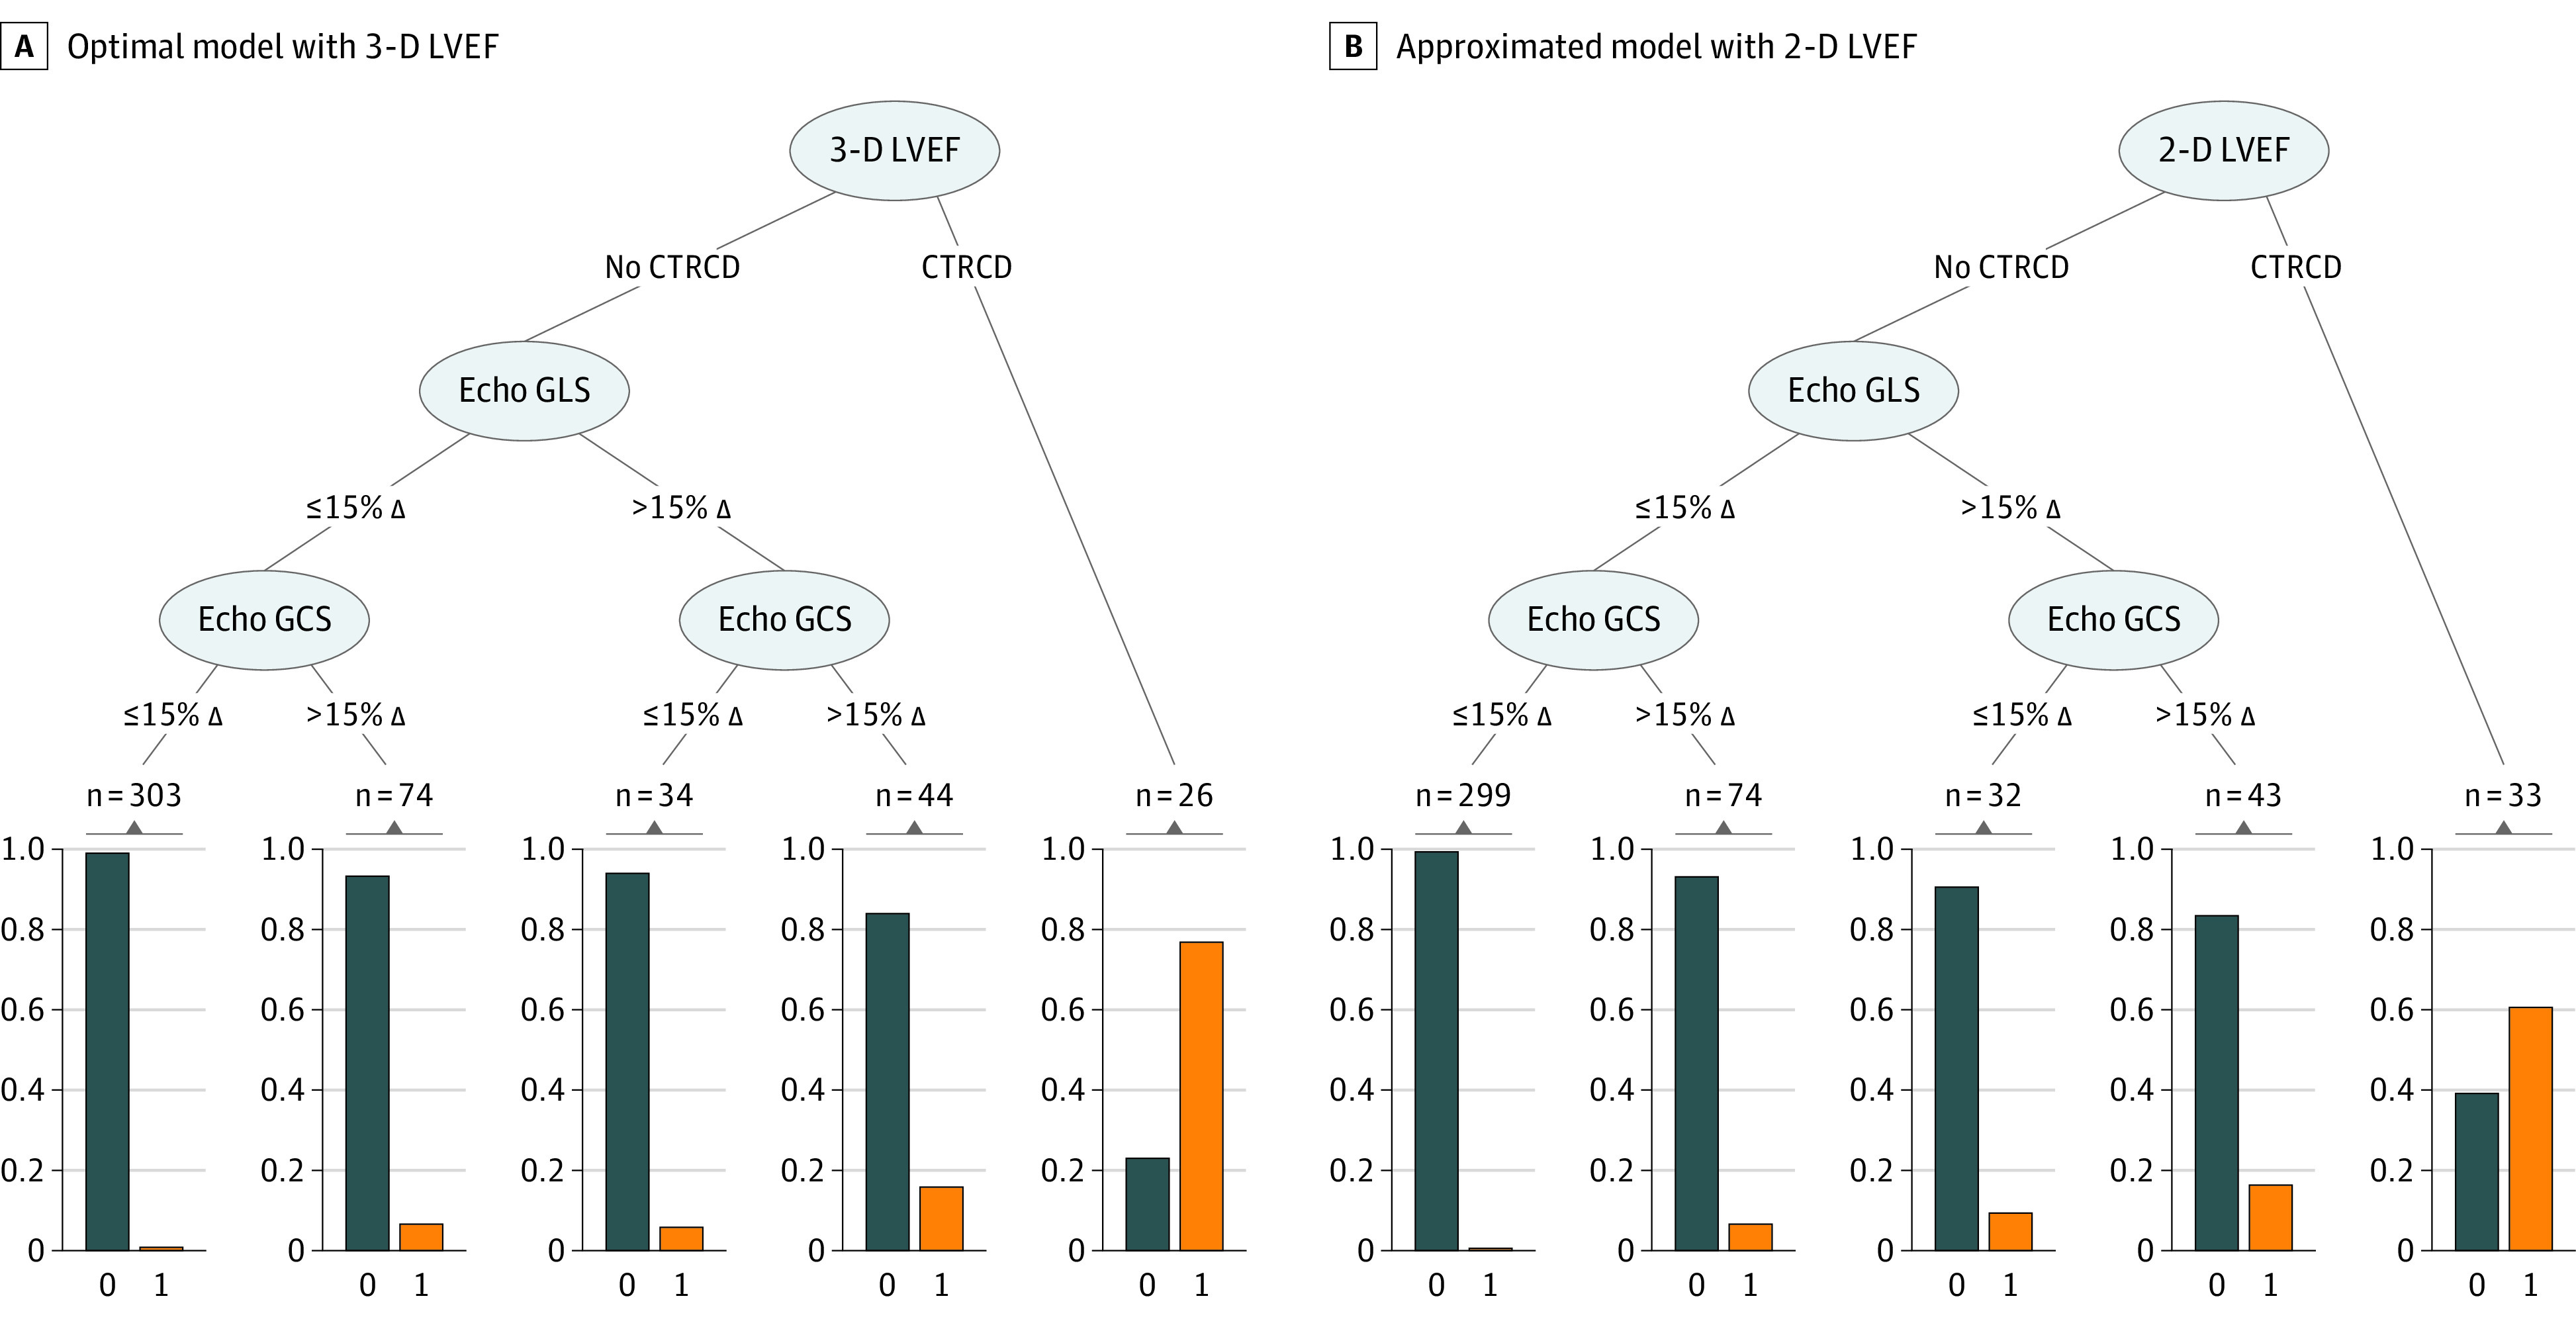
Patients who met 3 dimensional (3-D) CTRCD criteria had a 76.9% probability of having CTRCD (Figure 4A table insert). Those who did not meet 3-D echocardiographic (echo) criteria but had a more than 15% change in both global longitudinal strain (GLS) and global circumferential strain (GCS) compared with baseline have a 15.9% probability of CTRCD. Those who did not meet 3-D left ventricular ejection fraction (LVEF), GLS, or GCS criteria had a 1.0% probability of CTRCD. B, 3-D LVEF replaced with 2-dimensional (2-D) LVEF in the optimized regression tree model. Patients who met only 2-D LVEF criteria had a 60.6% probability of CMR CTRCD (Figure 4D table insert). However, with the use of the entire algorithm, the model’s discriminatory value remained similar. Those who did not meet 2-D LVEF, GLS, or GCS criteria had a 0.7% probability of CTRCD. The orange bars represent patients with CTRCD while the blue bars represent those without CTRCD; the y-axis of the boxes represents proportion. The numbers on the top of the boxes represent the number of echocardiography studies that met the proposed criteria within that branch.
Figure 4. Receiver Operating Characteristic Curves for Models Estimating Risk of Cancer Therapy–Related Cardiac Dysfunction (CTRCD).
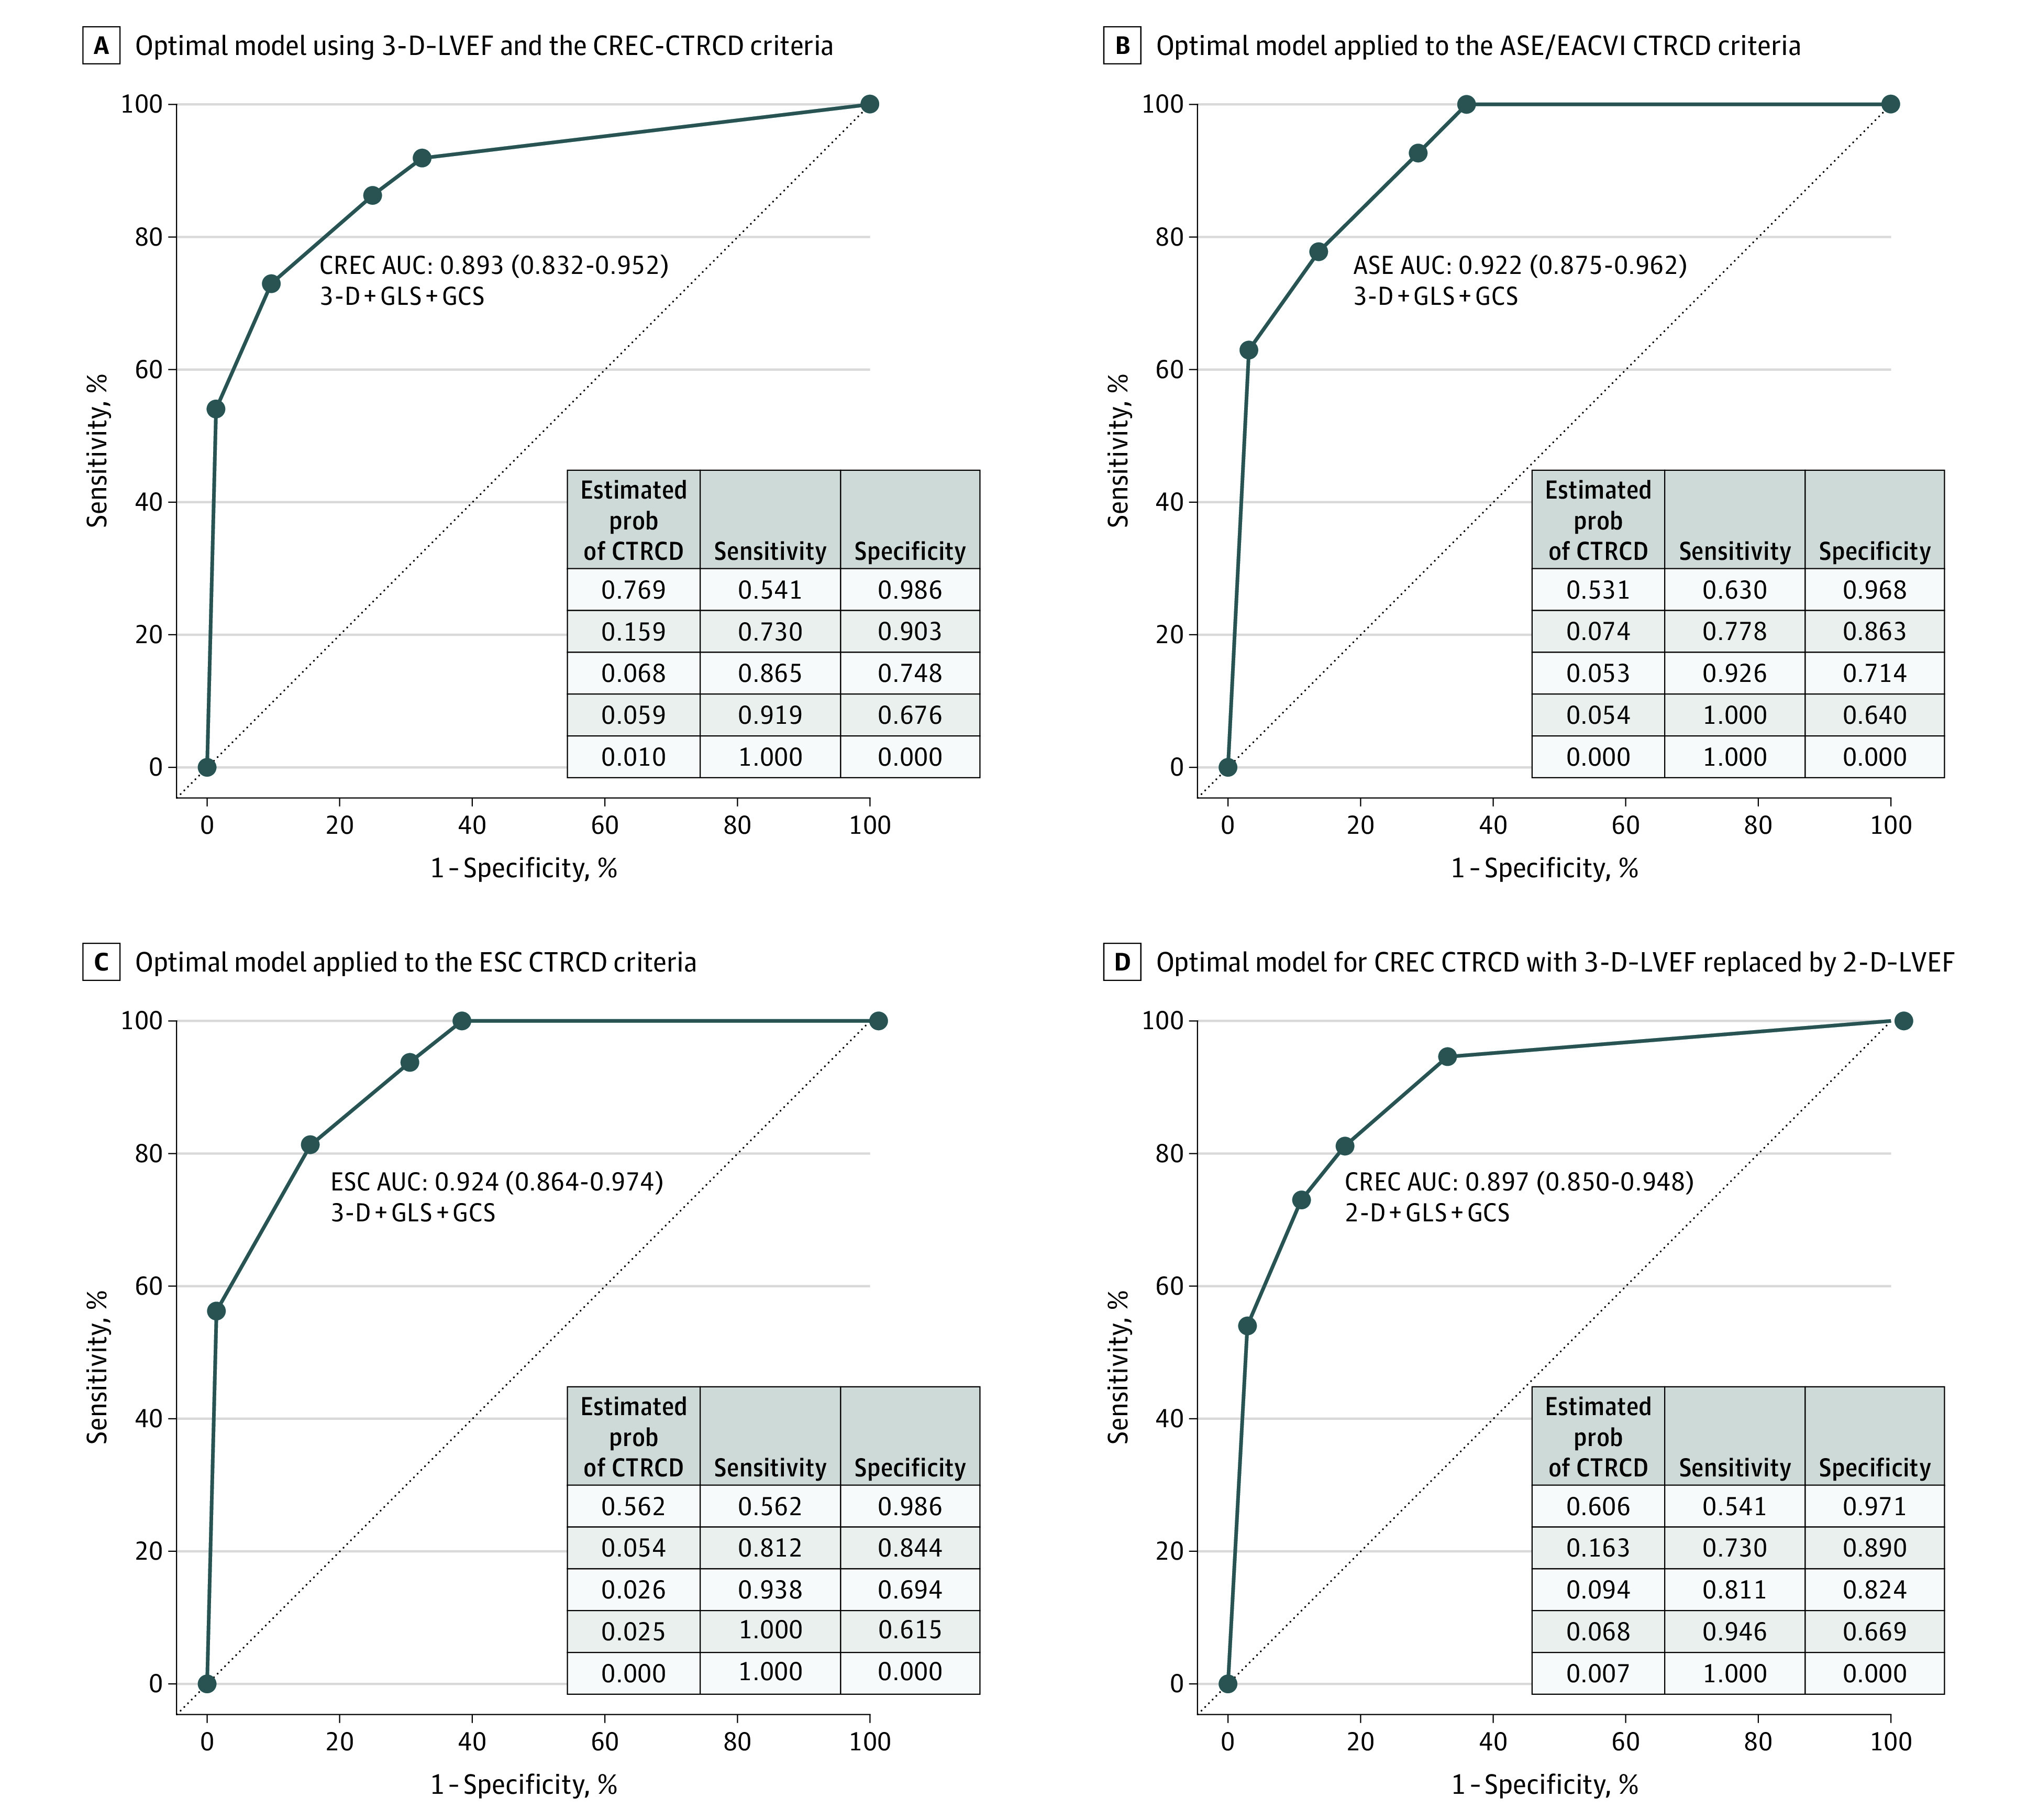
B, In this model, 27 patients met CTRCD criteria. C, In this model, 16 patients met CTRCD criteria. The table inserts provide the estimated probability of CTRCD at each node of the tree model in Figure 3. 2-D indicates 2-dimensional; 3-D, 3-dimensional; ASE, American Society of Echocardiography; AUC, area under the receiver operating characteristic curve; CREC, cardiac review and evaluation committee; EACVI, European Association of Cardiovascular Imaging; ESC, European Society of Cardiology; GCS, global circumferential strain; GLS, global longitudinal strain; prob, probability.
Sensitivity analysis of the developed model for the ASE/EACVI and ESC CTRCD definitions resulted in an AUC of 0.922 (95% CI, 0.878-0.959) and 0.924 (95% CI, 0.869-0.970), respectively (Figure 4B and C). With these definitions, when 3-D LVEF, 2-D GLS, and 2-D GCS CTRCD criteria were not met, the probability of CMR CTRCD was 0%.
To enhance wider clinical application, we approximated the final model with 2-D LVEF, GLS, and GCS by replacing GCS with midslice circumferential strain only, with 2-D LVEF and GLS only, and with 3-D LVEF and GLS only. The model approximated by 2-D LVEF, GLS, and GCS (Figure 3B) had an AUC of 0.897 (95% CI, 0.841-0.943) for CMR CTRCD (Figure 4D), which was higher than individual components of the model used alone (eTable 5 in the Supplement). The estimated risk of CMR CTRCD was 60.6% with the 2-D LVEF criteria alone, and 0.7% when none of 2-D LVEF, GLS, and GCS CTRCD criteria were met. Removal of GCS from the models or using midventricular circumferential strain resulted in small reduction in the discrimination for CMR CTRCD (eFigure 6 in the Supplement).
Multiple Correspondence Analysis
Multiple correspondence analysis suggested that the first 5 dimensions (eFigure 7 in the Supplement) explained 94.0% and 96.9% of the variations in the CTRCD status of patients by 6 months into trastuzumab therapy and at end of treatment. The first dimension, which captured most of the variations, can be interpreted as the status of CTRCD. All LVEF and strain methods were aligned along this dimension, suggesting that they provided similar diagnostic information regarding CTRCD (eFigure 8 in the Supplement). This explains the 3-step regression tree model to identify CMR CTRCD. The second and third dimensions reflected hsTnl and BNP and none of the CMR or echocardiographic measures. Moreover, there was residual variation in GCS and GLS captured by dimensions 3 or 4 and 5.
Discussion
In this study among women with HER2-positive breast cancer receiving treatment with anthracyclines and trastuzumab undergoing cardiac surveillance, we proposed an algorithm for timely diagnosis of CTRCD considering echocardiographic parameters and serum biomarkers with CMR-defined CTRCD as the reference standard. Although this algorithm requires external validation, our primary finding was that the combined use of 3-D LVEF, 2-D GLS, and 2-D GCS may optimize the diagnosis of CMR CTRCD. HsTnI and BNP did not seem to improve the ability to diagnose CMR CTRCD. Although the use of echocardiographic 2-D LVEF alone instead of 3-D LVEF resulted in lower probability of identifying CMR CTRCD (60.6% vs 76.9%, respectively), when used together with 2-D GLS and 2-D GCS, the entire algorithm performed well, particularly in ruling out CMR CTRCD. Supporting our findings, multiple correspondence analyses suggested that echocardiographic LVEF and strain provided similar information to CMR CTRCD but hsTnI or BNP did not.
Identification of CTRCD Using LVEF
Women with HER2-positive breast cancer treated with anthracyclines and trastuzumab are at high risk of CTRCD.17,18,19 In our study, 27% of patients developed CMR CTRCD, which is similar to findings in prior studies.17,20 Accurate diagnosis of CTRCD allows for timely intervention promoting recovery of LVEF, preventing interruption of cancer therapy and its adverse outcomes,21,22 and decreasing the risk of future heart failure.6 Currently, 3-D LVEF is the recommended method for CTRCD surveillance3,4 based on its better agreement with CMR LVEF in patients with23,24 and without25 cancer and its superior reproducibility compared with 2-D LVEF.26,27 However, in this study we validated these recommendations using an external reference standard. Our study suggests that if only a single echocardiographic LVEF measure is to be used during cancer therapy, it should ideally be based on 3-D measurements. However, our study also demonstrates that echocardiographic 3-D LVEF alone can still miss CTRCD in some patients compared with CMR.
Strain and Biomarkers to Guide Diagnosis of CTRCD
The primary use of myocardial strain (GLS or GCS), hsTnI, and BNP has been to prognosticate CTRCD risk.2,5,17,28,29,30 The association between changes in GLS, GCS, or biomarkers and concurrent changes in LVEF or diagnosis of CTRCD has been less explored.2,31 Our finding that changes in echocardiographic GLS were associated with changes in CMR LVEF is concordant with recent echocardiography studies using 2-D LVEF.2,17,32,33 Also in agreement with prior literature, many more patients in our study experienced significant changes in GLS (ie, greater than 15%) occurring earlier than LVEF CTRCD, consistent with its described prognostic value.34 However, some patients who had a greater than 15% relative change in GLS also had concurrent CMR CTRCD. This is likely because imaging surveillance is performed every 3 months, possibly missing changes in GLS occurring before LVEF defined CTRCD. Similar findings were seen in the Strain Surveillance of Chemotherapy for Improving Cardiovascular Outcome (SUCCOUR) study.34
We identified an association between concurrent changes in BNP and changes in CMR LVEF, but not with hsTnI. But neither biomarker was associated with concurrent CMR CTRCD, consistent with a prior echocardiography study.31 Therefore, the clinical value of hsTnI and BNP maybe as an indicator of future CTRCD risk, as previously demonstrated.35 Alternatively, the lack of association may relate to the timing of blood draws, which were performed at the time of imaging in our study, or to the fact that CTRCD was defined as LVEF less than 55%, hence identifying only mild—although prognostically important36—LV dysfunction.
An Integrated Diagnostic Approach for CTRCD
Our primary finding is that an integrated approach using 3-D LVEF, GLS, and GCS may be useful in diagnosing CMR CTRCD, but this requires additional external validation. Our work suggests that to diagnose current CTRCD during sequential monitoring, one should first examine changes in 3-D LVEF and, if CTRCD criteria are met, the patient has a high probability of CTRCD (76.9%). If not, then the presence of a greater than 15% relative reduction in both GLS and GCS provides a probability of 15.9% for concurrent CMR CTRCD. In this scenario, it is prudent to carefully re-review the LVEF measures or to repeat the imaging study (eg, with ultrasonography enhancing agents) to ensure that a significant change in LVEF is not missed. Alternatively, a CMR study may be considered to assess LVEF. If not, these strain changes may reflect future risk of LVEF CTRCD as per prior literature.30 In this latter scenario, closer monitoring3 or CPT may be considered based on SUCCOUR34 and other studies.37,38 However, the clinical value of GLS and GCS to assess current CTRCD is when both measures fail to identify a significant change, reducing the probability of CMR CTRCD to 1%. Clinically, this approach can be useful in patients with borderline or uncertain changes in LVEF (common in clinical practice) where GLS and GCS can be used as an arbitrator of CTRCD.
The developed algorithm appears to work regardless of the CTRCD definition used (ie, cardiac review and evaluation committee, ASE/EACVI, or ESC). Particularly when LVEF and strain measures did not meet the ASE/EACVI or ESC CTRCD criteria, the probability of CMR CTRCD was 0%. Also, in centers where 3-D LVEF is not available or 3-D images are of inadequate quality, a 2-D LVEF–based algorithm as proposed could be used to rule out CMR CTRCD. Similarly, if only a single midslice circumferential strain is available or if measurement is unfeasible, the use of the midslice circumferential strain in the algorithm or removing GCS altogether can result in a small loss in discrimination for CMR CTRCD.
Limitations
This study has limitations, including the modest sample size with all cardiac imaging and clinical follow-up performed at a single center (despite recruitment from multiple centers) and absence of a validation cohort. Our findings require external validation in larger multicenter cohorts. As per clinical practice, studies with poor image quality were excluded from analysis, thereby possibly inflating the apparent accuracy of the echocardiography techniques. Although CMR was not performed at 9 months, if CTRCD occurred at this visit, it would have been transient, as we did perform CMR after trastuzumab therapy. We developed an algorithm to diagnose current CTRCD rather than a prognostic algorithm. The prognostic value of biomarkers and strain have been previously described.30,35
Conclusions
In women with HER2-positive breast cancer receiving anthracyclines and trastuzumab treatment, combined sequential use of echocardiographic 3-D LVEF, 2-D GLS, and GCS may be a reliable way to diagnose CTRCD. In this study, the algorithm performed better than its individual components alone. Although this algorithm requires external validation, it may allow for more objective decision-making regarding closer monitoring, cardiac therapy, or continued routine monitoring. In centers where 3-D LVEF and GCS are not available, the combined use of 2-D LVEF and GLS resulted in small loss of discriminatory accuracy for CMR CTRCD. BNP and hsTnI did not improve the ability to diagnose current CTRCD.
eMethods
eResults
eTable 1. Summary of imputed variables
eTable 2. Comparison of baseline characteristics of patients who were withdrawn after enrollment in the study versus the patients who completed the study
eTable 3. Tabulation of number of patients with and without agreement with CMR defined CTRCD for the various assessment methods studied
eTable 4. Performance metrics for each echo and serum biomarkers at various time-points during follow-up in reference to CMR CTRCD
eTable 5. The area under the curve (AUC) for the full models and for each echocardiography modality. Compared to each individual echocardiography method, the AUC for the full models (2D or 3D) were higher suggesting that they have better discriminatory value for CTRCD than any individual component of the model
eFigure 1. Illustration of the number of patients screened, approached, consented, and those who completed the study
eFigure 2. Concurrent association between echocardiographic parameters and serum biomarkers and CMR LVEF (Panel A) and CMR CTRCD (Panel B)
eFigure 3. Concurrent association between echocardiographic parameters and serum biomarkers and CMR LVEF (Panel A) and CMR defined CTRCD (Panel B) demonstrated using standardized units for the various imaging measures
eFigure 4. Left ventricular ejection fraction and strain measurements at baseline and at time of cancer therapy related cardiac dysfunction as defined by each of the five imaging methods
eFigure 5. Baseline and minimal LVEF or strain measurements during follow-up by the various methods in patients who did not develop cancer therapy related cardiac dysfunction
eFigure 6. ROC curves for models estimating risk of CTRCD by replacement of GCS with mid slice circumferential strain or complete removal of GCS
eFigure 7. Screeplots summarizing the proportion of variations explained by the various dimensions at 6- and 15-months follow-up
eFigure 8. Biplots represent the results of the multivariate correspondence analysis demonstrating the various CTRCD statues
References
- 1.Drafts BC, Twomley KM, D’Agostino R Jr, et al. Low to moderate dose anthracycline-based chemotherapy is associated with early noninvasive imaging evidence of subclinical cardiovascular disease. JACC Cardiovasc Imaging. 2013;6(8):877-885. doi: 10.1016/j.jcmg.2012.11.017 [DOI] [PMC free article] [PubMed] [Google Scholar]
- 2.Houbois CP, Nolan M, Somerset E, et al. Serial cardiovascular magnetic resonance strain measurements to identify cardiotoxicity in breast cancer: comparison with echocardiography. JACC Cardiovasc Imaging. 2021;14(5):962-974. doi: 10.1016/j.jcmg.2020.09.039 [DOI] [PubMed] [Google Scholar]
- 3.Plana JC, Galderisi M, Barac A, et al. Expert consensus for multimodality imaging evaluation of adult patients during and after cancer therapy: a report from the American Society of Echocardiography and the European Association of Cardiovascular Imaging. J Am Soc Echocardiogr. 2014;27(9):911-939. doi: 10.1016/j.echo.2014.07.012 [DOI] [PubMed] [Google Scholar]
- 4.Čelutkienė J, Pudil R, López-Fernández T, et al. Role of cardiovascular imaging in cancer patients receiving cardiotoxic therapies: a position statement on behalf of the Heart Failure Association (HFA), the European Association of Cardiovascular Imaging (EACVI) and the Cardio-Oncology Council of the European Society of Cardiology (ESC). Eur J Heart Fail. 2020;22(9):1504-1524. doi: 10.1002/ejhf.1957 [DOI] [PubMed] [Google Scholar]
- 5.Pudil R, Mueller C, Čelutkienė J, et al. Role of serum biomarkers in cancer patients receiving cardiotoxic cancer therapies: a position statement from the Cardio-Oncology Study Group of the Heart Failure Association and the Cardio-Oncology Council of the European Society of Cardiology. Eur J Heart Fail. 2020;22(11):1966-1983. doi: 10.1002/ejhf.2017 [DOI] [PubMed] [Google Scholar]
- 6.Cardinale D, Colombo A, Lamantia G, et al. Anthracycline-induced cardiomyopathy: clinical relevance and response to pharmacologic therapy. J Am Coll Cardiol. 2010;55(3):213-220. doi: 10.1016/j.jacc.2009.03.095 [DOI] [PubMed] [Google Scholar]
- 7.Lang RM, Badano LP, Mor-Avi V, et al. Recommendations for cardiac chamber quantification by echocardiography in adults: an update from the American Society of Echocardiography and the European Association of Cardiovascular Imaging. Eur Heart J Cardiovasc Imaging. 2015;16(3):233-270. doi: 10.1093/ehjci/jev014 [DOI] [PubMed] [Google Scholar]
- 8.Seidman A, Hudis C, Pierri MK, et al. Cardiac dysfunction in the trastuzumab clinical trials experience. J Clin Oncol. 2002;20(5):1215-1221. doi: 10.1200/JCO.2002.20.5.1215 [DOI] [PubMed] [Google Scholar]
- 9.Zamorano JL, Lancellotti P, Rodriguez Muñoz D, et al. ; ESC Scientific Document Group . 2016 ESC Position Paper on cancer treatments and cardiovascular toxicity developed under the auspices of the ESC Committee for Practice Guidelines: The Task Force for cancer treatments and cardiovascular toxicity of the European Society of Cardiology (ESC). Eur Heart J. 2016;37(36):2768-2801. doi: 10.1093/eurheartj/ehw211 [DOI] [PubMed] [Google Scholar]
- 10.Ponikowski P, Voors AA, Anker SD, et al. ; ESC Scientific Document Group . 2016 ESC Guidelines for the diagnosis and treatment of acute and chronic heart failure: The Task Force for the diagnosis and treatment of acute and chronic heart failure of the European Society of Cardiology (ESC) developed with the special contribution of the Heart Failure Association (HFA) of the ESC. Eur Heart J. 2016;37(27):2129-2200. doi: 10.1093/eurheartj/ehw128 [DOI] [PubMed] [Google Scholar]
- 11.Fitzmaurice GM, Laird NM, Ware JH. Applied Longitudinal Analysis, 2nd Edition. John Wiley & Sons; 2012. [Google Scholar]
- 12.Azur MJ, Stuart EA, Frangakis C, Leaf PJ. Multiple imputation by chained equations: what is it and how does it work? Int J Methods Psychiatr Res. 2011;20(1):40-49. doi: 10.1002/mpr.329 [DOI] [PMC free article] [PubMed] [Google Scholar]
- 13.White IR, Royston P, Wood AM. Multiple imputation using chained equations: issues and guidance for practice. Stat Med. 2011;30(4):377-399. doi: 10.1002/sim.4067 [DOI] [PubMed] [Google Scholar]
- 14.Hothorn T, Hornik K, Zeileis A.. Unbiased recursive partitioning: a conditional inference framework. J Comput Graph Stat. 2012;15(3):651-674. doi: 10.1198/106186006X133933 [DOI] [Google Scholar]
- 15.Steyerberg EW, Vickers AJ, Cook NR, et al. Assessing the performance of prediction models: a framework for traditional and novel measures. Epidemiology. 2010;21(1):128-138. doi: 10.1097/EDE.0b013e3181c30fb2 [DOI] [PMC free article] [PubMed] [Google Scholar]
- 16.Greenacre M. Correspondence analysis in medical research. Stat Methods Med Res. 1992;1(1):97-117. doi: 10.1177/096228029200100106 [DOI] [PubMed] [Google Scholar]
- 17.Narayan HK, Finkelman B, French B, et al. Detailed echocardiographic phenotyping in breast cancer patients: associations with ejection fraction decline, recovery, and heart failure symptoms over 3 years of follow-up. Circulation. 2017;135(15):1397-1412. doi: 10.1161/CIRCULATIONAHA.116.023463 [DOI] [PMC free article] [PubMed] [Google Scholar]
- 18.Thavendiranathan P, Abdel-Qadir H, Fischer HD, et al. Risk-imaging mismatch in cardiac imaging practices for women receiving systemic therapy for early-stage breast cancer: a population-based cohort study. J Clin Oncol. 2018;36(30):2980-2987. doi: 10.1200/JCO.2018.77.9736 [DOI] [PubMed] [Google Scholar]
- 19.Upshaw JN, Finkelman B, Hubbard RA, et al. Comprehensive assessment of changes in left ventricular diastolic function with contemporary breast cancer therapy. JACC Cardiovasc Imaging. 2020;13(1 Pt 2):198-210. doi: 10.1016/j.jcmg.2019.07.018 [DOI] [PMC free article] [PubMed] [Google Scholar]
- 20.Demissei BG, Finkelman BS, Hubbard RA, et al. Detailed phenotyping reveals distinct trajectories of cardiovascular function and symptoms with exposure to modern breast cancer therapy. Cancer. 2019;125(16):2762-2771. doi: 10.1002/cncr.32149 [DOI] [PMC free article] [PubMed] [Google Scholar]
- 21.Copeland-Halperin RS, Al-Sadawi M, Patil S, et al. Early trastuzumab interruption and recurrence-free survival in ERBB2-positive breast cancer. JAMA Oncol. 2020;6(12):1971-1972. doi: 10.1001/jamaoncol.2020.4749 [DOI] [PMC free article] [PubMed] [Google Scholar]
- 22.Rushton M, Johnson C, Dent S. Trastuzumab-induced cardiotoxicity: testing a clinical risk score in a real-world cardio-oncology population. Curr Oncol. 2017;24(3):176-180. doi: 10.3747/co.24.3349 [DOI] [PMC free article] [PubMed] [Google Scholar]
- 23.Walker J, Bhullar N, Fallah-Rad N, et al. Role of three-dimensional echocardiography in breast cancer: comparison with two-dimensional echocardiography, multiple-gated acquisition scans, and cardiac magnetic resonance imaging. J Clin Oncol. 2010;28(21):3429-3436. doi: 10.1200/JCO.2009.26.7294 [DOI] [PubMed] [Google Scholar]
- 24.Armstrong GT, Plana JC, Zhang N, et al. Screening adult survivors of childhood cancer for cardiomyopathy: comparison of echocardiography and cardiac magnetic resonance imaging. J Clin Oncol. 2012;30(23):2876-2884. doi: 10.1200/JCO.2011.40.3584 [DOI] [PMC free article] [PubMed] [Google Scholar]
- 25.Dorosz JL, Lezotte DC, Weitzenkamp DA, Allen LA, Salcedo EE. Performance of 3-dimensional echocardiography in measuring left ventricular volumes and ejection fraction: a systematic review and meta-analysis. J Am Coll Cardiol. 2012;59(20):1799-1808. doi: 10.1016/j.jacc.2012.01.037 [DOI] [PMC free article] [PubMed] [Google Scholar]
- 26.Lambert J, Lamacie M, Thampinathan B, et al. Variability in echocardiography and MRI for detection of cancer therapy cardiotoxicity. Heart. 2020;106(11):817-823. doi: 10.1136/heartjnl-2019-316297 [DOI] [PubMed] [Google Scholar]
- 27.Thavendiranathan P, Grant AD, Negishi T, Plana JC, Popović ZB, Marwick TH. Reproducibility of echocardiographic techniques for sequential assessment of left ventricular ejection fraction and volumes: application to patients undergoing cancer chemotherapy. J Am Coll Cardiol. 2013;61(1):77-84. doi: 10.1016/j.jacc.2012.09.035 [DOI] [PubMed] [Google Scholar]
- 28.Cardinale D, Colombo A, Torrisi R, et al. Trastuzumab-induced cardiotoxicity: clinical and prognostic implications of troponin I evaluation. J Clin Oncol. 2010;28(25):3910-3916. doi: 10.1200/JCO.2009.27.3615 [DOI] [PubMed] [Google Scholar]
- 29.Ky B, Putt M, Sawaya H, et al. Early increases in multiple biomarkers predict subsequent cardiotoxicity in patients with breast cancer treated with doxorubicin, taxanes, and trastuzumab. J Am Coll Cardiol. 2014;63(8):809-816. doi: 10.1016/j.jacc.2013.10.061 [DOI] [PMC free article] [PubMed] [Google Scholar]
- 30.Oikonomou EK, Kokkinidis DG, Kampaktsis PN, et al. Assessment of prognostic value of left ventricular global longitudinal strain for early prediction of chemotherapy-induced cardiotoxicity: a systematic review and meta-analysis. JAMA Cardiol. 2019;4(10):1007-1018. doi: 10.1001/jamacardio.2019.2952 [DOI] [PMC free article] [PubMed] [Google Scholar]
- 31.Putt M, Hahn VS, Januzzi JL, et al. Longitudinal changes in multiple biomarkers are associated with cardiotoxicity in breast cancer patients treated with doxorubicin, taxanes, and trastuzumab. Clin Chem. 2015;61(9):1164-1172. doi: 10.1373/clinchem.2015.241232 [DOI] [PMC free article] [PubMed] [Google Scholar]
- 32.Narayan HK, French B, Khan AM, et al. Noninvasive measures of ventricular-arterial coupling and circumferential strain predict cancer therapeutics-related cardiac dysfunction. JACC Cardiovasc Imaging. 2016;9(10):1131-1141. doi: 10.1016/j.jcmg.2015.11.024 [DOI] [PMC free article] [PubMed] [Google Scholar]
- 33.Zhang KW, Finkelman BS, Gulati G, et al. Abnormalities in 3-dimensional left ventricular mechanics with anthracycline chemotherapy are associated with systolic and diastolic dysfunction. JACC Cardiovasc Imaging. 2018;11(8):1059-1068. doi: 10.1016/j.jcmg.2018.01.015 [DOI] [PMC free article] [PubMed] [Google Scholar]
- 34.Thavendiranathan P, Negishi T, Somerset E, et al. ; SUCCOUR Investigators . Strain-guided management of potentially cardiotoxic cancer therapy. J Am Coll Cardiol. 2021;77(4):392-401. doi: 10.1016/j.jacc.2020.11.020 [DOI] [PubMed] [Google Scholar]
- 35.Michel L, Mincu RI, Mahabadi AA, et al. Troponins and brain natriuretic peptides for the prediction of cardiotoxicity in cancer patients: a meta-analysis. Eur J Heart Fail. 2020;22(2):350-361. doi: 10.1002/ejhf.1631 [DOI] [PubMed] [Google Scholar]
- 36.Yu AF, Flynn JR, Moskowitz CS, et al. Long-term cardiopulmonary consequences of treatment-induced cardiotoxicity in survivors of erbb2-positive breast cancer. JAMA Cardiol. 2020;5(3):309-317. doi: 10.1001/jamacardio.2019.5586 [DOI] [PMC free article] [PubMed] [Google Scholar]
- 37.Negishi K, Negishi T, Haluska BA, Hare JL, Plana JC, Marwick TH. Use of speckle strain to assess left ventricular responses to cardiotoxic chemotherapy and cardioprotection. European heart journal cardiovascular Imaging. 2014;15(3):324-331. doi: 10.1093/ehjci/jet159 [DOI] [PubMed] [Google Scholar]
- 38.Santoro C, Esposito R, Lembo M, et al. Strain-oriented strategy for guiding cardioprotection initiation of breast cancer patients experiencing cardiac dysfunction. Eur Heart J Cardiovasc Imaging. 2019;20(12):1345-1352. doi: 10.1093/ehjci/jez194 [DOI] [PubMed] [Google Scholar]
Associated Data
This section collects any data citations, data availability statements, or supplementary materials included in this article.
Supplementary Materials
eMethods
eResults
eTable 1. Summary of imputed variables
eTable 2. Comparison of baseline characteristics of patients who were withdrawn after enrollment in the study versus the patients who completed the study
eTable 3. Tabulation of number of patients with and without agreement with CMR defined CTRCD for the various assessment methods studied
eTable 4. Performance metrics for each echo and serum biomarkers at various time-points during follow-up in reference to CMR CTRCD
eTable 5. The area under the curve (AUC) for the full models and for each echocardiography modality. Compared to each individual echocardiography method, the AUC for the full models (2D or 3D) were higher suggesting that they have better discriminatory value for CTRCD than any individual component of the model
eFigure 1. Illustration of the number of patients screened, approached, consented, and those who completed the study
eFigure 2. Concurrent association between echocardiographic parameters and serum biomarkers and CMR LVEF (Panel A) and CMR CTRCD (Panel B)
eFigure 3. Concurrent association between echocardiographic parameters and serum biomarkers and CMR LVEF (Panel A) and CMR defined CTRCD (Panel B) demonstrated using standardized units for the various imaging measures
eFigure 4. Left ventricular ejection fraction and strain measurements at baseline and at time of cancer therapy related cardiac dysfunction as defined by each of the five imaging methods
eFigure 5. Baseline and minimal LVEF or strain measurements during follow-up by the various methods in patients who did not develop cancer therapy related cardiac dysfunction
eFigure 6. ROC curves for models estimating risk of CTRCD by replacement of GCS with mid slice circumferential strain or complete removal of GCS
eFigure 7. Screeplots summarizing the proportion of variations explained by the various dimensions at 6- and 15-months follow-up
eFigure 8. Biplots represent the results of the multivariate correspondence analysis demonstrating the various CTRCD statues