Abstract
Assessment of surface water quality in the Mississippi Delta is essential to quantify the eutrophication of the Gulf of Mexico. This study estimated the characteristics and variations of surface water quality at three study sites in the Big Sunflower River Watershed (BSRW) within the Mississippi Delta using Kruskal-Wallis, Dunn, Mann-Kendall, and Pettitt tests. In general, contents of some water quality constituents such as nitrate-nitrogen (NO3 − N) and total phosphorus (TP) in the BSRW varied from site to site each year, whereas variations of other constituents such as pH and dissolved oxygen (DO) each year were basically not significant. The highest median concentrations were found in spring for NO3 − Nand total nitrogen (TN); in summer for specific conductance (SC), Na, and Cl; and in winter for DO. Mann-Kendall trend analysis revealed that there was an increasing annual trend at Leland but a decreasing annual trend at Merigold for NO3 − Nconcentrations even though such changes were very small, whereas there was no annual trend for TP at any of the three study sites. Pettitt’s test further identified that the NO3 − N concentrations had an abrupt increase in February 2009 at the median value of 0.44 mg L−1 in Leland and an abrupt decrease in June 2012 at the median value of 3.65 mg L−1 in Merigold. A very good linear correlation exited between total dissolved solid (TDS) and magnesium (Mg) in the BSRW, which could be used to estimate TDS from Mg concentrations for this watershed when the data for TDS are absent.
Keywords: Mississippi Delta, Nonparametric analysis, Stream water quality
1. Introduction
Surface water pollution with excess nutrients, chemicals, and sediments has been an issue of increasing environmental concerns worldwide. Agricultural, forested, industrial, and urban activities are considered as the major sources of chemicals and nutrients to aquatic ecosystems (Dodds and Welch 2000; Ouyang et al. 2013). Biologically available nutrients in excess can lead to diverse problems such as harmful algal blooms, low dissolved oxygen (DO), fish kills, and loss of biodiversity. Harmful chemicals can seriously degrade aquatic ecosystems and impair the use of water for drinking, industry, agriculture, and recreation and for other purposes (Ouyang 2005). This is also true in the Big Sunflower River Watershed (BSRW), Mississippi. Based on the Mississippi Water Quality Criteria for Interstate and Intrastate, the Big Sunflower River (BSR) has been classified as “ephemeral,” indicating its waters do not support a fisheries resource and are not usable for human consumption or aquatic life (MDEQ (Mississippi Department of Environmental Quality) 2007). The BSR is also included on the US-Environmental Protection Agency (EPA) Section 303(d) List as of an impaired water body in Mississippi.
BSRW is well known as an area of intensive crop production, mainly for soybean, corn, rice, and cotton. The major water quality concerns in this area are nutrients, organics, low DO, suspended solids, turbidity, and pathogens (MDEQ (Mississippi Department of Environmental Quality) 2002, 2003). Row-crop agriculture is the main nonpoint source pollution of nutrients, organics, and sediment; whereas wildlife, livestock, and urbanization are the major nonpoint source pollution of pathogens (MDEQ (Mississippi Department of Environmental Quality) 2002). Ammonia, nitrate, phosphate, algal biomass, carbonaceous biochemical oxygen demand, DO, and organic nitrogen are among the key concerning pollutants (MDEQ (Mississippi Department of Environmental Quality) 2003). These pollutions originate primarily from surface runoff generated from agricultural lands, discharge from ditches serving agricultural croplands, naturally-occurring organic inputs, and atmospheric deposition.
With better understanding of the importance of drinking water quality to public health, raw water quality to ecosystem, and eutrophication of the Gulf of Mexico (GOM), there is a greater need to evaluate surface water quality in Mississippi Delta. Restoration and protection of surface water quality in this region have been a challenge to local, state, and federal agencies. While the control of surface runoff, ditch discharge, groundwater seepage, and atmospheric deposition is necessary to reduce the nonpoint source pollution, development of a long-term surface water monitoring network is a critical element in these efforts. Long-term surface water quality data will benefit government agencies, university researchers, and private sectors working for assessing and preventing the pollutant load in the BSR and Lower Mississippi River. Additionally, understanding the water quality status and pollutant load in the BSR and Lower Mississippi River isa key to quantify the effects of elevated nutrient loading on eutrophication of the GOM.
Currently, water quality models such as SPARROW and SWAT have been developed for the BSRW to estimate stream flow and pollutant load (MDEQ (Mississippi Department of Environmental Quality) 2010; Rebich et al. 2011; Jayakody et al. 2013; Barlow and Coupe 2014). The usefulness of these models, however, hinges on the availability of long-term measured data for model calibration and validation. Up to date, limited field measured data for surface water quality are available in the BSRW. Pennington (2004) conducted monthly surface water quality sampling at 22 sites in the major interior Mississippi Delta streams for a short-term period and concluded that turbidity in the Mississippi Delta range from 8 to 2328 NTU. Shields and Knight (2011) performed a three-year study of water chemistry, fish, and physical habitat in northwestern Mississippi. These authors reported that fish species richness is directly related to the DO concentration in the river. There are also some US Geological Survey (USGS) surface water monitoring stations in the BSRW that have performed intermittent measurements of surface water quality. Additionally, some fecal coliform data from two streams in the BSRW have been collected from 2003 to 2006 (MDEQ (Mississippi Department of Environmental Quality) 2010). A thorough literature search, however, found that no long-term and continued surface water quality monitoring network has been established in the BSRW. To fill this research gap, we have initiated three monitoring stations in the BSRW to measure surface water quality quarterly since May 2013.
The goal of this study was to assess the characteristics, seasonal variations, annual trends, and correlations of some surface water quality constituents in the BSRW from Mississippi Delta. Our hypothesis is that the water quality in this watershed is affected by climate change and land management in recent years. The study was accomplished by using nonparametric statistical methods in conjunction with two sets of field measured data, one from our research group and the other from USGS. Our specific objectives were to (1) characterize the general surface water quality status in the BSRW; (2) evaluate the seasonalities and annual trends of surface water quality in the region; and (3) identify the correlations among some surface water quality constituents.
2. Materials and Methods
2.1. Study Site
The BSRW is located in northwest Mississippi, which is bounded by the Mississippi River in the west side and by the Bluff Hills in the east side (Fig. 1). It is an area of 10,488 km2 with intensive agricultural production for corn, soybean, cotton, and rice. The BSRW covers eleven Mississippi counties, including Coahoma, Bolivar, Tallahatchie, Sunflower, Leflore, Washington, Humphreys, Sharkey, Issaquena, Yazoo, and Warren. The watershed contains mostly clay soils and is dominated by 81% cropland, 13% wetlands, 3% water bodies, 2% urban areas, and 1% other uses. Three study sites in the BSRW have been selected for surface water quality measurements since May 2013 (Fig. 1). These sites are at the same locations as the USGS gauge stations, namely the Deer Creek East of Leland, MS (no. 0728875070), Big Sunflower River at Sunflower, MS (no. 07288500), and Big Sunflower River near Merigold, MS (no. 07288280). The reason for selecting the sites at the USGS gauge stations is that stream discharge data and weather variables are available from USGS. These data are useful for estimating how hydrological processes and weather variables affect the surface water quality in the BSRW.
Fig. 1.
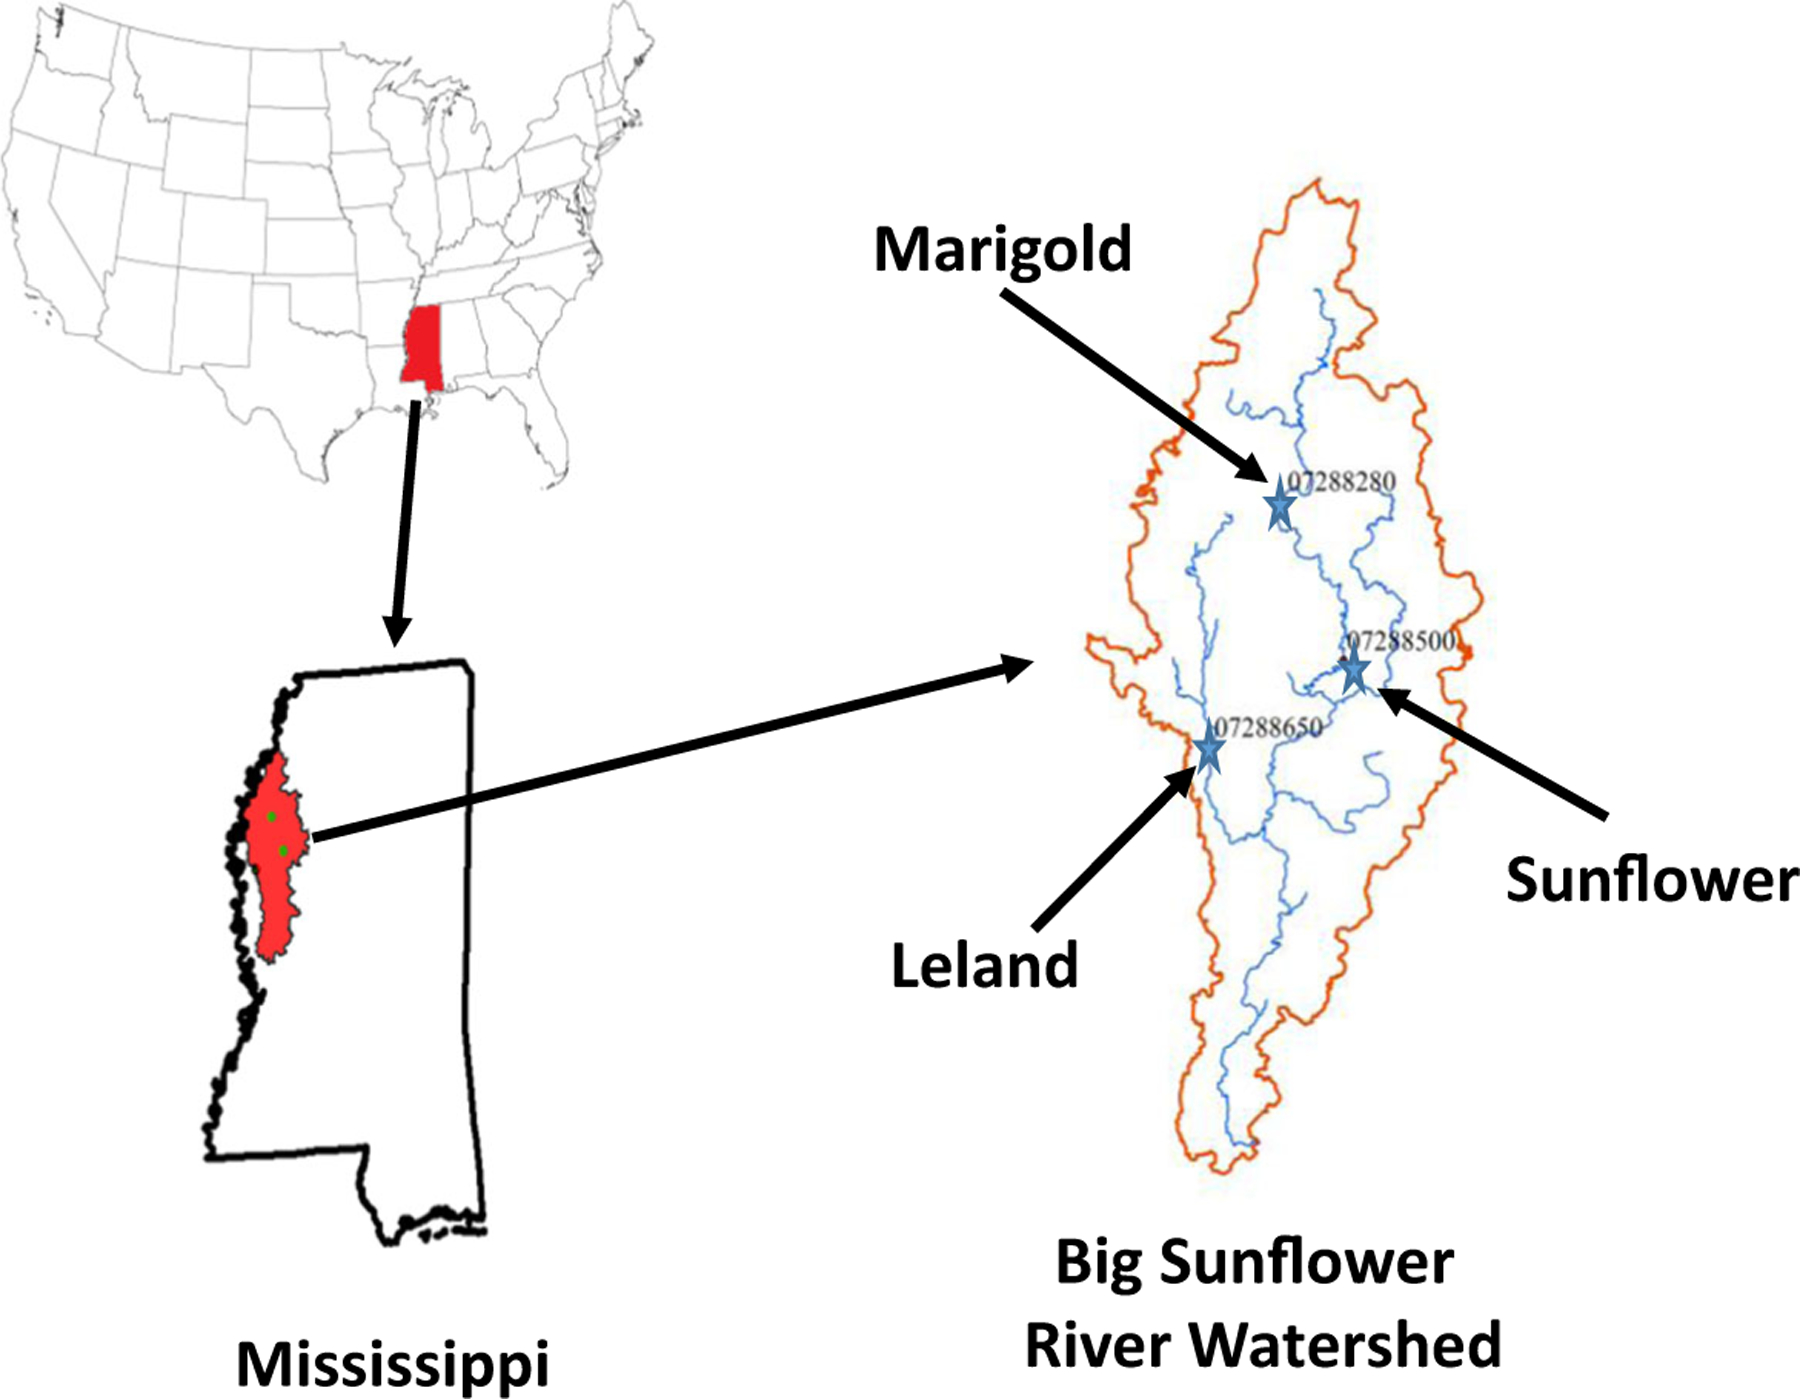
Locations of three surface water quality study sites at Leland, Marigold, and Sunflower in the Big Sunflower River Watershed, Mississippi
2.2. Measurement, Sampling, and Data Analysis
Two methods of measurements were used in this study; one was in-situ measurement by placing the probes of YSI meter (Yellow Springs Instrument Professional Multi-Parameter Meter) directly into the streams and the other was to grab surface water samples for lab analysis. Water quality constituents such as DO, oxidation-reduction potential (ORP), pH, total dissolved solid (TDS), specific conductance (SC), temperature, nitrate-nitrogen (NO3 − N), and ammonium-nitrogen (NH4-N) were measured with YSI meters, whereas other water quality constituents such as potassium (K), TP, and cations from the grab samples were analyzed at the USDA-Agricultural Research Service laboratory in Starkville, MS. The measurements were performed monthly from May 2013 to May 2014 and then quarterly from 2014 to 2017. All of the in-situ measurements and surface water sampling procedures are in compliance with the Standard Operation Protocols developed by US-EPA (https://water.usgs.gov/owq/methods.html).
Additionally, available surface water quality data from 1997 to 2017 for the above three monitoring stations were also downloaded from their respective USGS websites. These data were not measured on a regular basis and were discontinuous and intermittent. Nonetheless, these data have been merged into our measured data for a longer period of analysis.
Statistical analysis of the dataset was performed using the nonparametric methods. Kruskal-Wallis test was used to examine if there was a significant difference among the seasons and the Dunn test was employed to determine the significance level at α = 0.05. The annual trends of the water quality constituents were assessed using Mann-Kendall trend analysis and Pettitt test. Although the Kruskal-Wallis, Dunn, and Mann-Kendall analyses are very common statistical methods, the Pettitt test has not been widely used in surface water quality analysis and therefore is worthy of a moderate description here.
Pettitt test is a tool to detect a single abrupt change point in the mean or median values of a time series dataset (Pettitt 1979). In the Pettitt test, the null hypothesis (H0), no change (t = T), is tested against the alternative hypothesis (Ha), change (1 ≤ t < T), using the following nonparametric K statistic (Pettitt 1979):
| (1) |
with
| (2) |
and
| (3) |
where T is the time and t is the time when the time series variable x has an abrupt change point. or is statistically significant if the value p is < 0.5 in this study. When this occurs, the time t is the point of the abrupt change. All of these statistical analyses were accomplished in R-statistical packages (Mangiafico 2016).
3. Results and Discussion
3.1. General Water Quality Assessment
Surface water quality in the BSRW was characterized by physical and chemical constituents. The chemical constituents selected in this study include major nutrient species such as NH4 − N, NO3 − N, TN, TP, and K; major cations such as calcium (Ca), magnesium (Mg), manganese (Mn), sodium (Na), and iron (Fe); and heavy metals such as copper (Cu) and zinc (Zn). The physical constituents used in this study were temperature, DO, SC, pH, ORP, and TDS. Table 1 summarizes the descriptive statistics, including the mean, minimum, maximum, median, standard errors, and the number of samples of the water quality constituents used in this study. It should be noted that some water quality constituents used in this study had the long-term (about 20 years) data records while others had only about 4-year data records, which can be told by the number of samples from Table 1.
Table 1.
Descriptive statistics for surface water quality data collected at the Leland, Marigold, and Sunflower study sites in the BSRW
| Parameter | Temperature (°C) | DO (mg/L) | Specific conductance (μhos/cm) | pH | ORP (mV) | TDS (mg/L) | NH4-N (mg/L) | NO3-N (mg/L) | Ca (mg/L) | CL (mg/L) | K (mg/L) | Mg (mg/L) | Na (mg/L) | TP (mg/L) | Cu (mg/L) | Mn (mg/L) | Zn (mg/L) | TN (mg/L) |
|---|---|---|---|---|---|---|---|---|---|---|---|---|---|---|---|---|---|---|
| Leland | ||||||||||||||||||
| Mean | 21.71 | 6.98 | 325.97 | 7.40 | 139.95 | 84.43 | 0.40 | 0.68 | 5.92 | 17.22 | 5.04 | 4.48 | 10.96 | 0.12 | 1.37 | 50.32 | 0.01 | 1.97 |
| Standard error | 0.31 | 0.09 | 7.44 | 0.02 | 8.98 | 2.07 | 0.05 | 0.04 | 0.19 | 3.01 | 0.32 | 0.33 | 0.45 | 0.01 | 1.36 | 6.76 | 0.00 | 0.07 |
| Median | 23.70 | 6.70 | 299.50 | 7.40 | 138.45 | 80.00 | 0.30 | 0.49 | 5.30 | 13.26 | 4.95 | 4.20 | 8.49 | 0.11 | 0.01 | 13.00 | 0.01 | 1.70 |
| Minimum | 1.20 | 1.10 | 44.00 | 6.30 | 68.40 | 24.00 | 0.05 | 0.02 | 0.56 | 8.17 | 1.70 | 2.08 | 1.14 | 0.06 | 0.00 | 0.00 | 0.00 | 0.25 |
| Maximum | 34.40 | 14.40 | 764.00 | 9.96 | 240.80 | 409.00 | 1.22 | 4.31 | 16.00 | 77.00 | 8.13 | 8.82 | 35.75 | 0.23 | 30.00 | 686.00 | 0.03 | 6.70 |
| No. of samples | 628 | 599 | 618 | 603 | 26 | 307 | 44 | 357 | 356 | 22 | 22 | 22 | 294 | 22 | 22 | 173 | 21 | 251 |
| Merigold | ||||||||||||||||||
| Mean | 23.12 | 6.70 | 274.76 | 7.49 | 165.71 | 132.15 | 1.22 | 3.09 | 12.39 | 21.15 | 5.67 | 7.08 | 11.81 | 0.20 | 0.01 | 3.88 | 0.01 | 1.73 |
| Standard error | 0.96 | 0.27 | 18.79 | 0.10 | 8.79 | 16.55 | 0.20 | 0.51 | 2.45 | 2.54 | 0.46 | 0.95 | 1.43 | 0.03 | 0.00 | 1.71 | 0.00 | 0.24 |
| Median | 26.12 | 6.19 | 219.00 | 7.40 | 157.30 | 95.00 | 1.20 | 2.07 | 7.61 | 16.58 | 5.18 | 5.56 | 9.50 | 0.15 | 0.01 | 0.00 | 0.01 | 1.50 |
| Minimum | 5.26 | 1.03 | 49.00 | 5.20 | 81.80 | 45.00 | 0.00 | 0.13 | 2.43 | 6.89 | 2.29 | 2.39 | 3.14 | 0.03 | 0.00 | 0.00 | 0.00 | 1.00 |
| Maximum | 33.90 | 11.58 | 636.00 | 10.73 | 243.80 | 401.70 | 4.39 | 11.80 | 51.51 | 58.21 | 13.29 | 19.08 | 29.36 | 0.66 | 0.02 | 30.70 | 0.03 | 2.50 |
| No. of samples | 68 | 61 | 68 | 66 | 23 | 36 | 25 | 34 | 25 | 26 | 26 | 26 | 26 | 35 | 21 | 26 | 21 | 7 |
| Sunflower | ||||||||||||||||||
| Mean | 20.25 | 7.09 | 262.01 | 7.37 | 173.09 | 155.86 | 0.70 | 2.42 | 9.52 | 22.36 | 4.72 | 7.48 | 11.92 | 0.24 | 0.01 | 0.52 | 0.01 | 1.63 |
| Mean | 0.91 | 0.27 | 14.81 | 0.07 | 11.58 | 16.97 | 0.15 | 0.52 | 0.70 | 2.69 | 0.32 | 0.95 | 1.30 | 0.03 | 0.00 | 0.30 | 0.00 | 0.18 |
| Median | 22.70 | 6.50 | 211.00 | 7.40 | 157.60 | 119.00 | 0.28 | 1.42 | 9.60 | 16.00 | 4.40 | 5.42 | 10.20 | 0.23 | 0.01 | 0.00 | 0.00 | 1.35 |
| Minimum | 1.40 | 1.11 | 52.00 | 3.58 | 88.20 | 42.00 | 0.00 | 0.02 | 0.72 | 7.93 | 1.50 | 2.04 | 3.22 | 0.01 | 0.00 | 0.00 | 0.00 | 0.49 |
| Maximum | 34.70 | 15.00 | 655.00 | 9.13 | 351.30 | 413.30 | 5.73 | 19.37 | 23.00 | 62.00 | 9.32 | 22.00 | 29.40 | 1.29 | 0.02 | 5.55 | 0.02 | 4.20 |
| No. of samples | 111 | 88 | 105 | 103 | 25 | 37 | 44 | 44 | 49 | 33 | 33 | 33 | 33 | 56 | 21 | 24 | 21 | 28 |
Results showed that the median contents of certain water quality constituents varied from location to location during the measured periods while others had very small variations with sites at the same periods. For example, the median NO3 − Nwas 0.49 mg L−1 at Leland, 2.07 mg L−1 at Merigold, and 1.42 mg L−1 at Sunflower (Table 1), reflecting the differences in land use and fertilizer application among the three sites. Although all of the three study sites are located in row crop lands, the Leland site is surrounded by the residential area where less N fertilizer is normally applied (Graves et al. 2004). As a result, the median NO3 − N at Leland was lower than at the other two sites. It should be noted that the median concentrations rather than the average concentrations were used for comparisons in this study because the measured data are skewed. For a nonparametric (or not a normal distribution) dataset, the median values are commonly used for comparisons.
A similar result was observed for TP. That is, the median TP was lower at Leland (0.11 mg L−1) than at Merigold (0.15 mg L−1) and Sunflower (0.23 mg L−1) (Table 1) due to the same reason as forNO3 − N. In contrast, there were very little changes in medians of pH at the three study sites. Results indicated that the acidity at these streams was more or less unchanged over the past 20 years.
Surface water quality criteria, developed by Mississippi Department of Environmental Quality (MDEQ), US-EPA, and USDA-Natural Resources Conservation Service (NRCS), are given in Table 2. In this study, only the criteria from MDEQ were used for water quality assessment, while the criteria developed by US-EPA and USDA-NRCS were listed for reference. Comparison of the surface water quality constituents (Table 1) against these criteria (Table 2) showed that the maximum NO3 − N at Merigold (11.8 mg L−1) and Sunflower (19.37 mg L−1) exceeded the MDEQ’s criterion of 10 mg L−1. There were only two samples (measured by USGS) at Merigold out of 34 samples and two samples (measured by our group) at Sunflower out of 35 samples exceeding this criterion for the period from 1997 to 2017. Nitrogen is an essential element for plant and animal growth and nourishment, but excess nitrogen species such as NO3 − N in surface water can cause a number of adverse health and ecological effects such as eutrophication (https://water.usgs.gov/edu/nitrogen. html). It should be noted that USGS did not measure these water quality constituents on a regular basis (intermittently from 1997 to 2017) although we had conducted our measurements quarterly since 2013.
Table 2.
Surface water quality criteria from MDEQ, US-EPA, and USDA-NRCS. Consult the references in this table for details about the criteria
| Constituent | Fresh water description | Reference |
|---|---|---|
| Temp (°C) | The maximum water temperature shall not exceed 32.2 °C in streams, lakes, and reservoirs. In addition, the discharge of any heatedwaters into a stream, lake, or reservoir shall not raise temperatures more than 2.8 °C above natural conditions for temperatures. | MDEQ 2007 |
| DO (mg/L) | Dissolved oxygen concentrations shall be maintained at a daily average of not less than 5.0 mg/l with an instantaneous minimum of not less than 4.0 mg/l. | MDEQ 2007 |
| Specific conductance (uhos/cm) | 1000 | MDEQ 2007 |
| pH | The normal pH of the waters shall be 6.0 to 9.0 and shall not be caused to vary more than 1.0 unit within this range. | MDEQ 2007 |
| *ORP (mV) | No surface water quality criteron has been developed for ORP in USA | MDEQ 2007 |
| TDS (mg/L) | 425 | |
| NH4-N (mg/L) | 1.9 (chronic) and 17 (acute) | US-EPA 2013 |
| Ca (mg/L) | 500 (livestock drinking water) | US-NRCS 2011 |
| *K (mg/L) | No surface water quality criteron has been developed for K in USA | |
| Mg (mg/L) | > 125 (livestock drinking water) | USDA-NRCS 2011 |
| Na (mg/L) | Waters with concentrations that do not exceed 270 mg/L are generally considered acceptable for consumption. | USDA-NRCS 2011 |
| TP (mg/L) | 0.04 for aggregate nutrient ecoregion XII | US-EPA 2000 |
| Cu (mg/L) | 0.005 (chronic) and 0.007 (acute) | MDEQ 2007 |
| Fe (mg/L) | 0.3 (secondary maximum concentration level) | US-EPA 2017 |
| Mn (mg/L) | Concentrations above 0.2 mg/L may make water distasteful to drink. The presence of concentrations above 0.05 mg/L may cause dark brown or black stains and deposits on textiles, cooking utensils and plumbing pipes. | US-NRCS 2011 |
| Zn (mg/L) | 0.065 | MDEQ 2007 |
No criteria are available for these parameters
Our data analysis further reveals that there were 31 out of 498 samples at Leland, 4 out of 62 samples at Merigold, and 4 out of 88 samples at Sunflower with DO below the MDEQ’s minimum criterion of 4.0 mg L−1 for the period from 1997 to 2017. Oxygen is a necessary element to all forms of life. As the DO level in water drops below 4.0 mg L−1, aquatic life may be stressed. Overall, the changes in DO concentrations among sites were not significant in most of the times.
3.2. Daily Variations
Daily changes in NO3 − N and TP concentrations from 1997 to 2017 at the three study sites are given in Fig. 2. More NO3 − N data were available at Leland than at the other two sites and small variations in NO3 − N concentration with a range of 4.29 mg L−1 and a median of 0.49 mg L−1 were observed at this site over the past 20 years (Fig. 2a). In contrast, much less daily NO3 − Ndata were available at Merigold and large variations in NO3 − N concentration were found with a range of 11.67 mg L−1 and a median of 2.07 mg L−1 for the period of 2009 and 2013 to 2017 (Fig. 2b). Similar to the case at Merigold, lesser daily NO3 − Ndata were available at Sunflower and larger variations in NO3 − N concentration were seen with a range of 19.37 mg L−1 and a median of 1.42 mg L−1 for the period of 1997, 2009 and 2013 to 2017 (Fig. 2c). Overall, the median concentrations of NO3 − N were in the following order: Merigold > Sunflower > Leland. As stated in the previous section, the Leland site is surrounded by residential areas which normally use less N fertilizer. As a result, there were small variations in NO3 − N concentrations at Leland than at Merigold and Sunflower as shown in Fig. 2.
Fig. 2.
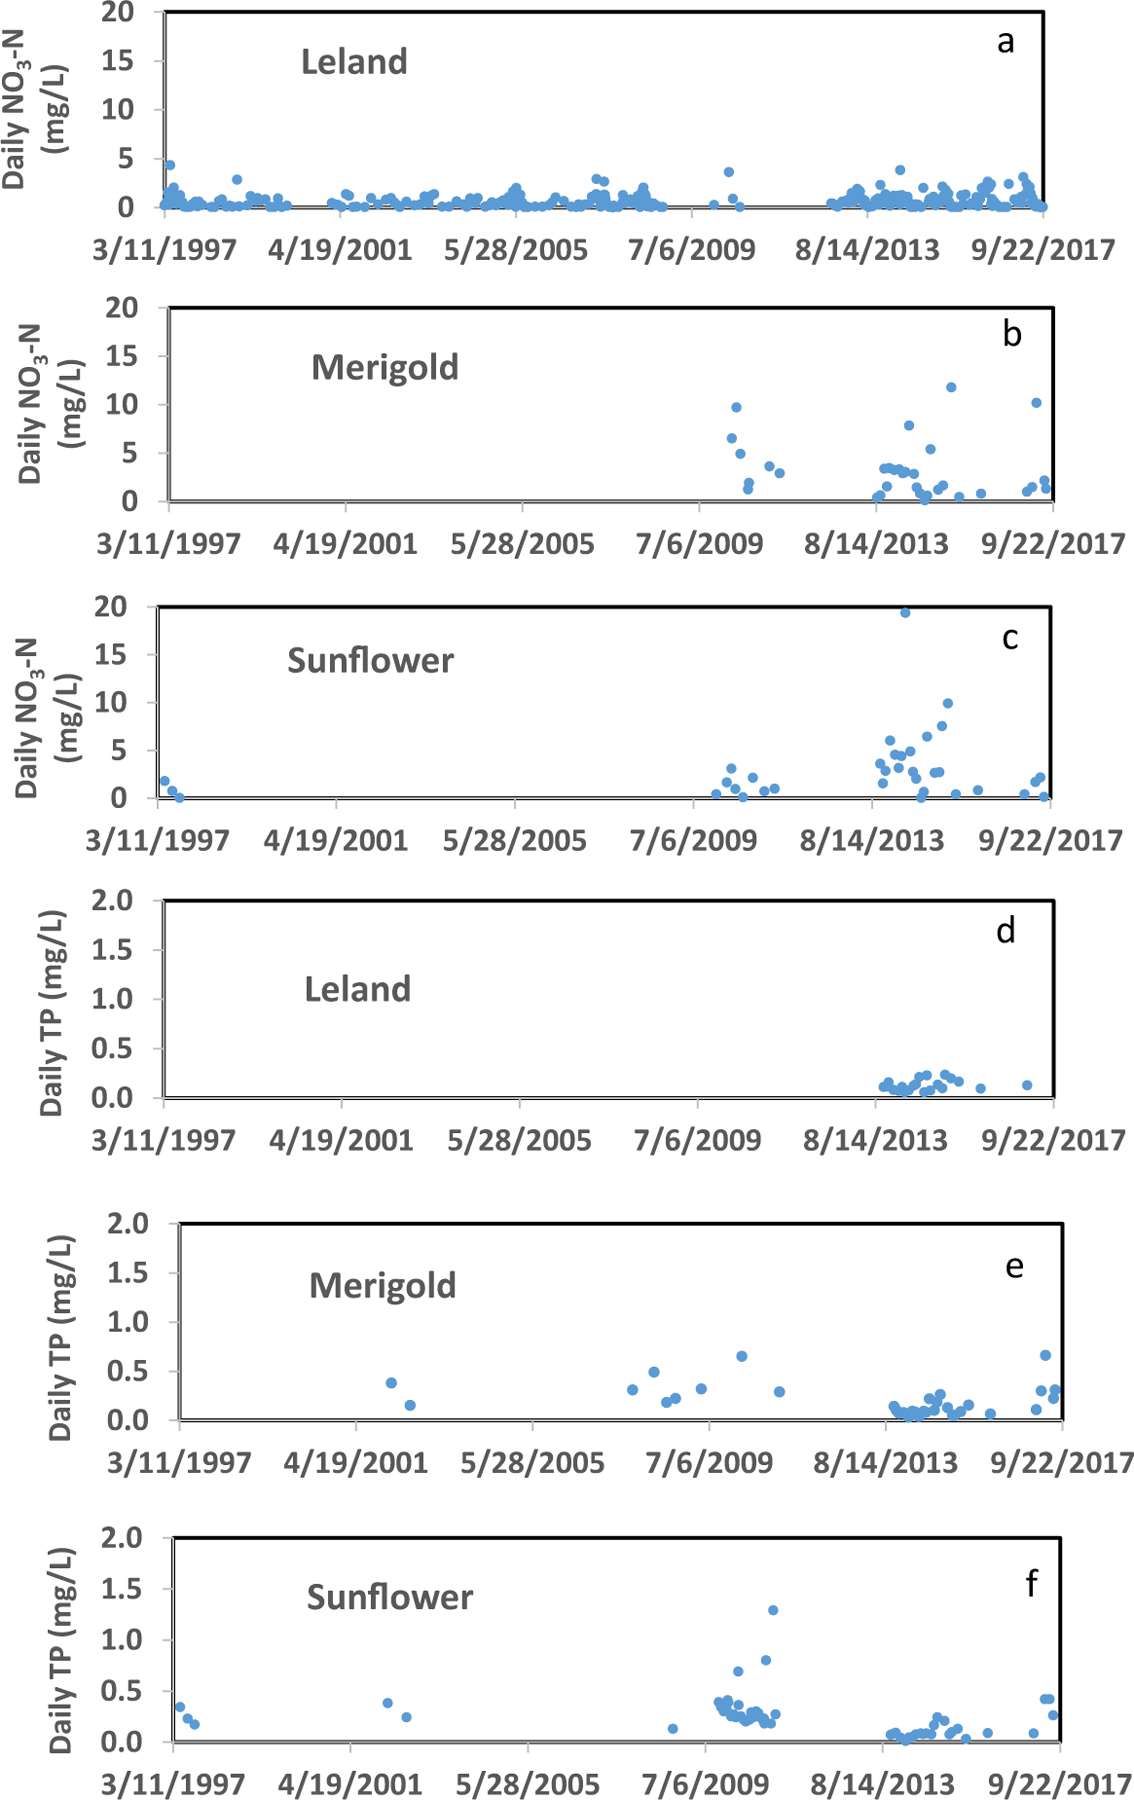
Daily concentrations of NO3 − N and TP at the Leland, Merigold, and Sunflower study sites in the BSRW
Analogous to the case for NO3 − N, the daily variations in TP concentrations were smaller at Leland (Fig. 2d) than at the other two sites (Fig. 2e and f). The range and median of TP were, respectively, 0.18 and 0.11 mg L−1 at Leland, 0.63 and 0.15 mg L−1 at Merigold, and 1.28 and 0.23 mg L−1 at Sunflower. The median TP concentrations were in the following order: Sunflower > Merigold > Leland, again supporting that less fertilizer was used at Leland.
Daily variations in TDS and DO concentrations from 1997 to 2017 at the three study sites are given in Fig. 3. There were more daily TDS (Fig. 3a) and DO (Fig. 3d) data available at Leland than at the other two sites. The median concentration of TDS was lower at Leland (80 mg L−1) than at Merigold (95 mg L−1) and Sunflower (157 mg L−1). This occurred because there were lesser agricultural activities and more residential areas at Leland than at Merigold and Sunflower. The more agricultural activities such as fertilizer application and groundwater usage would be, the more soluble salts were in water, which would increase the TDS content in the streams.
Fig. 3.
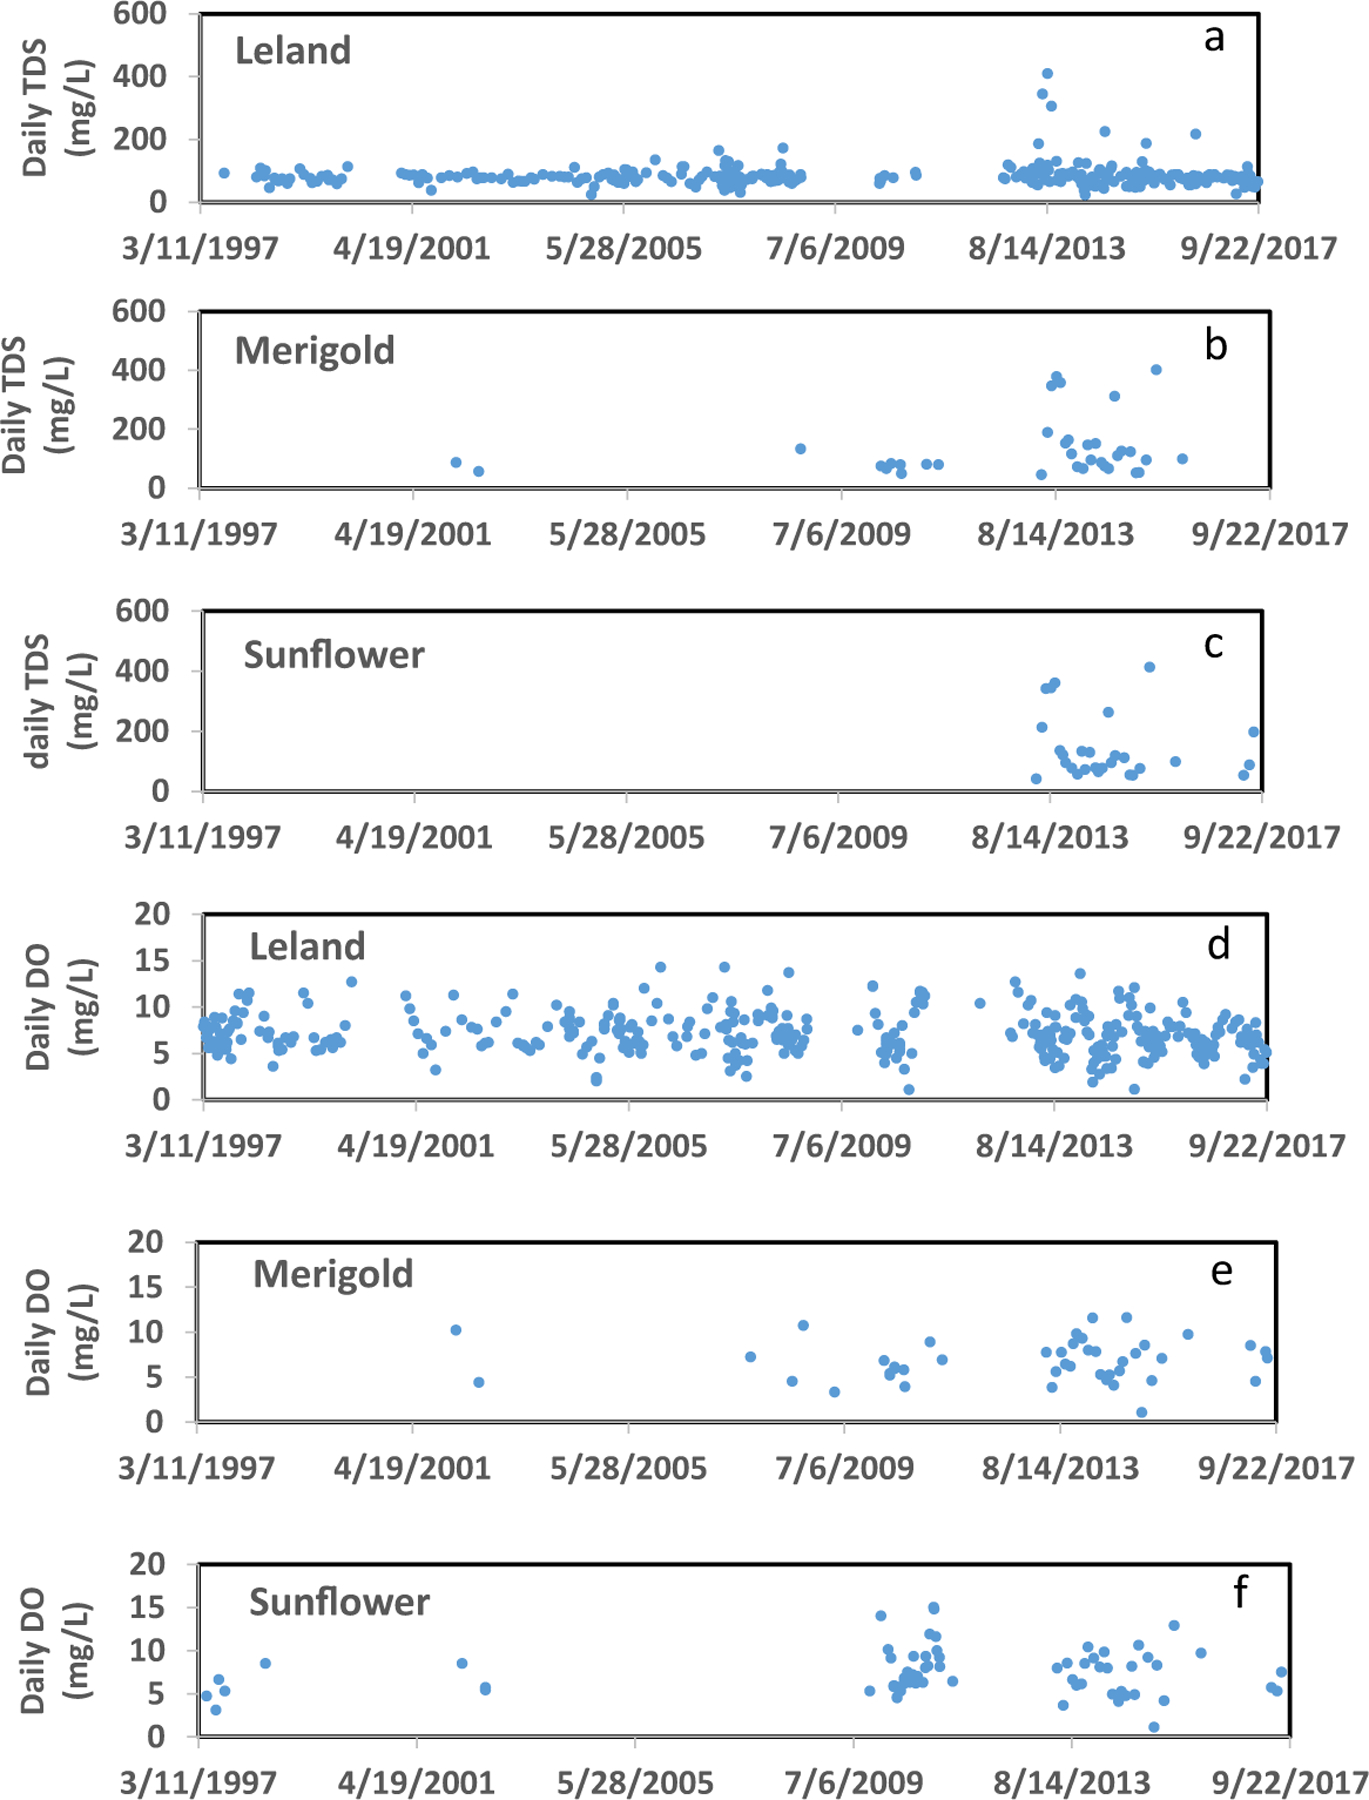
Daily concentrations of TDS and DO at the Leland, Merigold, and Sunflower study sites in the BSRW
In contrast, the median daily DO concentrations were very close, i.e., 6.7 mg L−1 at Leland, 6.19 mg L−1 at Merigold, and 6.5 mg L−1 at Sunflower and the variations in the daily DO concentrations were very similar (Fig. 3d–f). Results suggested that DO concentrations at the BSRW were more or less normal and unchanged over the past 20 years. It should be pointed out that large variations were observed for some nutrients such as NH4 − N, TN, and K, and some ions such as Mn and Mg at the three study sites (Table 1). However, there were insufficient measured data available to warrant a daily variation analysis.
3.3. Seasonal Variation
Seasonal changes in median concentrations of NO3 − N at the three study sites are shown in the left-hand-side of Fig. 4. In general, the highest median concentrations of NO3 − N were found in spring at all of the three study sites and were statistically significant among the seasons at α = 0.05 based on the nonparametric analyses, i.e., Kruskal-Wallis and Dunn tests. The highest concentrations of NO3 − Nin the streams at these sites during spring could be related to the application of N fertilizer for crop growth. A similar seasonal variation pattern was observed for TN at Leland and Sunflower (no TN data available in spring and fall at Merigold) as shown in the right-hand-side of Fig. 4. More specifically, the highest median concentrations of TN were found in spring at Leland and Sunflower and were statistically significant among the seasons at α = 0.05. This occurred because of the application of N fertilizer for crop growth during spring.
Fig. 4.
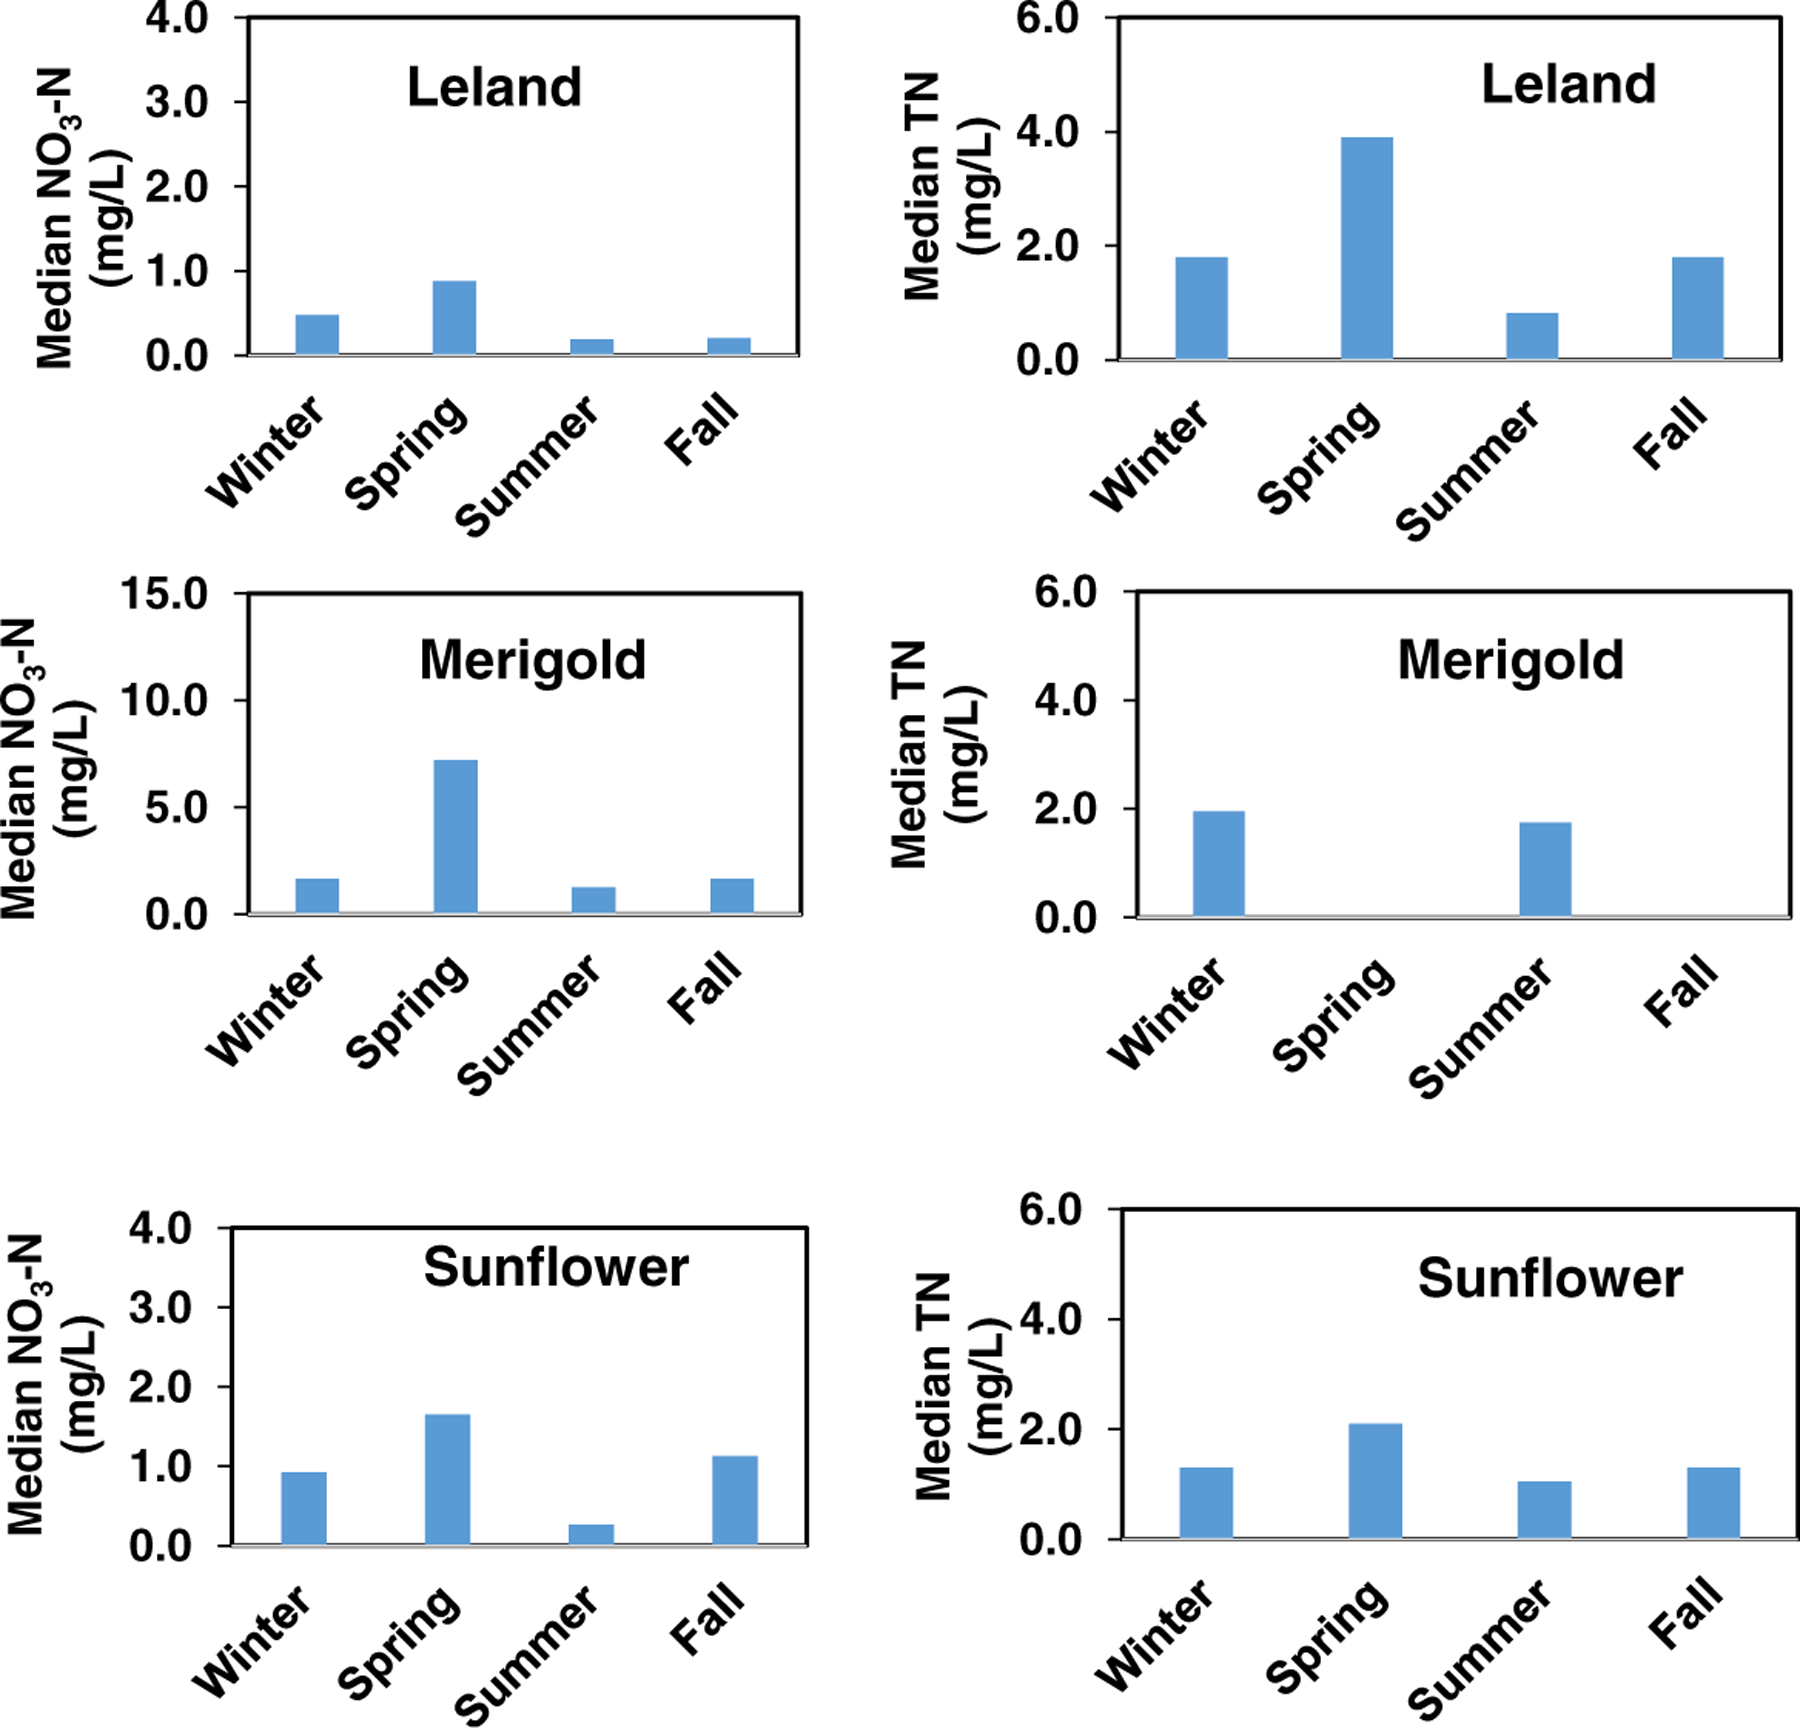
Seasonal variations of NO3–N and TN at the Leland, Marigold, and Sunflower study sites. The data used for the Kruskal-Wallis and Dunn tests are from 1997 to 2017
Seasonal changes in median concentrations of DO show the same pattern at the three study sites. That is, the median concentration of DO was the highest in winter, decreased in spring and summer, and increased in fall (see the left-hand-side of Fig. 5). The highest concentrations of DO were 9.1, 8.53, and 9.2 mg L−1, respectively, at Leland, Merigold, and Sunflower and they were statistically significant among the seasons at each site based on the nonparametric analysis. Seasonal variation of DO is governed by seasonal variation of stream temperature with more oxygen in cold water than in warm water under normal conditions. The metabolism rate, food supply, concomitant waste release, and oxygen demand of most aquatic organisms increase and oxygen solubility decreases in warm water, leading to the low DO.
Fig. 5.
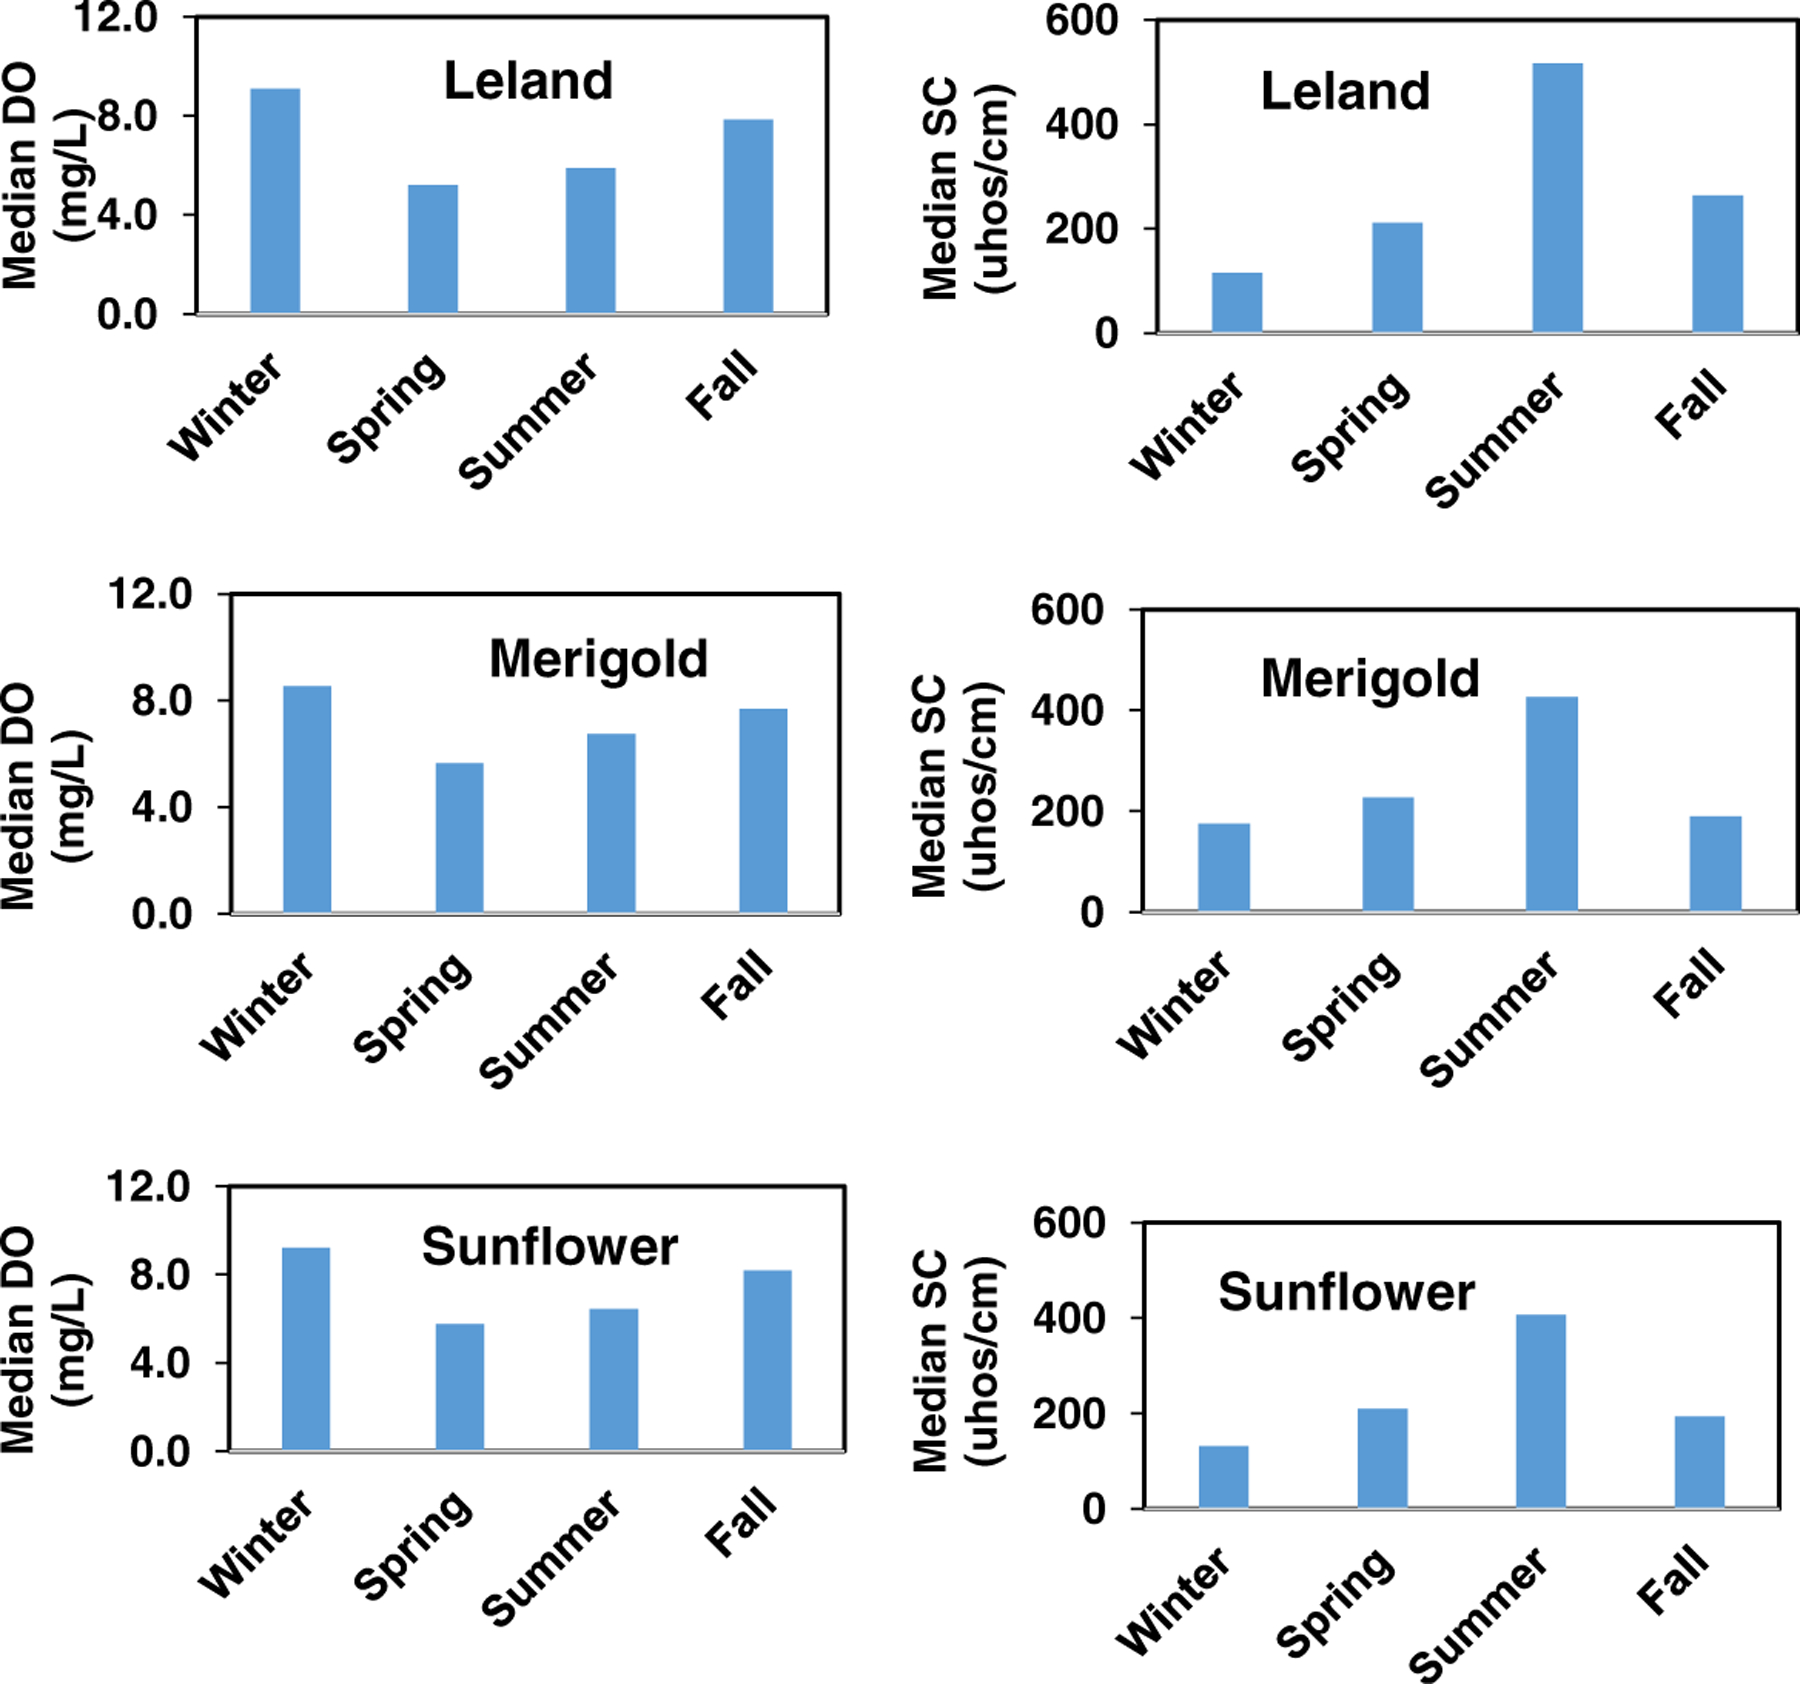
Seasonal variations of DO and SC at the Leland, Marigold, and Sunflower study sites. The data used for the Kruskal-Wallis and Dunn tests are from 1997 to 2017
Much higher values of SC were found in summer than in other seasons at all of the three study sites as shown in the right-hand-side of Fig. 5, and they were statistically significant. The median value of SC was 407 μhos cm−1 in summer but was 131 μhos cm−1 in winter at Sunflower. There was about 3.1 times higher in SC in summer than in winter at this site. The SC is a measure of the water’s ability to conduct electricity and thereby is a measure of the water’s ionic activity and content. As stream temperature rose, the concentrations of ionic constituents increased and so was the SC. Additionally, crop irrigation using groundwater during spring and early summer could be another factor. The groundwater in this region is rich with ionic constituents.
Seasonal variations in median concentrations of Cl and Na at the three study sites are demonstrated in Fig. 6. Analogous to the case of SC, the median concentrations of Cl and Na were significantly high in summer among seasons at all of the three study sites except for Na in summer at Merigold, where there were no differences among seasons. In general, the higher median concentrations of Cl and Na in summer could also be attributed to more soil erosion during this season. In addition, warmer temperature during summer also increases the solubility of salt in the water and thereby increases the concentrations of Cl and Na in the streams.
Fig. 6.
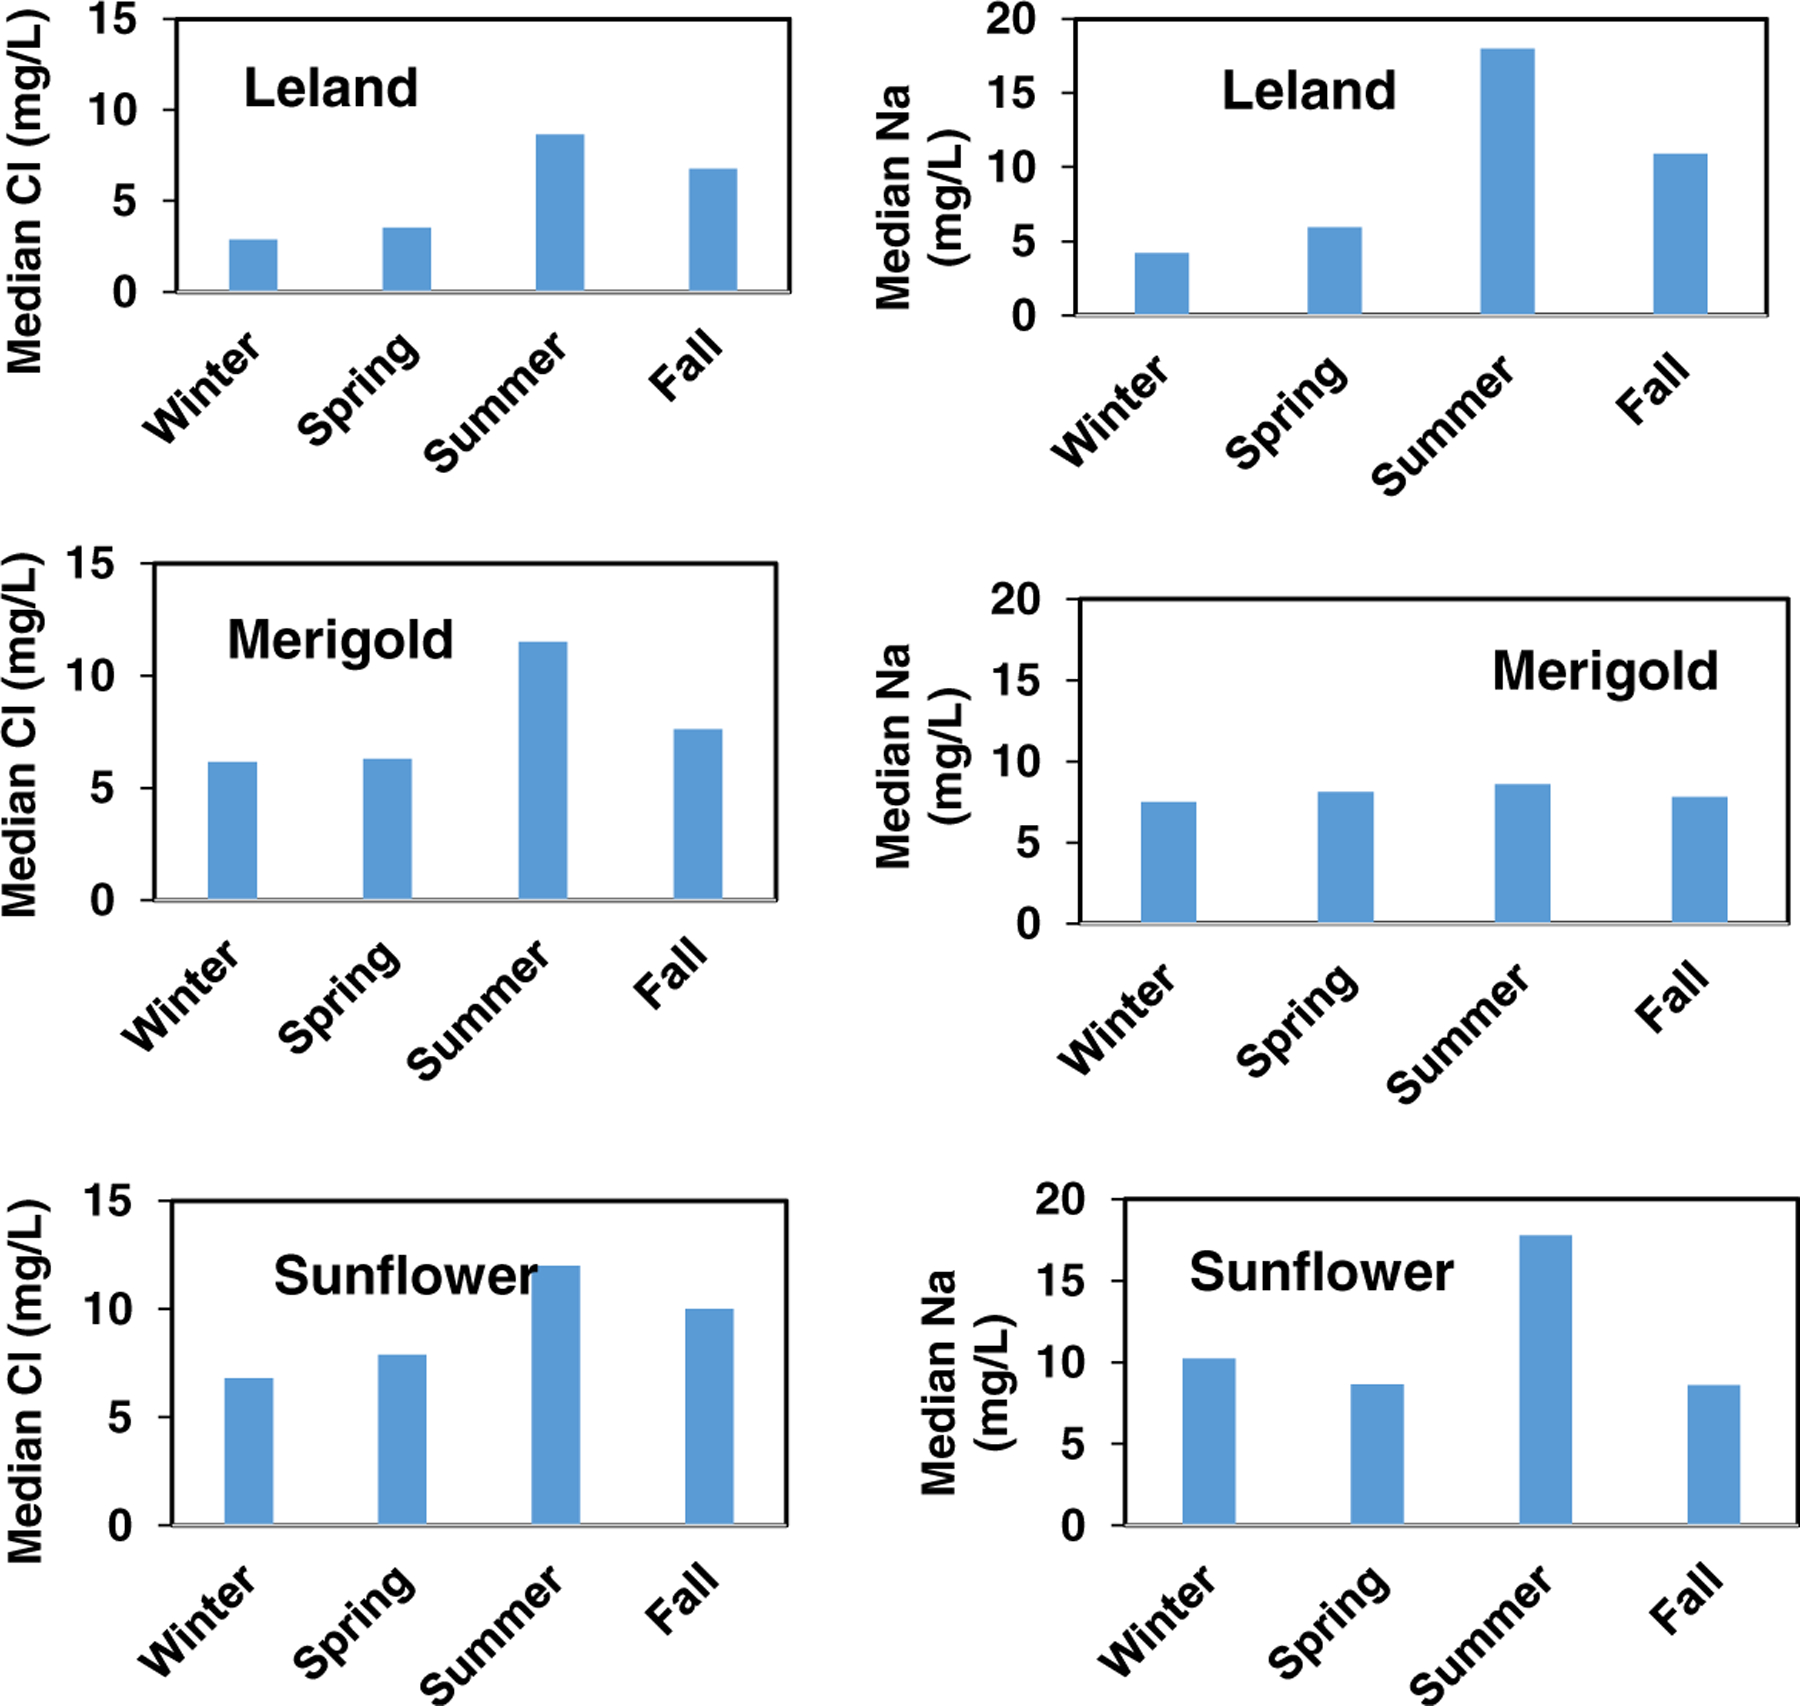
Seasonal variations of Cl and Na at the Leland, Marigold, and Sunflower study sites. The data used for the Kruskal-Wallis and Dunn tests are from 1997 to 2017
3.4. Annual Variations
Annual changes in median concentrations of NO3 − Nand TP from 1997 to 2017 or shorter for all of the three study sites are given in Fig. 7. In general, the median concentrations of these two nutrient species varied from year to year at each site. Mann-Kendall trend analysis revealed that there was a slightly annual increasing trend in the medianNO3 − N concentration at Leland (Fig. 7a) from 1997 to 2017 with τ-value = 0.113. The Kendall’s τstatistic is a measure of relationships between columns of ranked data. The τcorrelation coefficient returns a value of 0 to 1 (or − 1 to 0), where 0 is no relationship and 1 (or − 1) is a perfect relationship (Mangiafico 2016). The Pettitt’s test was also performed to identify a point at which the values in the data change and revealed that the NO3 − Ndata change occurred in February 2009 at the median value of 0.44 mg L−1. Although the annual median concentration of NO3 − N at Leland showed an increasing trend, the maximum difference between the highest median concentration and the lowest one was very small (only 0.45 mg L−1). In contrast, there was a decreasing trend in the medianNO3 − N concentration at Merigold (Fig. 7b) from 2010 to 2017 based on the Mann-Kendall analysis with τ-value = − 0.162 and that the NO3 − Ndata change occurred in June 2012 at the median value of 3.65 mg L−1 based on the Pettitt test. No trend was observed in the medianNO3 − N concentration at Sunflower (Fig. 7c). Results indicated that the trends of the annual medianNO3 − N concentrations were site-specific.
Fig. 7.
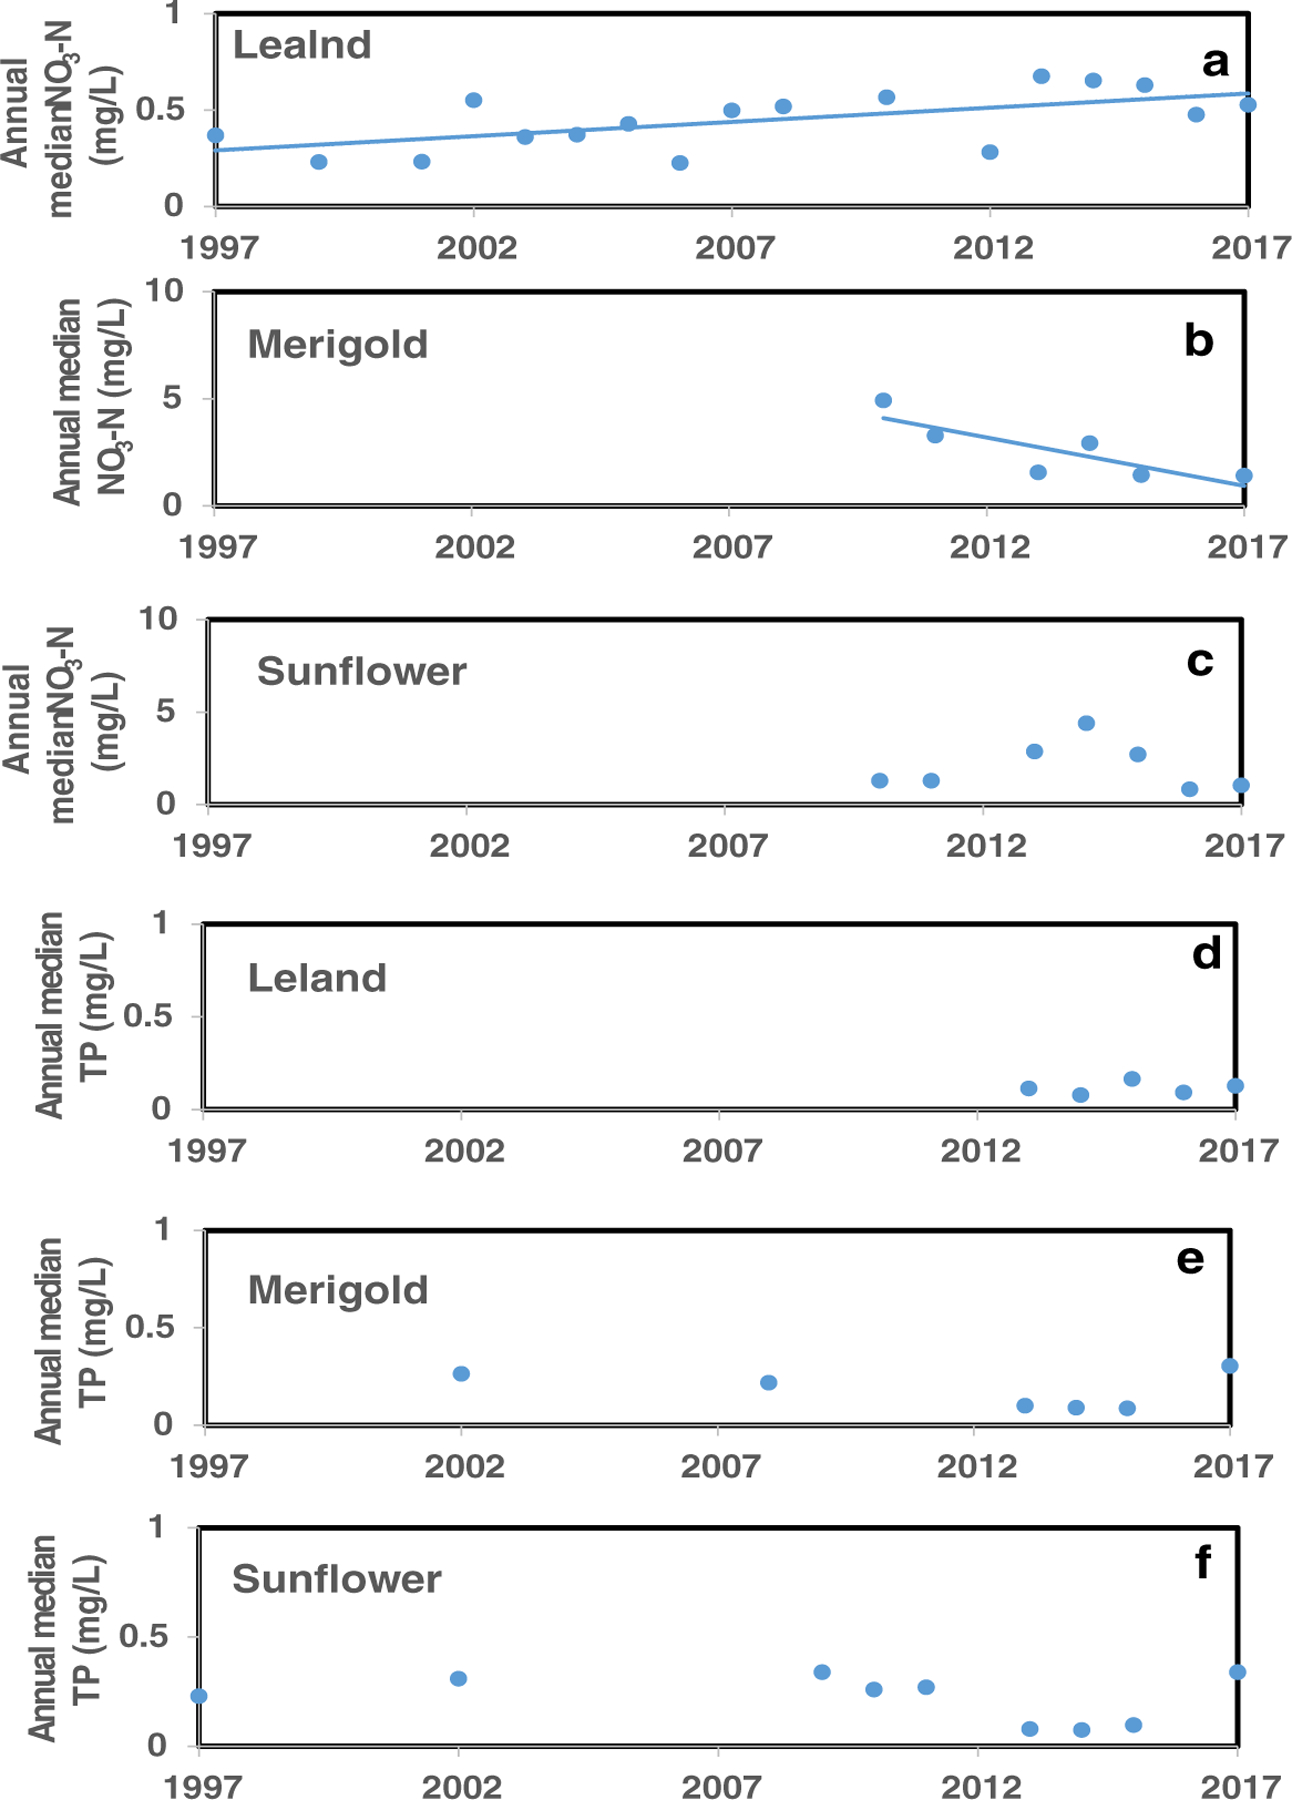
Annual variations of NO3–N and TP at the Leland, Marigold, and Sunflower study sites
No annual trends were identified for the annual median TP concentrations at all of the three study sites based on Mann-Kendall trend analysis. Plots of the TP concentrations at these sites further confirmed this finding (Fig. 7d–f). Results showed that the TP concentrations in the streams at the BSRW were invariant.
Very good correlations between TDS and Mg (or Ca) were observed at the three study sites (Fig. 8). The TDS is an important indicator of soil surface erosion and salt input. Unfortunately, this constituent is not always measured at many surface water monitoring stations, particularly in BSRW, due to a variety of reasons such as a short of funds in recent years and a lack of suitable measuring equipment such as wireless sensors in the old age. Therefore, if one could indirectly estimate TDS from other measured water quality constituents, it would provide a useful means for a better estimation of soil erosion and salt input in watersheds. In this study, we have identified that the concentrations of TDS had very good linear correlations to those of Mg and Ca, especially to Mg (Fig. 8). With very good values of R2 and low values of p (< 0.001), we concluded that TDS can be estimated from the concentrations of Mg and Ca at the BSRW. In general, TDS is the sum of the cation and anion ions in the water. However, our literature search showed that few studies have been made to establish the correlation between TDS and Mg (or Ca). This correlation created a new means to estimate the concentrations of TDS when the field measurements for Mg (or Ca) are available but not for TDS. In many surface water monitoring stations, especially in the BSRW, there are some water chemistry data including Mg and Ca that are measured in certain years with no TDS data.
Fig. 8.
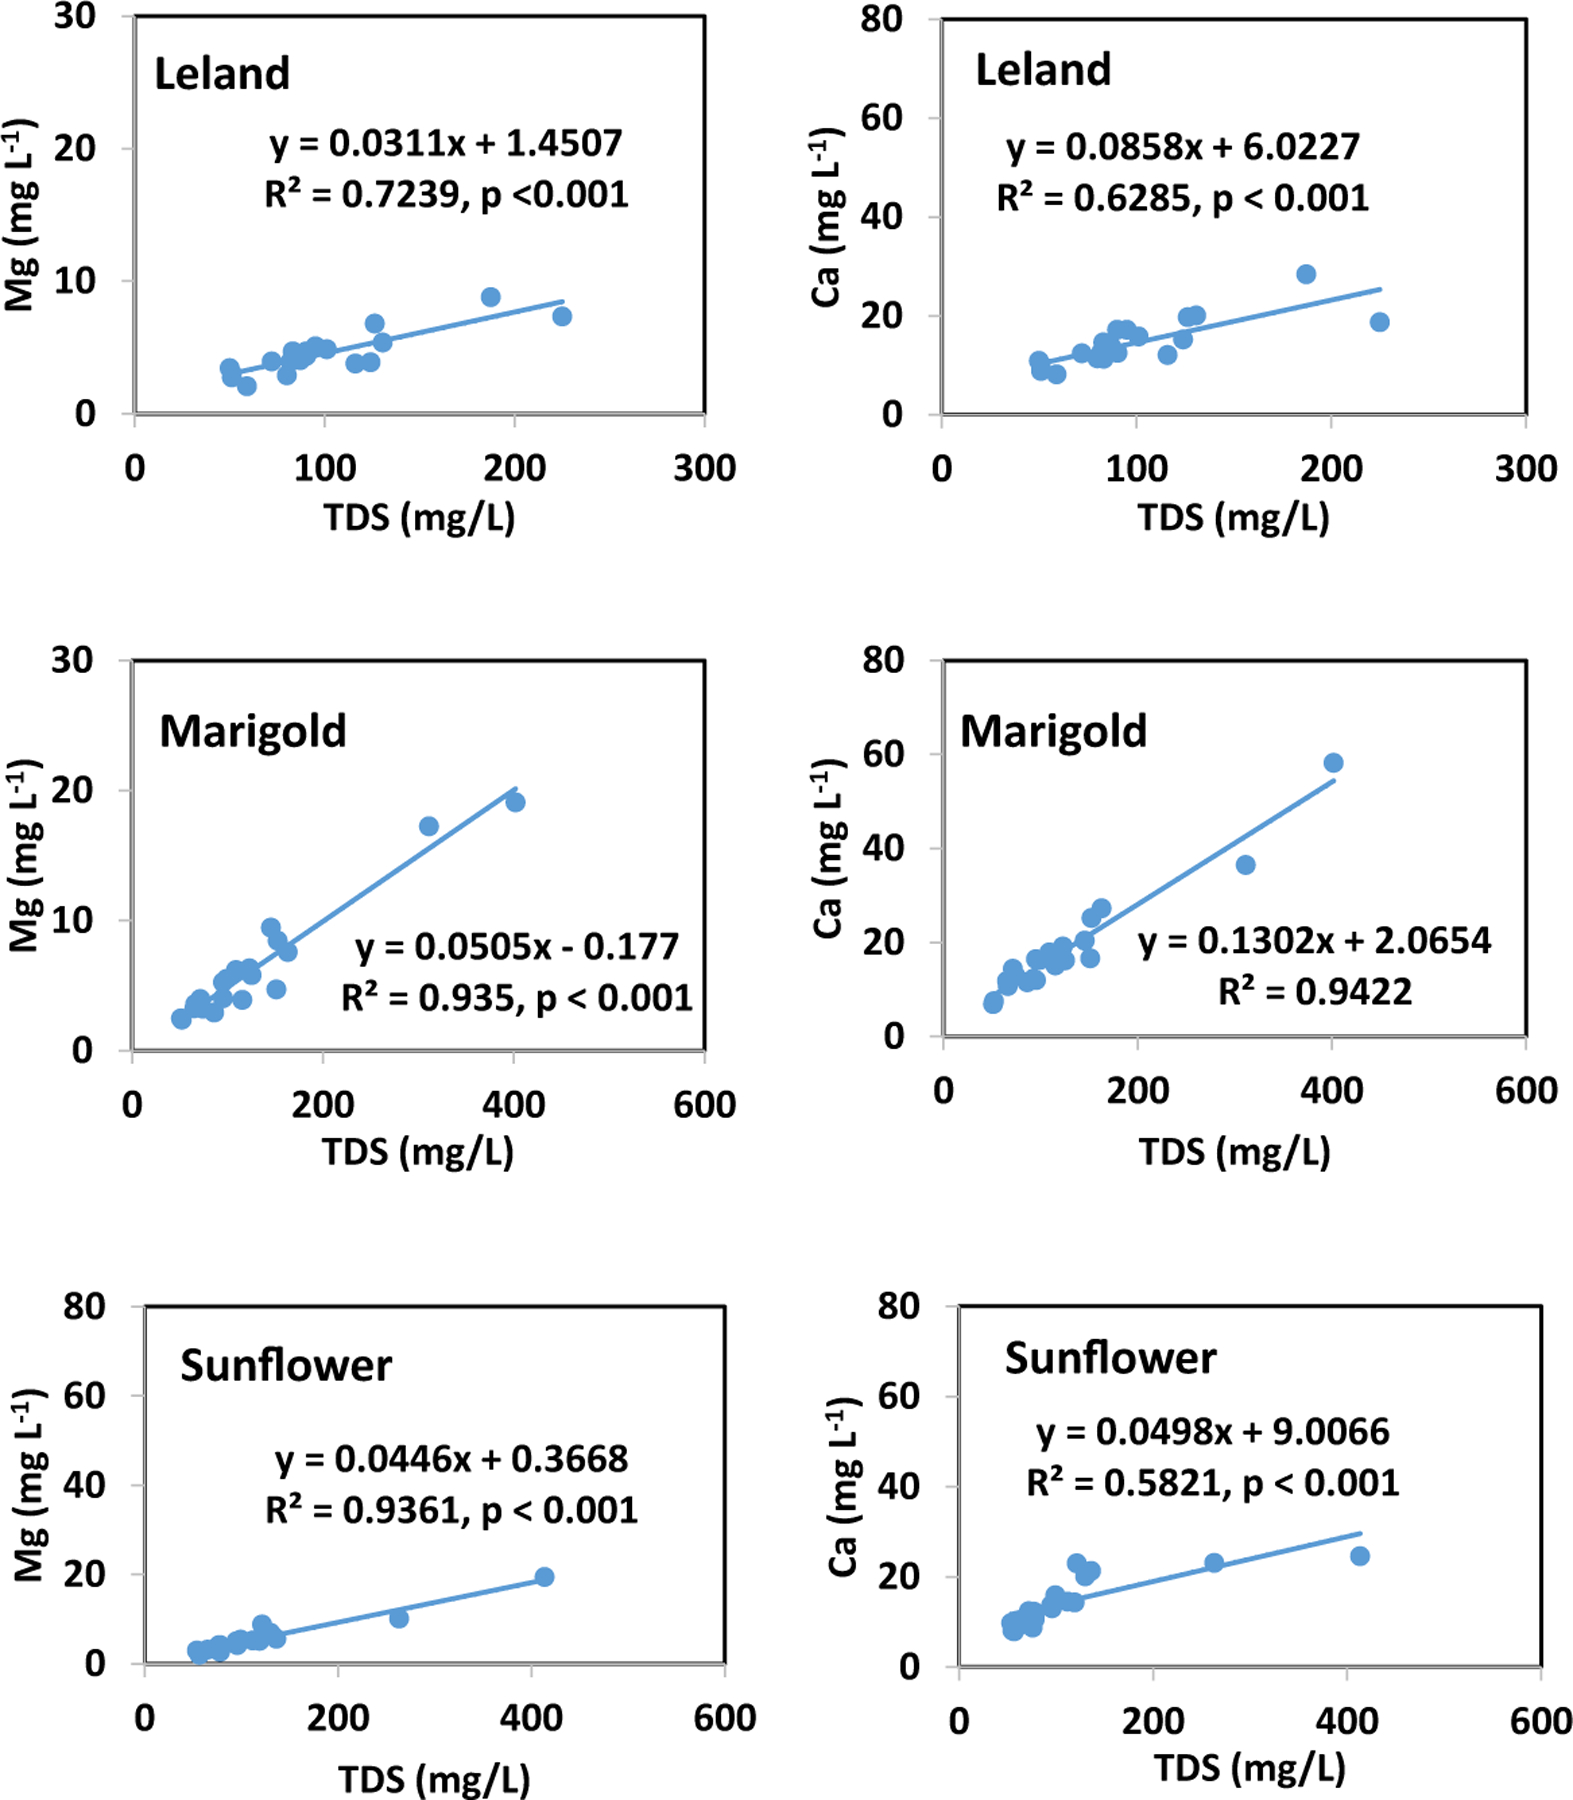
Relationships of TDS to Mg and Ca at the Leland, Marigold, and Sunflower study sites. The data were measured from 2013 to 2017
4. Conclusions
Understanding water quality conditions in Lower Mississippi River Basin (LMRB) continues to rely on water quality monitoring in smaller watersheds. Our assessment of surface water quality in the BSRW within the LMRB revealed complex spatial and temporal patterns at annual, seasonal, and daily scales. The concentrations of some nutrient species such as NO3 − N and TP varied with sites each year, whereas some physical variables such as pH and DO had very small variations. The highest median concentrations were observed in spring for NO3 − N and TN, in summer for Cl, Na, and SC, and in winter for DO at all of the three study sites. There was a slightly increasing annual trend for NO3 − N concentrations at Leland, a slightly decreasing annual trend for NO3 − N concentrations at Merigold, and no trend for NO3 − N concentrations at Sunflower. The overall water quality patterns emphasize the important roles that land use plays and the needs to reduce nutrient loading to alleviate eutrophication in the GOM.
Pettitt test is a useful tool to identify the points in times and values in which a water quality constituent has abrupt changes over years. This test has not been widely used for surface water quality analysis.
The concentration of TDS had a very good linear correlation to that of Mg and such that the concentrations of TDS can be estimated from the concentrations of Mg in the BSRW. This finding creates a new means to estimate the concentrations of TDS when the field measurements for Mg are available but not for TDS. In many surface water monitoring stations from the BSRW, there are some water chemistry data including Mg that are measured in certain years but without TDS. Further study is warranted for proving this correlation in different watersheds from other regions for general applications.
AUTHOR QUERIES.
AUTHOR PLEASE ANSWER ALL QUERIES.
Q1. Please check if the affiliations are presented correctly.
Q2. USA has been provided in affiliations 1 to 5, please check if it is correct.
Q3. The citation “Shields and Knight (2011)” has been changed to “Shields and Knight (2011)” to match the author name/date in the reference list. Please check if the change is fine in this occurrence and modify the subsequent occurrences, if necessary.
Q4. The statement “In the Pettitt test, the null hypothesis (H0)….” was modified for coherence. Two colons were used in the text which could lead to possible confusion. These were changed to commas instead. Please check if the intended meaning is retained.
Q5. The citation “US-EPA, 1994” has been changed to “US-EPA, 2017” to match the author name/date in the reference list. Please check if the change is fine in this occurrence and modify the subsequent occurrences, if necessary.
Q6. The citation “USDA-NRCS, 2011” has been changed to “US-NRCS, 2011” to match the author name/date in the reference list. Please check if the change is fine in this occurrence and modify the subsequent occurrences, if necessary.
Q7. “Acknowledgments” was changed to “Funding Information.” A statement was extracted from this section and was placed under “Disclaimer.” Please check if it is presented correctly.
Funding Information
The study was supported by USDA-NIFA-AFRI competitive grant program (Project Nos. 2013–67020-21407 and 2017–67020-26375).
Footnotes
Publisher's Disclaimer: Disclaimer The views expressed in this article are those of the authors and do not necessarily reflect the views or policies of the US Department of Agriculture and the US Environmental Protection Agency.
Contributor Information
Ying Ouyang, Center for Bottomland Hardwoods Research, USDA Forest Service, 775 Stone Blvd., Thompson Hall, Room 309, Mississippi State, MS 39762, USA.
Gary Feng, USDA-ARS, Crop Science Research Laboratory, 810 Hwy 12 East, Mississippi State, MS 39762, USA.
Prem Parajuli, Department of Agricultural and Biological Engineering, Mississippi State University, Mississippi State, MS 39762, USA.
Theodor Leininger, Center for Bottomland Hardwoods Research, USDA Forest Service, 432 Stoneville Road, Stoneville, MS 38776, USA.
Yongshan Wan, Gulf Ecology Division, National Health and Environmental Effects Research Laboratory, US EPA, 1 Sabine Island Drive, Gulf Breeze, FL 32561, USA.
Johnie N. Jenkins, USDA-ARS, Crop Science Research Laboratory, 810 Hwy 12 East, Mississippi State, MS 39762, USA
References
- Barlow JRB, and Coupe RH (2014). Occurrence and transport of nitrogen in the Big Sunflower River, northwestern Mississippi, October 2009-June 2011: U.S. Geological Survey Scientific Investigations; Report 2014–5107, 29 p., doi 10.3133/sir20145107. [DOI] [Google Scholar]
- Dodds WK, & Welch E (2000). Establishing nutrient criteria in streams. Journal of the North American Benthological Society, 19, 186–196. [Google Scholar]
- Graves GA, Wan Y, & Fike DL (2004). Water quality characteristics of stormwater from major land uses in South Florida. Journal of the American Water Resources Association, 40, 1405–1419. [Google Scholar]
- Jayakody P, Parajuli PB, Sassenrath G, & Ouyang Y (2013). Relationships between water table and model simulated ET. Ground Water, 52, 303–310. [DOI] [PubMed] [Google Scholar]
- Mangiafico SS (2016). Summary and Analysis of Extension Program Evaluation in R, version 1.11.1 New Brunswick: Rutgers Cooperative Extension. [Google Scholar]
- MDEQ (Mississippi Department of Environmental Quality). (2002). Fecal coliform TMDL for the Big Sunflower River Available at: http://www.deq.state.ms.us/mdeq.nsf/pdf/TWB_BigSunPathogenOct02/$File/YazooRBBigSunflowerPathogenOct03.pdf?OpenElement. Accessed on 9/14/2017.
- MDEQ (Mississippi Department of Environmental Quality). (2003). Proposed TMDL for organic enrichment, nutrients and sediment for the Big Sunflower River. June 2003. Mississippi Department of Environmental Quality, Office of Pollution Control, P. O. Box 10385, Jackson, Mississippi: 39289. [Google Scholar]
- MDEQ (Mississippi Department of Environmental Quality). (2007). State of Mississippi water quality criteria for intrastate, interstate, and coastal waters Mississippi Department of Environmental Quality, Office of Pollution Control, P. O. Box 10385, Jackson, Mississippi: 39289. [Google Scholar]
- MDEQ (Mississippi Department of Environmental Quality). (2010). Fecal Coliform TMDL for the Big Sunflower River and the Little Sunflower River, Coahoma and Sunflower Counties, Mississippi Mississippi Department of Environmental Quality, Office of Pollution Control Standards, Modeling, and TMDL Branch, P.O. Box 10385, Jackson, Mississippi: 39289. [Google Scholar]
- Ouyang Y (2005). Application of principal component and factor analysis to evaluate surface water quality monitoring network. Water Research, 39, 2621–2635. [DOI] [PubMed] [Google Scholar]
- Ouyang Y, Leininger TD, & Hatten J (2013). Real-time estimation of TP load in a Mississippi Delta stream using a dynamic data driven application system. Journal of Environmental Management, 122, 37–41. [DOI] [PubMed] [Google Scholar]
- Pennington KL (2004). Surface water quality in the delta of Mississippi. In Nett MT, Locke MA, & Pennington DA (Eds.), Water quality assessments in the Mississippi Delta: regional solutions, national scope, symposium series 877 (pp. 30–42). American Chemical Society, Washington DC. [Google Scholar]
- Pettitt AN (1979). A non-parametric approach to the change-point problem. Journal of the Royal Statistical Society: Series C, 28, 126–135. [Google Scholar]
- Rebich RA, Houston NA, Mize SV, Pearson DK, Ging PB, & Evan Hornig C (2011). Sources and delivery of nutrients to the northwestern Gulf of Mexico from streams in the south-central united States1. Journal of the American Water Resources Association, 47, 1061–1086. 10.1111/j.1752-1688.2011.00583.x. [DOI] [PMC free article] [PubMed] [Google Scholar]
- Shields FD Jr., & Knight SS (2011). Significance of riverine hypoxia for fish: the case of the Big Sunflower River, Mississippi. Journal of the American Water Resources Association, 48, 170–186. [Google Scholar]
- US-EPA. (2000). Ambient water quality criteria recommendations, information supporting the development of state and tribal nutrient criteria, rivers and streams in nutrient ecoregion XII United States Environmental Protection Agency, Office of Water, Office of Science and Technology, Health and Ecological Criteria Division, Washington, D.C. EPA 822-B-00–021, December 2000. [Google Scholar]
- US-EPA. (2013). Final aquatic life ambient water quality criteria for ammonia freshwater 2013. Federal Register, Vol. 78, No. 163,/ Thursday, August 22, 2013, Notices. [Google Scholar]
- US-EPA. (2017). National Secondary Drinking Water Regulations (NSDWRs) https://www.epa.gov/dwregdev/drinking-water-regulations-and-contaminants. Accessed on 9/14/2017.
- US-NRCS. (2011). Assessing water quality for human consumption, agriculture, and aquatic life uses United States Department of Agriculture, Natural Resources Conservation Service, environment technical note no. MT-1 (rev. 2), June 2011. [Google Scholar]


