Abstract
Chemical flooding technology has been widely applied in medium- and high-permeability reservoirs. However, it is rarely applied in low-permeability reservoirs, which is mainly limited by reservoir physical properties, chemical agents, injection capacity, and so forth. In this paper, a novel chemical formula used in low-permeability reservoirs was developed. In response to the low-permeability reservoir geological characteristics, fluid properties, and water flooding development of the target block, some experimental studies and field project studies of polymer–surfactant flooding were carried out. The surfactant structure and polymer molecular weight were determined from laboratory experiments. The polymer–surfactant binary system was synthesized. It had good injectivity in low-permeability reservoirs, and its oil recovery efficiency increased over 10% in the laboratory experiment. The result was higher than that of single chemical flooding. After field implementation, initial results have been achieved with an increase in injection pressure. The chemical formula can effectively alleviate intra-layer and inter-layer contradictions in the reservoir. The project has increased oil output by 77,700 t and the recovery factor by 3.5%. The experience and lessons were of great significance for the development of chemical flooding in high-temperature, high-salinity, and low-permeability reservoirs.
1. Introduction
Chemical flooding is a mature technology, which has been popularized and applied in medium- and high-permeability reservoirs.1,2 Field trials began in the United States in the early 1960s,3 followed by the United Kingdom, France, Norway, and Indonesia. Most of oilfields in China are continental sedimentary basins with strong reservoir heterogeneity. Oil recovery efficiency of water flooding in most oilfields is low. Aiming at the features of high-permeability reservoirs, chemical flooding projects were developed rapidly in China. In the 1990s, field tests were carried out in Shengli, Liaohe, Xinjiang, Dagang, Daqing, and Changqing oilfields in China. Also, the binary composite flooding in Liaohe and Xinjiang oilfields was expected to increase the oil recovery factor by 18%. It is one of the main research directions of enhanced oil recovery in old oil fields with high water cut, especially in high-permeability oilfields.
Laboratory studies and pilot tests have shown that high-concentration polymer flooding and polymer–surfactant–alkali (ASP) ternary combination flooding can achieve good displacement effects. The displacement efficiency is the fraction of movable oil that has been displaced from the swept zone. The sweep efficiency is the fraction of the zone section that is contacted with injected fluids.4 High-concentration polymer flooding adapts to the reservoirs with high permeability and highly heterogeneous reservoirs. ASP flooding is suitable for high-permeability and slightly heterogeneous reservoirs.5 However, the high-concentration polymer flooding is more economical than ASP flooding with the same oil production. The main problems of the former are the high injection pressure and the viscosity loss of polymer solution in the formation. The polymer mobility is decreased with an increase in the polymer concentration. More pressure is needed to inject the high-concentration polymer into the reservoir. During the polymer flooding process, some of the polymer is lost due to absorption, mechanical capture, and hydrodynamic retention, which causes the viscosity loss of the polymer solution. The problems for the latter are the oil–water emulsification and the scaling in reservoirs.5 Feng et al. affirmed the ineffective application of the combined ASP flooding due to the severe problems of emulsification and precipitation.6 However, the latest field pilot tests show that the anti-scaling and anti-emulsifying additives are added to the ASP system to reduce the scaling and emulsification, and this work achieves good displacement effects.
A polymer–surfactant system has low interfacial tension and avoids the scaling problems caused by the alkali. Compared with the ASP system, the binary system can reach the same oil displacement efficiency when the costs of the chemical agents in use are the same. This may be a new technology to replace the ASP system.5,6 In the work of Luo et al., polymer–surfactant flooding has been demonstrated to be an effective displacement mode for a heavy-oil reservoir in western Canada. When the alkaline solution was added, it could cause severe scaling near the wellbore region or in reservoirs. They deduced that it was difficult to form the oil–water emulsion with the binary system, owing to its high viscosity.7 Here, it is a specific research study. It has shown that the binary system can be used to improve the recovery of low-permeability reservoirs, because the interfacial tension and the injection pressure are lower than those in the high-concentration polymer flooding. However, they found that only the surfactant could not reach the ultralow interfacial tension between oil and water.21 Therefore, the most effective combination of chemical flooding mainly depends on the reservoir conditions, fluid properties, laboratory experiments, numerical simulations, and relevant field practical experience.
Chemical flooding has been proven to be able to largely enhance the oil recovery factor in most oilfields, especially in high-permeability reservoirs, but it is seldom used in low-permeability reservoirs (<50 mD). Low-permeability reservoirs are widely distributed and abundant in China, accounting for nearly half of China’s total proven oil and gas reserves.8 The effective utilization of this part of oil and gas resources is very important. Due to the characteristics of low permeability, poor porosity, low abundance, serious heterogeneity, and so forth, it is difficult to replenish formation energy. Thus, several issues arise, such as low natural production capacity of oil wells, low recovery of water flooding, and so forth. Therefore, it is urgent for us to change the development mode and explore a new method to improve oil recovery. Whether the chemical flooding system can be suitable for the low-permeability reservoirs and the oil displacement effects are good are the urgent problems to be solved.
In this paper, polymer–surfactant binary system formulations for this block, physical and chemical properties of the chemicals, polymer injection capability, numerical simulation, field trials, and so forth are studied in low-permeability reservoirs. This will provide valuable experience and lessons for chemical flooding applied in low-permeability reservoirs.
2. Results and Discussion
2.1. Geological Characteristics of Low-Permeability Reservoirs
The target block is located in east China. It was discovered in 1959 and has a STOIIP of 2.22 × 10⁶ t, with recoverable reserves of 5.55 × 10⁵ t and recovery factors of 25%. It belongs to a high-temperature (83 °C), medium-salinity (25000 mg/L), medium-pore (20%), and low-permeability (40 mD) reservoir with good fluid properties and a low oil–water viscosity ratio (5.0). It has a weak aquifer drive. The formed crude oils have medium API (52°), medium viscosity (2.14–2.70 mPa·s), medium freezing point (28–36 °C), and high wax content (17.99–35.14%); the block production started in 1994, supported by a weak edge-aquifer drive. Water injection started in 1996, which later had a comprehensive water cut of 80.6% and a recovery factor of 16%. Under the influence of the original geological conditions and the late hydraulic fracturing, the single layer of injected water displayed a breakthrough phenomenon resulting to increased water cut.
2.2. Screening of the Surfactant and Polymer
2.2.1. Screening of the Surfactant
In the enhanced oil recovery processes, the surfactants have two main functions: one is to reduce the interfacial tension between crude oil and reservoir brine so that crude oil becomes easy to be driven out, and the other is to alter the wettability of the reservoir rocks. This is also called the wetting reversal of the surfactant, which will peel off the oil film attached to the rock surface. Considering the negatively charged reservoir surface, we only studied the anionic and non-ionic surfactants without cationic surfactants.
2.2.1.1. Surfactant Structure and Its Reduction of Interfacial Tension between Oil and Water
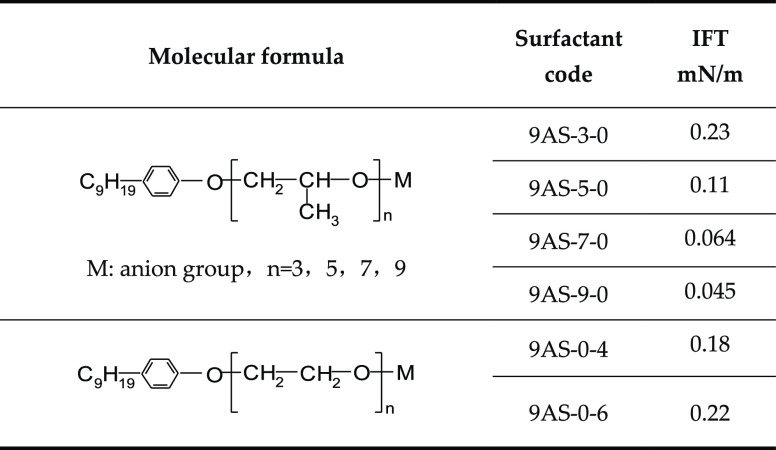
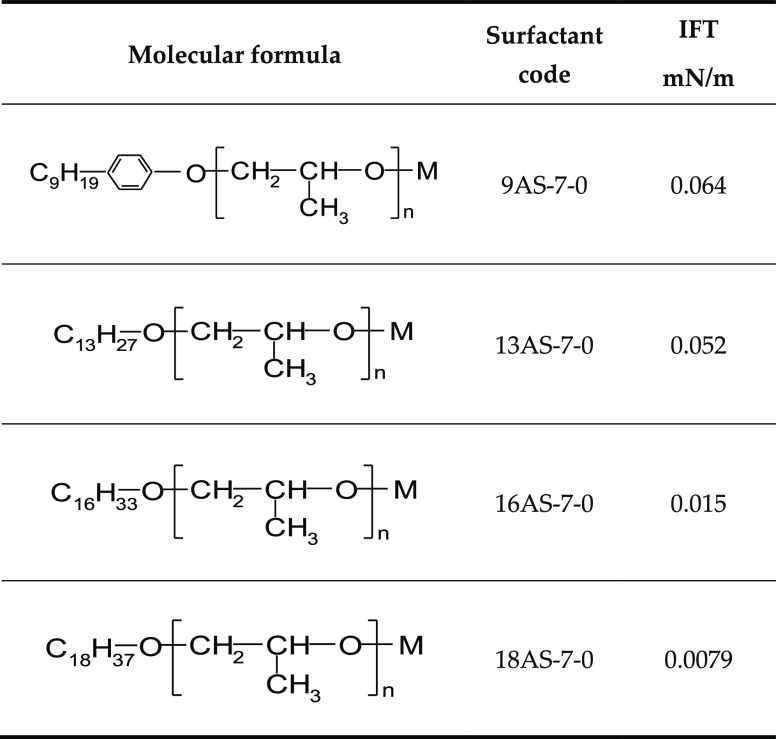
From the samples of the target block, we can see that the saturated hydrocarbon content of crude oil is 60%, and the aromatic hydrocarbon content is 15%. Therefore, we chose an aromatic hydrocarbon-based surfactant with aliphatic hydrocarbons to reduce the interfacial tension between oil and water (IFT). Six surfactants with the same hydrophobic tails (Table 1) and different hydrophilic head groups and four surfactants with the same hydrophilic head groups (Table 2) and different hydrophobic tails were selected to measure the interfacial tension between surfactants and crude oil. The IFT was measured using a rotating droplet IFT tester. In the laboratory, we chose the equilibrium IFT on the measured dynamic IFT curve to represent the IFT between crude oil and water.
Table 1. Minimum Oil–Water Interfacial Tension of Different Surfactant Structures.
Table 2. Minimum Oil–Water Interfacial Tension of Different Surfactant Structuresa.
M: anion group and n = 7.
With the growth of the propylene chain, the hydrophilicity of the surfactant gradually increases, the hydrophilic equilibrium value increases, the oil–water interfacial tension decreases, and the ability to move from the water phase to the oil–water interface increases.
The interfacial activity of 9AS-0-4 and 9AS-0-6 is obviously worse than that of the surfactant containing PO chains because oxyethylene is hydrophilic. With the increase in the number of ethylene oxide, the hydrophilicity of the surfactant increases. Therefore, the oil–water interface tension with the surfactant also increases.
With the increase in the carbon number in the alkyl chain, the surface activity of the surfactant becomes higher and the interfacial tension becomes lower.
2.2.1.2. Relationship between the Surfactant Structure and Crude Oil Stripped
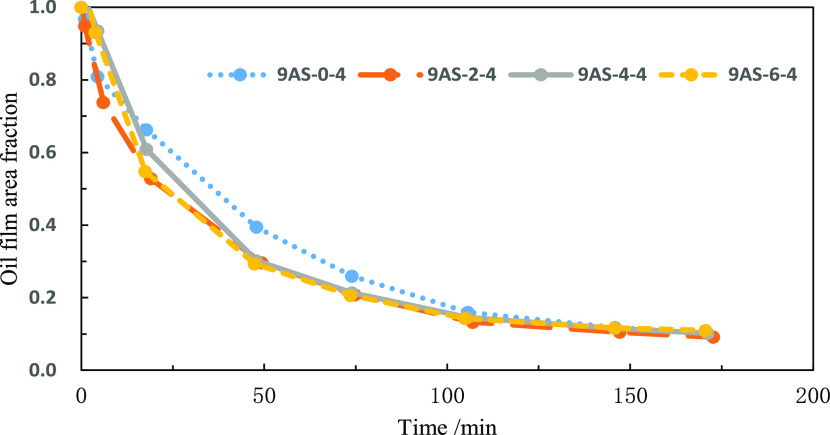
The effects of different surfactants, which have the same length of carbon chains and oxyethylene chains but different oxypropylene chain lengths, on the oil film shrinkage rate are compared. In the oil film shrinkage experiment, a small amount of crude oil is added to a cuvette. After aging for a period of time until the oil film is spread, a small amount of surfactant solution is added to observe the change in the oil film area. The oil film shrinkage rate is
| 1 |
In the formula, V—the oil film area shrinkage rate, S(t)—the change function of the oil film area with time, and t—time.
From Figure 1, we can see that with the same alkane carbon number and oxyethylene chain number, the surfactant containing oxypropylene chains can make the oil film contraction rate faster, but the oxypropylene chain number has less influence on the contraction rate. Through repeated experiments, it was found that the effect of surfactants with different numbers of oxypropylene chains is not different but better than those without oxypropylene chains.
Figure 1.
Effect of the oxypropylene chain on the oil film shrinkage rate.
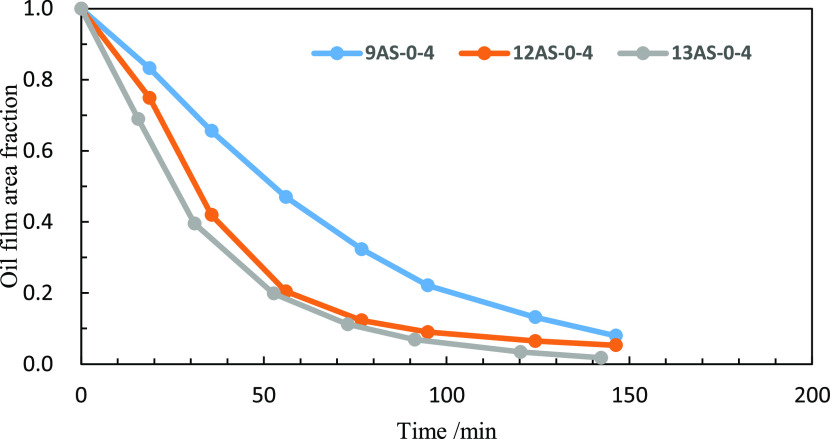
The effect of the alkyl carbon number in the surfactant on the oil film shrinkage rate is compared. The shrinkage rate of oil film in three different surfactant solutions (0.1% wt) at 30 °C is studied.
It can be seen from Figure 2 that the surfactant with a high alkyl carbon chain number is more conducive to the contraction of oil films. According to the above analysis, we believe that the surfactant which can significantly reduce the interfacial tension between oil and water should have the following structure
 |
2 |
Figure 2.
Effect of the carbon number of alkyl chains on the oil film shrinkage rate.
2.2.2. Screening of the Polymer
In order to enhance oil recovery, we should maximize the swept volume of surfactant solution after reducing the interfacial tension to the order of 10–3 mN/m with the surfactant. Polymer solution can reduce the fluidity of aqueous solution by increasing the viscosity of the aqueous phase and prevent aqueous solution from the viscous fingering phenomenon. It can effectively decrease the reservoir heterogeneity, expand the swept volume of subsequent water flooding, and then improve the oil recovery factor of the whole reservoir. At present, polymer flooding has been widely applied in medium- and high-permeability reservoirs and has achieved good results. Considering the characteristics of low-permeability reservoirs with low porosity and low permeability, the molecular weight and concentration of polymers must be reduced to adapt to the reservoir type, so the selection of polymer is the key.
It is found in this paper that the ratio of core pore radius (r) to the hydrodynamic radius (R) of polymer coils can be used as a characteristic parameter and criterion to investigate the compatibility of the polymer and core. From Figure 3 showing the schematic diagram of polymer hydration molecules blocking the pore throat of porous media, the polymer hydrated molecular coil blocks the pore throat by “bridging” when the radius ratio is less than 2.2. When the ratio of the two is greater than 2.2, the polymer can also accumulate at the pore throat and then block the pore throat. However, the blocking can be removed under a certain flow impulse. A large number of experimental studies have shown that the ratio greater than 5 is reasonable.9 Therefore, the paper studies the compatibility between the hydrodynamic radius of the polymer and the core to determine the appropriate molecular weight of the polymer.10−21
Figure 3.

Schematic diagram of plugging the pore throat of porous media with polymer hydrated molecules: (a) r/R < 1, (b) 1 < r/R < 2.2, (c) r/R = 2.2, and (d) r/R > 2.2.
Four cores are selected to measure their permeability and parameters, and the results are shown in Table 3. Eight kinds of polyacrylamide samples with different molecular weights are selected and numbered as 1#-8#. The hydrodynamic radius of the polymer in the corresponding aqueous solution is measured using a dynamic light scattering instrument. The measured temperature was 83 °C, the salinity of water was 15000 mg/L, and the polymer concentration was 1200 mg/L. The results are shown in Table 4. The higher the molecular weight, the larger the molecular dynamics dimension of the polymer in solution.
Table 3. Core Pore Throat Data.
| core number | permeability/K mD | porosity/Φ | equivalent pore radius/req μm | pore throat radius/rh μm |
|---|---|---|---|---|
| 8–10 | 52 | 0.206 | 1.496 | 0.962 |
| 8–12 | 48 | 0.185 | 1.474 | 0.863 |
| 7–3 | 36 | 0.195 | 1.290 | 0.785 |
| 8–3 | 19 | 0.184 | 1.180 | 0.617 |
Table 4. Hydrodynamic Radius of Polymer Molecules in Polymer Solutions.
| polymer sample | 1# | 3# | 4# | 5# | 6# | 7# | 8# |
| R μm | 0.106 | 0.126 | 0.437 | 0.209 | 0.147 | 0.225 | 0.141 |
The compatibility between the polymer hydrodynamic dimensions and the core pore throat was analyzed, and the results are shown in Table 5. The polymer molecular hydrodynamic sizes of 1#, 3#, 6#, and 8# polymer samples had a good compatibility with the core pore throat. Therefore, samples 1#, 3#, 6#, and 8# are selected for evaluation and analysis of injection performance.
Table 5. Compatibility of Polymer Hydrodynamic Size with the Core Pore Throat.
| core
number and pore-throat size/rμm |
||||||
|---|---|---|---|---|---|---|
| 8–10 | 8–12 | 7–3 | 8–3 | |||
| r/R | 0.962 | 0.863 | 0.785 | 0.617 | ||
| hydrodynamic dimensions of polymer molecules/Rμm | 1# | 0.106 | 9.08 | 8.14 | 7.41 | 5.82 |
| 3# | 0.126 | 7.63 | 6.85 | 6.23 | 4.90 | |
| 4# | 0.437 | 2.20 | 1.8 | 1.80 | 1.41 | |
| 5# | 0.209 | 4.60 | 4.13 | 3.75 | 2.95 | |
| 6# | 0.147 | 6.54 | 5.87 | 5.34 | 4.20 | |
| 7# | 0.225 | 4.28 | 3.84 | 3.49 | 2.74 | |
| 8# | 0.141 | 6.82 | 6.12 | 5.58 | 4.38 | |
According to the conditions of high temperature, medium salinity, and low permeability in the target block, five types of common partially hydrolyzed polyacrylamides with molecular weight less than 20 million are used (Table 6). The properties of the polymer are measured, and the shear rate at which the viscosity was measured is 7 s–1. The five polymers satisfy the requirements of the oilfield upon testing their basic properties.
Table 6. Polymer Performance Parameter Table.
| polymer | molecular weight 104 | solid content % | degree of hydrolysis % | dissolution rate min | insoluble % | filter factor | viscositymPa·s |
|---|---|---|---|---|---|---|---|
| 8# | 1800 | 89.7 | 20.7 | <120 | 0.076 | 1.07 | 11.59 |
| 6# | 1400 | 89.5 | 22.5 | <120 | 0.065 | 1.01 | 7.27 |
| 3# | 900 | 88.7 | 23.0 | <120 | 0.038 | 1.04 | 2.76 |
| 1# | 600 | 89.1 | 22.4 | <120 | 0.045 | 1.03 | 2.61 |
| 9# | 400 | 89.5 | 23.1 | <120 | 0.043 | 1.01 | 1.47 |
In the polymer injection experiment, the adopted oil is a mixture of the dehydrated crude oil and kerosene. The viscosity of this oil is 2.0 mPa·s. The salinity of the water is 15000 mg/L, which is the same as the formation water, and the experimental temperature is 83 °C. The core sample (diameter: 2.54 cm, length: 10 cm, and permeability: 43 mD) is fully saturated with the oil first. Then, water is injected at 0.2 mL/min until the pressure is stabilized. After water injection, the polymer is injected until the pressure is stable. The pressure differences for these processes are recorded. The resistance coefficient (RF) and residual resistance coefficient (RRF) are calculated as follows:
| 3 |
In the Formulas 3 and 4, λw is the mobility of water, λp is the mobility of polymer solution, Kw is the relative permeability of water, Kp is the relative permeability of polymer solution, μw is the viscosity of water, and μp is the viscosity of polymer flooding. According to Darcy’s law, Formula 3 can be changed as follows
| 4 |
In the formula, ΔPwi is the differential pressure of water flooding and ΔPp is the differential pressure of polymer flooding.
| 5 |
In the formula, λwi is the mobility before polymer flooding, λwa is the mobility after polymer solution, ΔPwa is the differential pressure after polymer flooding, Kwb is the water relative permeability before polymer flooding, and Kwa is the water relative permeability after polymer flooding.
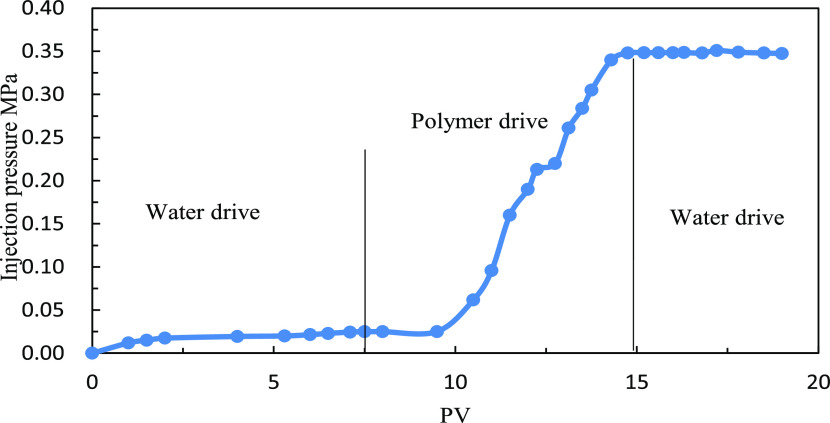
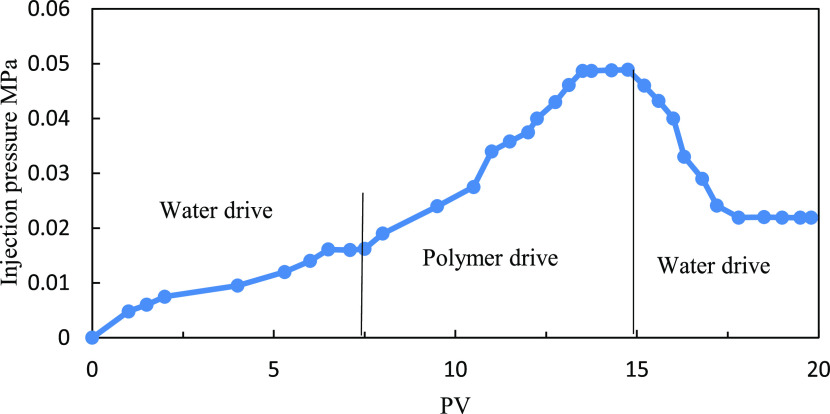
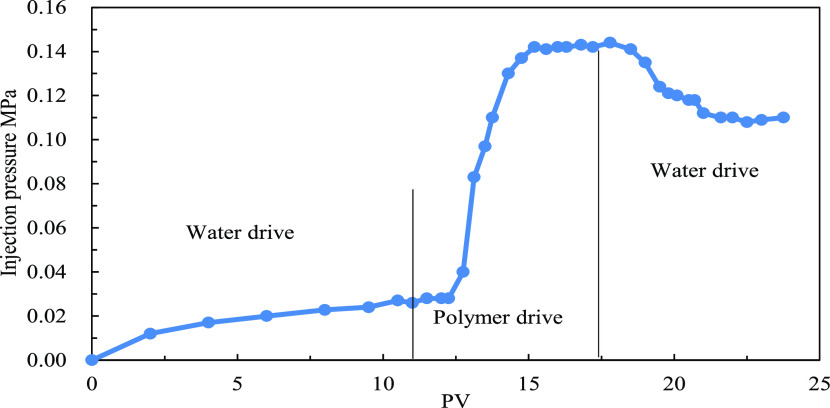
The injection pressure of water flooding is about 0.025 MPa. After the injection of 1000 mg/L polymer solution with a molecular weight of 14 million, the injection pressure reaches 0.35 MPa. The calculated RF is 14. For subsequent water flooding after the polymer flooding, the injection pressure remains 0.35 MPa and the RRF is similar to the initial resistance factor, indicating that the polymer solution forms a blockage in the core sample, as shown in Figure 4. On injection of 1000 mg/L polymer solution with a molecular weight of 6 million and the subsequent water flooding, the pressure decreases significantly and is close to the pressure when the water is injected, as shown in Figure 5. We believe that under such conditions, the polymer molecular weight is not suitable for the core permeability and the polymer molecular weight is too small to make contribution to the seepage resistance. For a polymer with a molecular weight of 9 million (between molecular weight of 6 million and 14 million), the injection pressure curve is shown in Figure 6. Considering the viscosity and injectivity capacity of the polymer, a polymer molecular weight of 9 million is more suitable under low-permeability conditions.
Figure 4.
Injection pressure curve (polymer molecular weight:14 million and core peambility:43.14 mD).
Figure 5.
Injection pressure curve (polymer molecular weight: 6 million and core peambility:46 mD).
Figure 6.
Injection pressure curve (polymer molecular weight: 9 million and core peambility:48.11 mD).
2.3. Displacement Mechanism of the Polymer–Surfactant Flooding
2.3.1. Experimental Introduction
The micromodel experiment system includes four parts: a microscopic observation system, a pressure system, an image acquisition system, and a vacuum system.
The size of the sandstone model sample used in the experiment is generally 2.8 × 2.5 cm2, the thickness is about 0.6 mm, the bearing capacity is 0.2–0.3 MPa, and the temperature resistance is about 80 °C.
2.3.2. Microdisplacement Mechanism of the Surfactant
20 PV water is injected according to the above experimental method, and about 40–50% of the remaining oil is kept in the model. In the range of injected water sweep, the oil is mainly bound in the pore network in the form of films, columns, clusters, and islands and some of it is distributed at the blind end or quasi-blind end. The displacement types include uniform displacement, network displacement, and finger displacement, as shown in the Figure 7.
Figure 7.
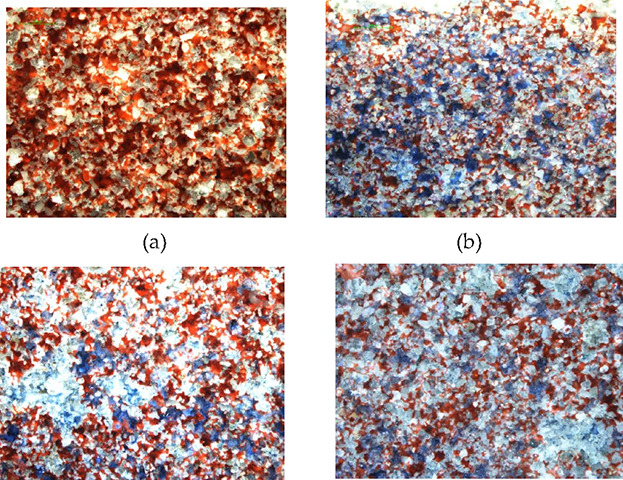
Different displacement types: (a) initial oil distribution, (b) uniform displacement, (c) finger displacement, and (d) network displacement.
The oil is driven by injecting surfactant JW-1 solution at a constant rate (1 mL/h) to observe the remaining oil distribution state after surfactant drive. Also, full-field and local images are canned and photographed for each model. Figures 8 and 9 show the pictures of cores after water drive and surfactant drive. From Figure 8, the water sweep gradually expands along the plane in model water drive, which is uniform repulsion, while when surfactant goes into the core, the displacement speed is faster along some channels. An obvious fingering phenomenon occurs, forming the mainstream area, and the oil displacement effect is remarkable. Compared to the remaining-oil state before and after surfactant flooding at the entrance in Figure 9, surfactant starts driving a large amount of filmed residual oil and isolated residual oil and some cluster residual oil. The cluster residual oil needs larger start-up pressure, so there is more cluster residual oil left.
Figure 8.
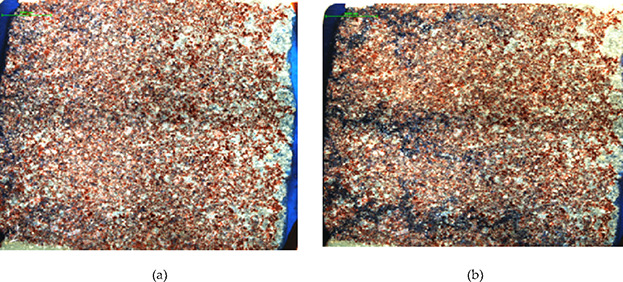
Whole view of core water flooding and surfactant flooding: (a) water flooding and (b) surfactant flooding.
Figure 9.
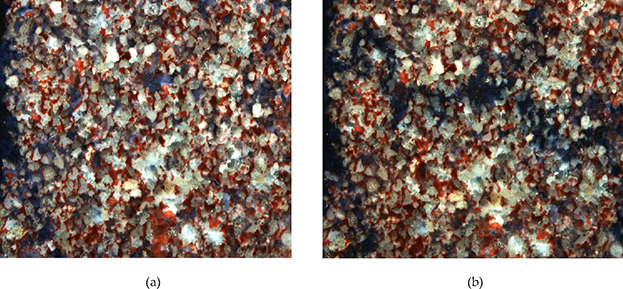
Remaining oil distribution of water flooding and surfactant flooding at the entrance: (a) water flooding and (b) surfactant flooding.
2.3.2.1. Displacement of Oil Films by the Surfactant
As can be seen in Figure 10, the crude oil attached to some large pore walls is not easily driven away during water flooding, forming the oil film.
Figure 10.
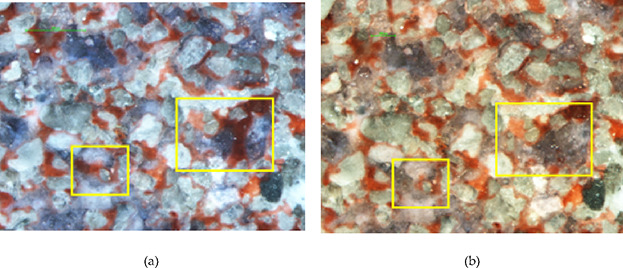
Oil fim: (a) water flooding and (b) surfactant flooding.
The microscopic displacement process shows that the adhesion force is the resistance that must be overcome to repel the filmed and blind residual oil. After injecting the surfactant, the change in interfacial tension and the contact angle is beneficial to the decrease in adhesion work and oil cohesion, which is beneficial to the displacement of the filmed residual oil. When the surfactant (JW-1) is injected, the equilibrium conditions at the three-phase contact point are destroyed and the oil film is softened, elongated, and broken into small oil droplets which break away from the wall. The process continues to repeat until the oil film is repelled clean. Due to the combined effect of absorption of the surfactant and ultralow interfacial tension, the wetting hysteresis occurs at the three-phase contact point. The leading edge of the oil film is deformed, and the cohesive force to prevent interfacial deformation is reduced. It makes the oil at the leading edge of the oil film gradually gather and deform, elongate, and finally break off into small oil droplets. The remaining oil is recycled into oil films under the action of cohesive force, and the leading edge of oil film continues to deform, elongate, and break off, and the process is repeated until the oil film is replaced.
2.3.2.2. Displacement of Cluster Remaining Oil by the Surfactant
Microscopic model oil displacement experiments show that cluster remaining oil occupies a considerable proportion of the remaining oil after water flooding in low-permeability cores. The cluster remaining oil is due to the microscopic heterogeneity of the core. When water drives oil, the injected water is preferred to enter the well-connected macropores with small flow resistance. After water breaks through, it becomes a continuous water phase and the remaining oil is left in the small pores with large flow resistance. The fundamental starting point of exploiting the cluster remaining oil is to expand the microscopic sweep volume of the injected fluid. The research results of this paper show that there are two ways: One is to inject the polymer with the effect of microscopic control and displacement to try to block the large pore channel of water seepage, forcing the subsequent fluid to enter smaller pores and displace the remaining oil. The other is the injection of the surfactant, which changes the size and direction of capillary pressure, selectively increases the seepage resistance of the injected fluid in the large pores, and reduces the seepage resistance in the small pores.
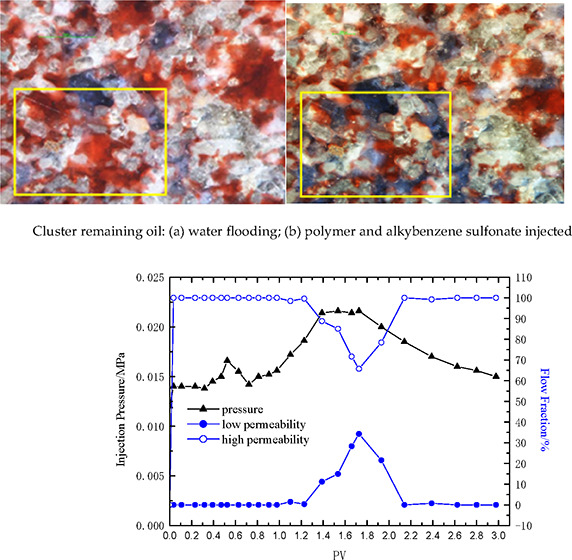
When injecting surfactant solution (JW-1), it can effectively repel the cluster remaining oil. When injecting alkylbenzene sulfonate and petroleum sulfonate alone, the cluster remaining oil basically remains unchanged. Compared with alkylbenzene sulfonate and petroleum sulfonate, surfactant solution (JW-1) has ultralow oil–water interfacial tension and good emulsifying performance, which is conducive to the migration of cluster remaining oil. When alkylbenzene sulfonate is added to polymer solution and then repelled, the polymer can block the large pore channels of water seepage flow and force the subsequent fluids into smaller pore spaces. This expands the sweep volume and thus can repel to the cluster remaining oil as shown in the Figure 11.
Figure 11.
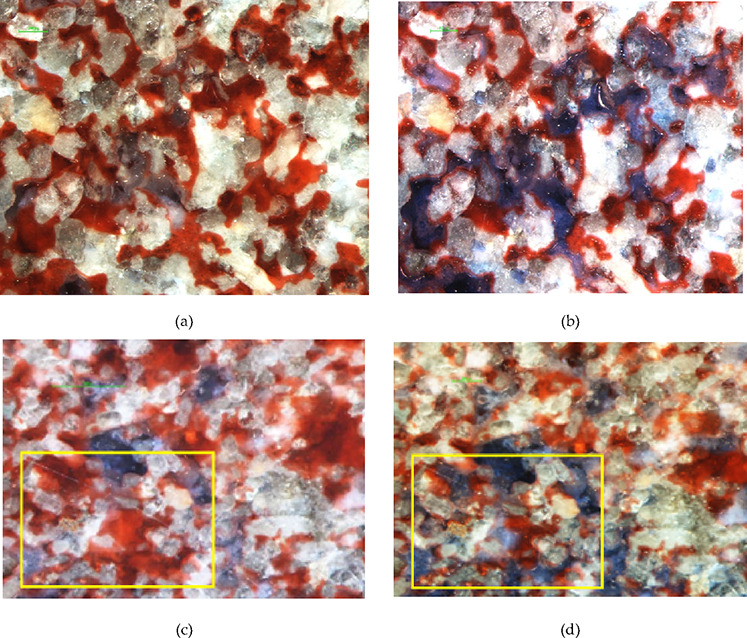
Cluster remaining oil: (a) water flooding, (b) surfactant flooding, (c) water flooding, and (d) polymer and alkylbenzene sulfonate being injected.
2.4. Polymer–Surfactant Flooding Injection Performance
2.4.1. Injection Performance Experiment
The injectivity test is conducted in order to investigate the injection performance of polymer–surfactant flooding in this type of low-permeability reservoirs. The core sample (diameter: 2.54 cm, length: 10 cm, and permeability: 50 mD) is fully saturated with the oil first. The experimental steps are shown in the above polymer injection experimental process. The pressure differences for these processes are recorded. RF and RRF are calculated with Formulas 4 and 5.
The pressure difference due to water flooding is 0.03 MPa. The pressure difference refers to that between inlet and outlet in water flooding. After the polymer–surfactant binary composite system of 1000 mg/L polymer +3000 mg/L surfactant is injected, the pressure difference gradually increases to a maximum of 0.75 MPa. The injection pressure is about 25 times that of water flooding. After the subsequent water injection, the pressure difference gradually decreases to a stable level and the RRF is 16, indicating no blockage in the above flooding system (Figure 12). Considering reservoir heterogeneity, this polymer (concentration and molecular weight) injection capacity is feasible in low-permeability reservoir.
Figure 12.
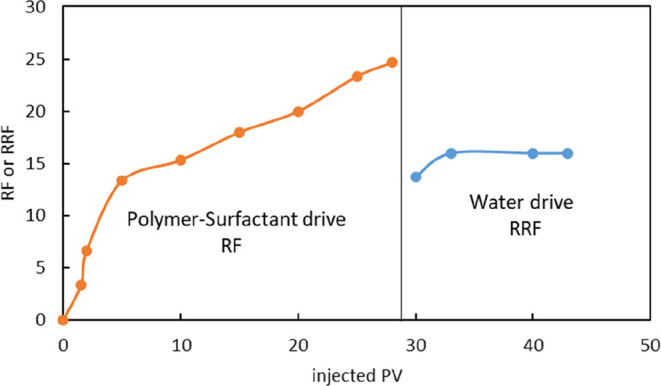
RF and RRF curve.
2.4.2. Flow Diversion Performance of the Polymer
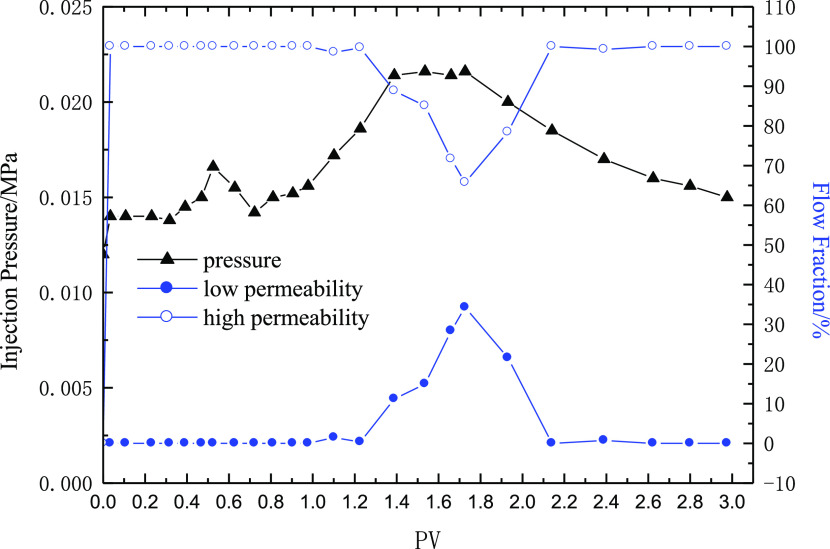
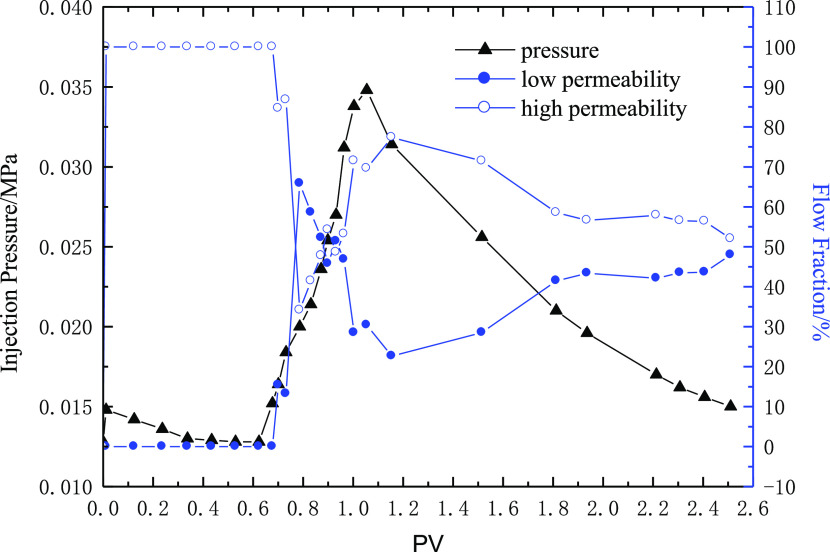
To measure the split ratio of the parallel cores in the process of water injection and polymer injection, the medium-permeability core (gas permeability 160 mD) and the low-permeability core (about 40 mD) are connected in parallel. This is used to characterize the liquid flow diversion performance of the polymer. The polymer solution with a molecular weight of 9 million and polymer concentrations of 1000 and 2500 mg/L is selected separately, and the injection volume is 0.5 PV. The experimental results are shown in Figures 13 and 14.
Figure 13.
Injection pressure and the flow rate of the polymer (HPAM concentration 1000 mg/L and core permeability 150 mD and 43 mD).
Figure 14.
Injection pressure and the flow rate of the polymer (HPAM concentration 2500 mg/L and core permeability 162 mD and 51 mD).
Figure 13 shows the liquid flow diversion performance when the polymer concentration reaches 1000 mg/L. During water flooding, all the injected liquid enters into the high-permeability core, and the split ratio of the high-permeability core reaches 100% and that of the low-permeability core reaches 0. With the increase in the injection amount of polymer solution, the injection pressure gradually increases. The liquid enters into the low-permeability core, and the amount of liquid entered into the high-permeability core begins to decrease. The maximum split ratio of the low-permeability core is close to 30%, which shows that the polymer has a certain fluid flow diversion ability. However, with the subsequent water injection, the split ratio of the low-permeability core rapidly decreases to that of the water injection, and all the injected water re-enters into the high-permeability core. The flow diversion ability of the polymer disappears. The experimental results show that the polymer solution, with a molecular weight of 9 million and a concentration of 1000 mg/L, has a certain ability to change the flow direction under the core permeability variation selected in the experiment, but the effective time is too short.
Figure 14 shows the liquid flow diversion performance when the polymer concentration is 2500 mg/L. During water flooding, all the injected liquid enters into the high-permeability core, and the flow fraction of the high-permeability core reaches 100% and that of the low-permeability core reaches 0. With the injection of polymer solution, the injection pressure gradually increases and liquid begins to enter into the low-permeability core, and the amount of liquid entering the high-permeability core begins to decrease. Finally, the low-permeability core’s flow fraction exceeds that of the high-permeability core, and the high flow fraction of the low-permeability core remains for a long time after subsequent water injection. The experimental results show that the polymer solution, with a molecular weight of 9 million and a concentration of 2500 mg/L, has a very good ability to change the flow direction under the permeability variation selected in the experiment. Therefore, on the premise of ensuring a certain injection capacity, a higher polymer concentration should be selected as far as possible in the middle- and low-permeability reservoirs.
2.4.3. Oil Displacement Experiment
Laboratory core’s length is 30 cm, with a diameter of 2.54 cm and its permeability of about 50 mD. In order to evaluate the oil displacement efficiency, the following method is used. The core sample is saturated with water first and then saturated with oil. After the core sample is saturated with oil, water is injected until the water cut reaches to 98%. The oil recovery factor is calculated based on the oil produced. After water injection, 0.3–0.4 pore volume of the surfactant or polymer or the polymer–surfactant system is injected, and then, water is injected until the water cut reaches to 98%. The oil recovery factor is also estimated from the oil being displaced.
Injection fluids flow through the models at a constant flow rate of 0.2 mL/min. Polymer–surfactant flooding can greatly increase oil recovery. Similar core experiments (Table 7) have confirmed that residual oil can be displaced completely by the use of polymer–surfactant flooding. Its oil recovery factor can be increased by 11.3–14.2% more than polymer flooding or surfactant flooding.
Table 7. Statistics of the Oil Displacement Effect of Different Oil Displacement Systems.
| case no. | displacement mode | injection system | core permeability mD | recovery % | EOR % |
|---|---|---|---|---|---|
| 1 | surfactant flooding | 0.4 PV 0.3% S | 55 | 51.8 | 5.4 |
| 2 | polymer flooding | 0.4 PV 0.3% P | 46 | 56.9 | 9.7 |
| 3 | surfactant–polymer flooding | 0.4 PV 0.1% P + 0.3% S | 54 | 65.1 | 14.2 |
| 4 | surfactant–polymer flooding | 0.3 PV 0.1% P + 0.3% S | 51 | 60.4 | 11.3 |
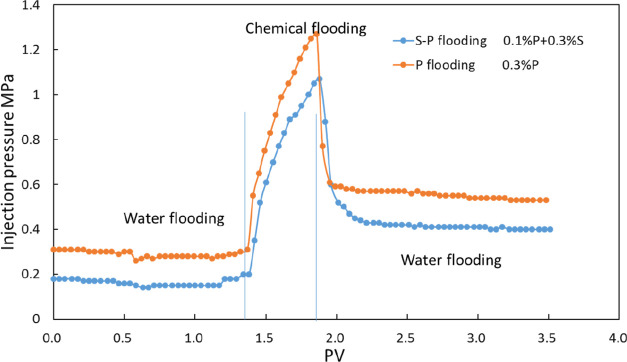
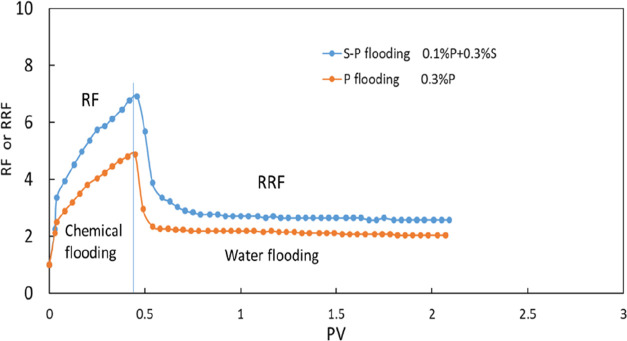
The permeability of the rock used in case 2 is 46 mD. The pressure after water injection is 0.28 MPa. Then, the 0.4 PV polymer is injected into the rock, and the pressure is increased to 1.27 MPa. After polymer injection, water is reinjected and the pressure drop is 0.53 MPa. Based on Formulas 4 and 5, the RF and RRF are calculated to be 4.53 and 1.89, respectively (Figures 15, 16).
Figure 15.
Core injection pressure curves of different displacement types.
Figure 16.
RF and RRF curves.
In case 3, the rock permeability is 54 mD. The pressure after water injection is 0.16 MPa. The pressure is increased to 1.07 MPa with the 0.4 PV binary system with the polymer and surfactant being injected. Then, water is reinjected, and the pressure drop is 0.4 MPa. The RF and RRF are calculated to be 6.7 and 2.5, respectively, according to Formulas 4 and 5. Because the rock permeability in case 2 is lower than that in case 3, the pressure in case 2 is higher than that in case 3. The polymer–surfactant flooding has a better effect in improving the water–oil mobility ratio.
2.5. Results
The formula of efficient binary flooding is 0.3% surfactant +0.1% polymer. The designed injection rate is 0.1 PV per year and the injection volume is 0.45 PV. The technique has been applied in the target block, which has been shown to be effective. The injection pressure at the surface level can be from 18.8 to 22.6 MPa. Polymer–surfactant flooding could effectively alleviate intra-and inter-layer contradictions in the reservoir. The water injection and fluid production profiles have been changed before and after polymer–surfactant flooding. After polymer–surfactant flooding, the ratio of the high profile is decreased and the ratio of the low profile is increased. The polymer–surfactant flooding has a good effect on increasing oil production and decreasing water production. The maximum oil production is increased from 12.5 to 30 t/d. The oil production is around 14.5 t/d right now. The water cut is decreased from 82.9 to 69.3%. Now, the water cut is around 80%. The effective oil production well ratio is 84.6%. The project has increased oil output by 77700 t and recovery factor by 3.5%.
3. Conclusions
In this work, the following conclusions of surfactant–polymer flooding can be drawn:
-
(1)
Through repeated experiments, surfactants with different numbers of oxypropylene chains have the same effect toward the reservoir, while the surfactant with high alkyl carbon chain numbers is more conducive to the contraction of oil films.
-
(2)
The molecular weight of polymer flooding suitable for low-permeability reservoirs ranges from 6 to 9 million.
-
(3)
The polymer–surfactant flooding system has good injectivity, and the oil recovery increases 10% in laboratory core tests.
-
(4)
After the implementation of binary flooding in the target block, water cut drops and the total oil output increases.
Polymer–surfactant flooding is an effective method to further enhance oil recovery in low-permeability reservoirs.
Acknowledgments
We thank the Shanghai Petrochemical Research Institute for the surfactant and Jiangsu oilfield for project support. This research was supported by the SINOPEC scientific and technological project (P10092).
The authors declare no competing financial interest.
References
- Wang D. M.; Wu X. L.; Zhou W. F.; Li X. J.; Han P. H. Technologies of enhancing oil recovery by chemical flooding in Daqing Oilfield, NE China. Petrol. Explor. 2018, 45, 673. 10.1016/s1876-3804(18)30071-5. [DOI] [Google Scholar]
- Wang R.; Lun Z. M.; Lv C. Y.; Wang Y. Q.; Tang Y. Q.; Wang X. Research status and development trends of worldwide new technologies for enhanced oil recovery. Pet. Geol. Recovery Effic. 2021, 5, 81–86. [Google Scholar]
- Wang X.; Ge L.; Liu D.; Zhu Q.; Zheng B. Experimental study on influencing factors of resistance coefficient and residual resistance coefficient in oilfield Z. World J. Eng. Technol. 2019, 07, 270–281. 10.4236/wjet.2019.72018. [DOI] [Google Scholar]
- Ahmed T.; Meehan D. N.. Advanced Reservoir Management and Engineering; Gulf Professional Publishing, 2012. [Google Scholar]
- Wang D. Study on ASP flooding, binary system flooding and mono-system flooding in Daqing oilfield. Pet. Geol. Oilfield Dev. Daqing 2003, 3, 1–9. [Google Scholar]
- Feng A.; Zhang G.; Ge J.; Jiang P.; Pei H.; Zhang J.; Li R.. Study of surfactant-polymer flooding in heavy oilreservoirs. In Proceedings of the SPE Heavy Oil Conference Canada, Calgary, AB, Canada, 2012; pp 12–14.
- Luo P.; Wu Y.; Huang S.. Optimized surfactant-polymer flooding for western Canadian heavy oils. Proceedings of the SPE Heavy Oil Conference Canada, Calgary, AB, Canada, 2013; pp 11–13.
- Jia C. Z. Development challenges and future scientific and technological researches in china’s petroleum industry upstream. Acta Petrol. Sin. 2020, 12, 1445–1464. [Google Scholar]
- Lu X.-G.; Gao Z.-H. Pore throat radius to coil gyration radius ratio as characteristic of adaptivity of polymer molecular mass to core permeability. Oilfield Chem. 1996, 1, 72–75. [Google Scholar]
- Zhang J. C.Enhanced Oil Recovery; Petroleum Industry Press, 1995; pp 65–66. [Google Scholar]
- Shiran B. S.; Skauge A. Enhanced Oil Recovery (EOR) by Combined Low Salinity Water/Polymer Flooding. Energy Fuels 2013, 27, 1223. 10.1021/ef301538e. [DOI] [Google Scholar]
- Chen T.; Zhang G.; Ge J. Dynamic interfacial tension between Gudao heavy oil and petroleum sulfonate/HPAM complex systems. Petrol. Sci. Technol. 2012, 30, 1417–1423. 10.1080/10916466.2011.626006. [DOI] [Google Scholar]
- Shah D. O.; Schechter R. S.. Improved Oil Recovery by Surfactant and Polymer Flooding; Academic Press Inc.: New York, 1977. [Google Scholar]
- Kamal M. S.; Hussein I. A.; Sultan A. S. Review on Surfactant Flooding: Phase Behavior, Retention, IFT, and Field Applications. Energy Fuels 2017, 31, 7701–7720. 10.1021/acs.energyfuels.7b00353. [DOI] [Google Scholar]
- Zerpa L. E.; Queipo N. V.; Pintos S.; Salager J.-L. An Optimization Methodology of Alkaline-Surfactant-Polymer Flooding Processes Using Field Scale Numerical Simulation and Multiple surrogates. Petrol. Sci. Eng. 2005, 47, 197–208. 10.1016/j.petrol.2005.03.002. [DOI] [Google Scholar]
- Azamifard A.; Bashiri G.; Gerami S.; Hemmati-Sarapardeh A. On the Evaluation of Alkaline-Surfactant-Polymer Flooding in a Field Scale: Screening, Modelling, and Optimization. Can. J. Chem. Eng. 2017, 95, 1615. 10.1002/cjce.22834. [DOI] [Google Scholar]
- Lee K. S. Efficiency of Horizontal and Vertical Well Patterns on the Performance of Micellar-Polymer Flooding. Energy Proc. 2012, 16, 889–894. 10.1016/j.egypro.2012.01.142. [DOI] [Google Scholar]
- Alsofi A. M.; Blunt M. J. Polymer flooding design and optimization under economic uncertainty. J. Pet. Sci. Eng. 2014, 124, 46–59. 10.1016/j.petrol.2014.10.014. [DOI] [Google Scholar]
- Le Van S.; Chon B. Chemical flooding in heavy-oil reservoirs: from technical investigation to optimization using response surface methodology. Energies 2016, 9, 711. 10.3390/en9090711. [DOI] [Google Scholar]
- Zerpa L. E.; Queipo N. V.; Pintos S.; Salager J.-L. An optimization methodology of alkaline-surfactant-polymer flooding processes using field scale numerical simulation and multiple surrogates. J. Pet. Sci. Eng. 2005, 47, 197–208. 10.1016/j.petrol.2005.03.002. [DOI] [Google Scholar]
- Bataweel M. A.; Nasr-EI-Din H. A.. ASP vs SP Flooding in high salinity/hardness and temperature in sandstone cores. Proceedings of the SPE EOR Conference at Oil and Gas West Asia, Muscat, Oman, 2012; pp 16–18.


