Abstract
An easily accessible colorimetric probe, a carbazole–naphthaldehyde conjugate (CNP), was successfully prepared for the selective and sensitive recognition of Sn(II) in different commercially-available toothpaste and mouth wash samples. The binding mechanism of CNP for Sn2+ was confirmed by UV–Vis, 1H, and 13C NMR titrations. The proposed sensing mechanism was supported by quantum chemical calculations. Selective detection of Sn(II) in the nanomolar range (85 nM), among other interfering metal ions, makes it exclusive. Moreover, Sn2+ can be detected with a simple paper strip from toothpaste, which makes this method handy and easily accessible. The potential application of this system for monitoring Sn2+ can be used as an expedient tool for environmental and industrial purposes.
Subject terms: Environmental sciences, Chemistry
Introduction
The utilization of tin has been established for thousands of years and the most commonly used for the manufacturing of bronze, which is a tin and copper alloy. In the recent era, Sn(II) is used in many fields in the industry such as aerospace, construction and home decor, electronics, jewelry manufacturing, telecommunications, paint/plastic industries, and agriculture via pesticides1. Sn(II) as fluoride is present in several dental care products such as toothpaste and mouth rinse2. Sn2+ has been utilized in dentistry as a chemical adjunct to prevent dental caries since 19503,4. It was found to effectively inhibit Streptococcus mutants, which leads to tooth decay in human interproximal dental plaque and oral disease5. However, the wide utilization of toothpaste in our everyday life may increase the consumption of Sn2+ in the human body. The continuous use of Sn(II) becomes detrimental to our health and environment as well. The human can intake Sn(II) by breathing, through the skin, or by the consumption of food6. The accumulation of Sn(II) can induce acute and long-term effects in the human body such as eye irritations, heavy sweating, urination complications. Excess consumption of Sn(II) also finds severe immunotoxic and neurotoxic effects in humans causing symptoms such as disorders in the immune system, damage in liver functioning, chromosomal destruction, damage in the brain, and lack of red blood cells7–10. Recent studies revealed that the presence of an excess of Sn(II) in humans can easily be coordinated by white blood cells and enter into the cells by calcium channels, inducing DNA damage11,12. According to the guiding principles of the World Health Organization’s (WHO) for metals, the permissible limit of Sn(II) in drinking water and canned foods are 8.4 × 10⁻⁴–8.4 × 10⁻³ M and 2.105 × 10⁻⁶ M, respectively13. Due to the hazardous impacts of Sn(II) on humans, consumption of Sn(II) must be closely monitored.
The development of a highly sensitive expedient and readily accessible tool is the greatest requirement. However, various methods have already been performed to detect Sn(II)14–20, fluorimetric and colorimetric sensing method is one of the simplest and convenient sensing methods over other established detection techniques because it offers the advantage of ‘on spot’ real-time detection with naked eyes, low cost, portable, and wide applicability21–29. Hence, inspired with the requirement of active colorimetric probes, herein, we report the synthesis and sensing behavior of a novel colorimetric probe carbazole-naphthaldehyde conjugate (CNP) that exhibits high selectivity and sensitivity toward Sn2+ in the neutral aqueous medium (10 mM phosphate buffer, pH 7.0). The structure of the synthesized probe CNP was confirmed by detailed NMR (1H NMR, 13C NMR), HRMS, and X-ray analysis (Figure S1–S4, ESI†) as well as optimized by density functional theory. Significantly, the discriminative detection and quantification of Sn2+ in different toothpaste samples has also been accomplished using our synthesized probe CNP. To the best of our knowledge, this is the first colorimetric sensor displaying a distinguished recognition of Sn2+ in different toothpaste and mouth wash samples.
Results and discussions
To explore the interaction pattern of the probe CNP with Sn2+, we have performed several experiments such as NMR titration, absorbance titration, pH titration, selectivity test and theoretical calculations.
Crystallographic analysis
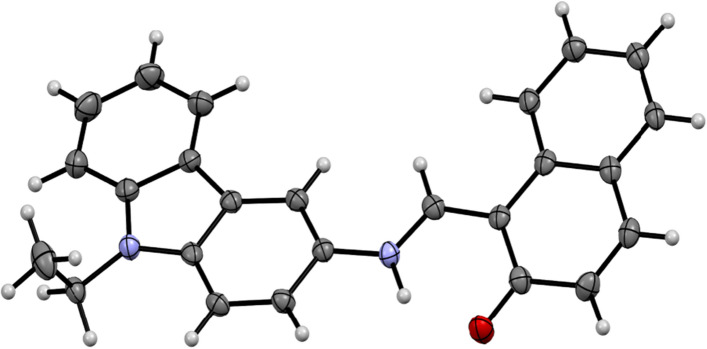
Single crystals suitable for X-ray diffraction were obtained by slow evaporation of an acetonitrile solution of CNP at 3 °C. It crystallises in the monoclinic space group P21/n (Fig. 1, Figure S4 in ESI†). Different than in solution where CNP is unequivocally present as the enol-imine tautomer (Figures S1, S2 in ESI†), the X-ray structure of CNP revealed that the compound is in the keto-enamine form in solid-state.
Figure 1.
Displacement ellipsoid plot of CNP. Displacement ellipsoids are drawn at the 50% probability level.
NMR titration analysis
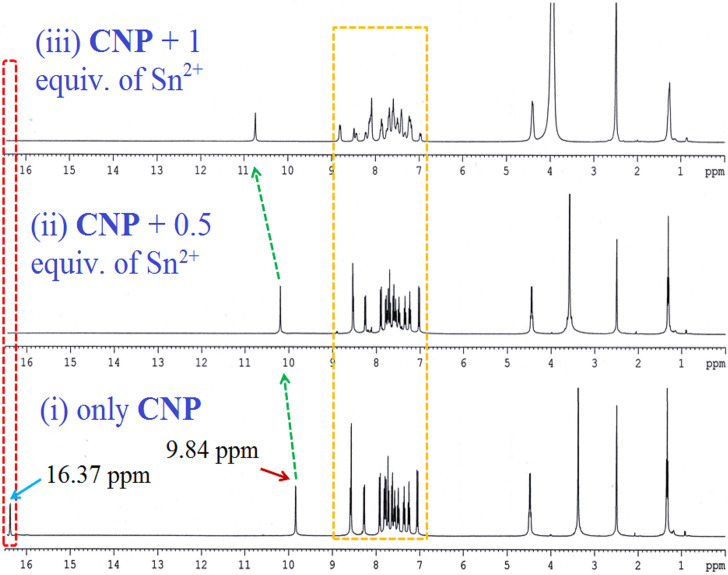
Interactive properties of the probe CNP towards Sn2+ was investigated through 1H, 13C NMR titrations in DMSO-d6 and D2O. In 1H NMR titration, the aromatic –OH proton peak at 16.37 ppm abruptly disappears after addition of one equivalent of Sn2+ (SnCl2 dihydrate), followed by downfield shift of imine proton peak at 9.84 ppm. This phenomena indicates the formation of strong coordination between –OH, –N groups of CNP and Sn2+ (Fig. 2).
Figure 2.
1H NMR titration [400 MHz] of CNP in DMSO-d6 at 25 °C and the corresponding changes after the addition of Sn2+ (SnCl2·2H2O) in D2O from (1) only CNP, (2) CNP + 0.5 equivalent of Sn2+, and (3) CNP + 1 equivalent of Sn2+.
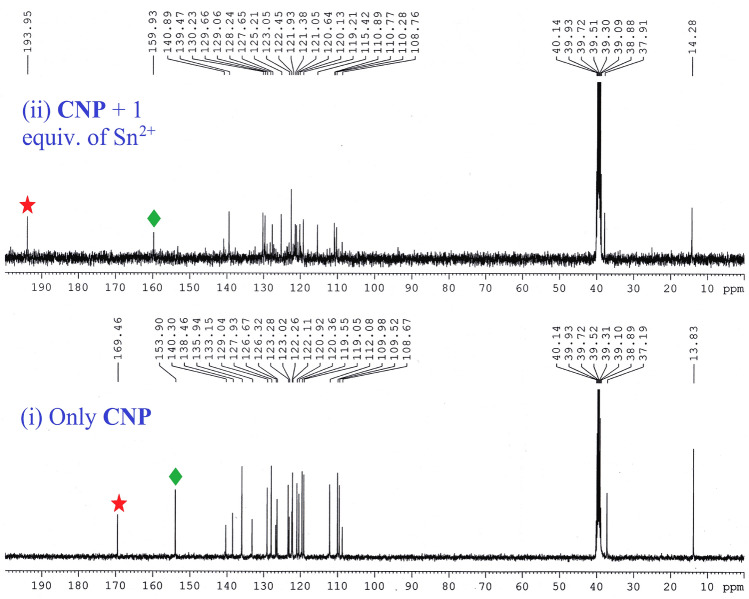
Moreover in 13C NMR titration with the addition of one equivalent Sn2+, the carbon attached with –OH group shifts downfield from 169 to 193 ppm and also the imine ‘C’ peak at 153 ppm shifted towards 159 ppm with decreased intensity (Fig. 3). The above features also confirm the formation of CNP–Sn2+ complex.
Figure 3.
13C NMR titration [100 MHz] of CNP in DMSO-d6 at 25 °C and the corresponding changes after addition of Sn2+in D2O where (1) only CNP, and (2)CNP + 1 equivalent of Sn2+.
UV–Vis spectral behaviour of CNP with Sn2+
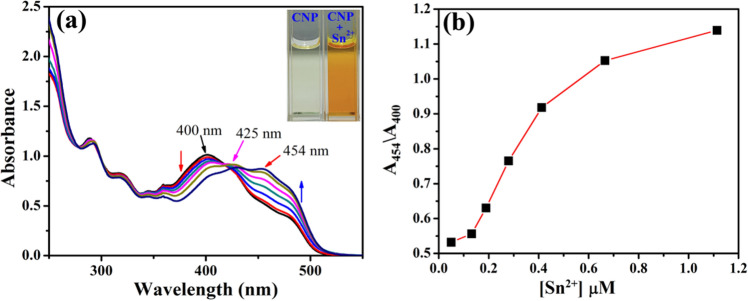
The interactions between the probe CNP and Sn2+ was demonstrated by absorbance titration in acetonitrile:water (1:8, v/v) at neutral pH value (pH 7.0, 10 mM phosphate buffer). In the UV–Vis absorption spectra, we get a characteristic absorbance peak of CNP at 400 nm which decreases upon incremental addition of Sn2+, with an enhancement at 454 nm followed by a rapid colour change from pale yellow to deep orange. Furthermore, a notable isosbestic point at 425 nm indicates possible stronger interaction between CNP and Sn2+ (Fig. 4a). Ratiometric changes in absorbance with increasing concentration of Sn2+ have been represented in Fig. 4b.
Figure 4.
(a) UV–Vis absorption spectra of CNP (1 μM) upon incremental addition of Sn2+ up to 1.2 µM in CH3CN:H2O (1:8, v/v) at pH 7.0 (10 mM phosphate buffer) [inset: naked eye colour change of CNP on addition of Sn2+]. (b) Ratiometric change in absorbance with increasing concentration of Sn2+ at neutral pH.
Binding interactions determine 1:1 stoichiometric ratio of CNP and Sn2+ (Figure S5, ESI†) with a high association constant of 0.35 × 10⁶ M-1 from absorption spectra30,31 (Figure S6, ESI†). The detection limit of CNP for Sn2+ has been evaluated 0.85 nM (Figure S7, ESI†).
Effect of pH value
pH titration clearly reflects that CNP is slight sensitive towards acidic pH values whereas the CNP–Sn2+ complex is pH independent (Figure S8, ESI†). So, we carried out all the experiments in the pH value range of 7.0 using 10 mM phosphate buffer.
Colorimetric responses of CNP toward various metal ions
The colorimetric behaviour of the sensor probe CNP was evaluated upon the addition of various metal ions in the aqueous medium (10 mM phosphate buffer, pH 7.0). As depicted in Figure S9, the pale yellow color of the probe turned to deep orange with the addition of Sn2+. The synthesized probe CNP did not show any notable color changes with the addition of other metal ions. The specific color change of CNP with Sn2+ was attributed to several electron transitions in the CNP–Sn2+ complex such as π–π*, d–d, ligand–metal charge transfer, and metal–ligand charge-transfer effects. Furthermore, the comparative spectrophotometric response of CNP was also studied with these metal ions which confirms that our probe CNP selectivity sense Sn2+ over other metal ions (Figure S10, ESI†). Therefore, these experimental results indicate that our synthesized probe CNP shows remarkable selectivity and sensitivity towards Sn2+ over other analytes which could be a beneficial tool for practical approach.
Theoretical calculations
Theoretical calculations were executed for CNP and CNP–Sn2+ complex systems using quantum chemical calculations at the DFT level LANL2DZ/6-31G** method basis set implemented at Gaussian 09 program32 and CPCM (Conductor like Polarizable Continuum Model) solvent model was used for solvent (water) effect incorporation. In the optimized structure of CNP, the positions of carbazole and naphthaldehyde units were nearly in the same plane. The optimized structure of the CNP–Sn2+ complex showed the formation of coordination bonds of Sn2+ with –OH and –N groups of CNP, which enhanced the stability of the complex (Figure S11, Table S1, ESI†).
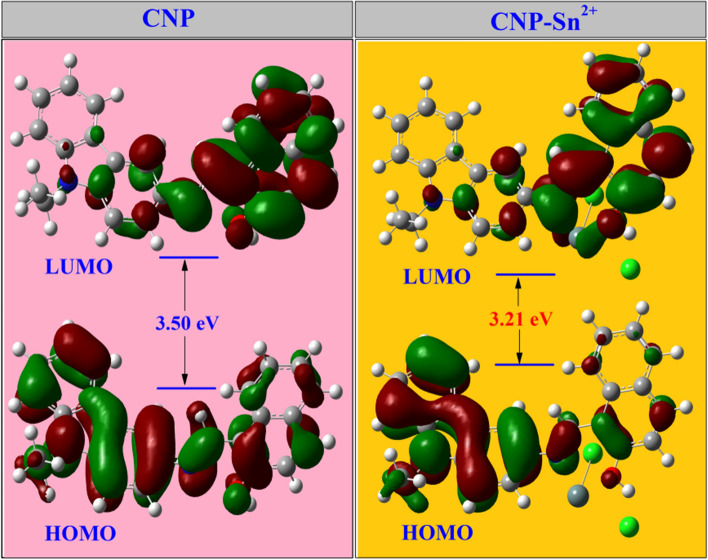
From TDDFT calculation, we can see that there is a sharp S0–S1 transition in CNP at 410 nm (oscillator strength f = 0.5188) which is very close to that experimentally observed value at 400 nm, responsible for the absorption of the carbazole moiety. Moreover, in CNP–Sn2+, the transition at 448 nm (S0–S1, f = 0.3563) indicates the π–π* electronic transition from the carbazole to naphthaldehyde moiety which is distinctly executed in the absorbance graph at 454 nm (Table S2, ESI†). Next, the energy distributions of HOMO and LUMO for CNP and its Sn2+ complex were examined (Table S3, ESI†). As shown in Fig. 5, the energy of the HOMO and LUMO orbital levels for the CNP–Sn2+ complex is lower than that of the probe CNP. Also, the HOMO–LUMO energy gap of CNP and CNP–Sn2+ complex was calculated with an energy difference of 0.29 eV.
Figure 5.
HOMO and LUMO distributions of CNP and CNP–Sn2+.
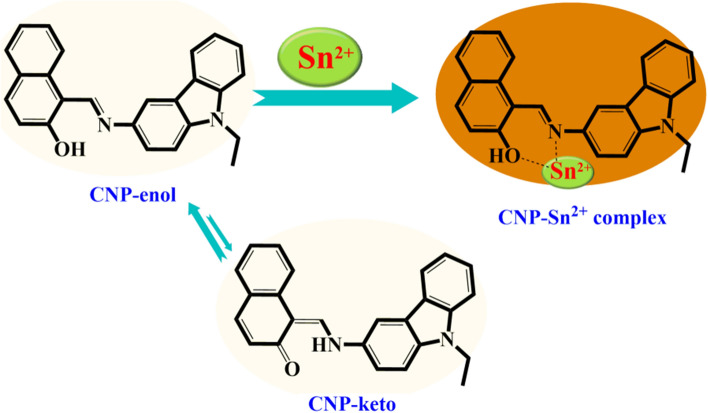
These outcomes indicate that the effective resonance attraction obtained in the CNP–Sn2+ complex. The density of the orbital coefficient migrates from the carbazole unit to naphthaldehyde units in CNP, whereas in the CNP–Sn2+ complex, the orbital coefficient of total framework is moving towards Sn2+ via N–Sn2+ coordination bond. Hence, the obtained results imply the formation of a stable complex, which is consistent with the proposed binding mechanism. Furthermore, the mass of the CNP–Sn2+ complex has been checked which truly validated the binding mechanism (Figure S12, ESI†). The anticipated coordination mechanism of the CNP–Sn2+ complex is given in Fig. 6. In 1H NMR spectrum, the resonances assigned to the hydroxyl and imine groups are 16.37 ppm and 9.84 ppm, respectively. The naphthalene CO and imine C resonances in 13C NMR spectroscopy are observed at 169.46 and 153.90 ppm, respectively.
Figure 6.
Proposed colorimetric detection mechanism of the CNP–Sn2+ complex.
Plausible mechanism and explanation
The naphthalene C–O bond length (1.282(3) Å) observed in the X-ray structure is characteristic of ketones rather than phenols, and the C–N bond (1.324(3) Å) is elongated relative to that of a typical imine33,34. Accordingly, CNP-enol is more susceptible to bind with Sn2+ through stronger hydrogen bonding which is also corroborated with IR experiments(Figure S13, ESI†).In consequence, the pale yellow color of CNP becomes the deep orange color due to the non-covalent interactions of CNP with Sn2+ (Fig. 6).
Quantitative analysis
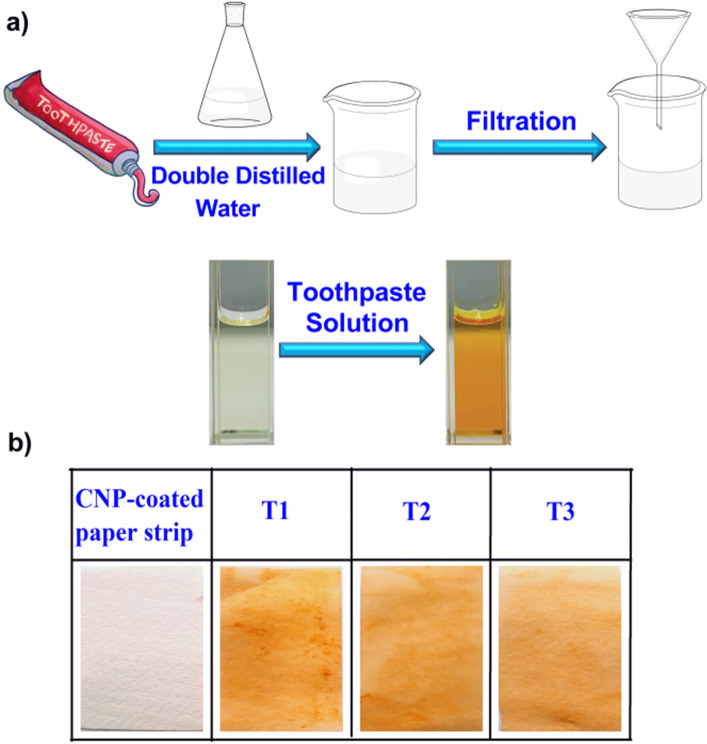
The excellent photophysical properties of the probe CNP toward Sn2+, such as high sensitivity and selectivity at physiological pH encouraged us to further evaluate the potential of the probe for realistic approach. The specific and selective recognition of Sn2+ by the chemosensor CNP was also examined in three different toothpaste samples. In this work, we took commercially available toothpastes from three different brands (T1, T2, T3). The details procedure of the preparation of toothpaste solutions was described in ESI†. Toothpaste solutions were then added to the CNP solution, a rapid orange color change resulted after few minutes (Fig. 7a). Furthermore, the method was also applied to recognize Sn2+ by a simple paper strip in different toothpaste solutions. Three paper strips soaked in CNP were dipped separately in the different toothpaste solutions (T1, T2, T3), and Fig. 7b shows the respective color changes of CNP-coated paper strip after dipping in the toothpaste solutions T1, T2, T3 respectively.
Figure 7.
(a) Schematic diagram for estimation of Sn2+ in toothpaste samples using the probe CNP. (b) Display of naked-eye color change of CNP-coated paper strip after dipping in T1, T2, T3 solutions, respectively) (all experiments performed at pH 7.0, 10 mM phosphate buffer).
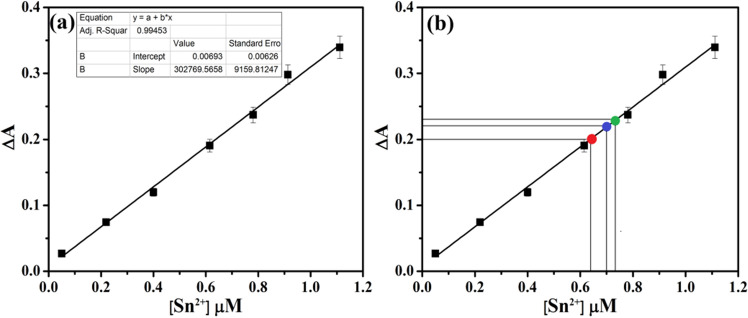
The concentration of Sn2+ was also quantified from these three different toothpaste samples (T1, T2, T3). For this work, the above-mentioned toothpaste samples were subjected to colorimetric analysis at pH 7.0 (10 mM phosphate buffer) to quantify the amount of Sn2+ present therein. Sn2+ was quantified from these given samples by CNP (1 µM) by virtue of its selective and direct recognition properties. All estimations were done in triplicate. Concentrations of Sn2+ were estimated by comparison with the CNP–Sn2+ standard absorbance curve. From the standard curve it was found that the concentration of Sn2+ were 0.73 µM, 0.70 µM and 0.64 µM in 100 µL of T1, T2 and T3 samples, respectively (Fig. 8, Table 1). Concentration of Sn2+ was further quantified from two different mouth wash samples (M1, M2) using above mentioned procedure and the respective values are 0.25 µM and 0.28 µM in 100 µL sample solution (Table 2).
Figure 8.
(a) Standard fluorescence curve obtained for the estimation of Sn2+ ions. (b) Estimation of unknown concentration of Sn2+ ions (red, blue and green point) in the different toothpaste samples from the standard fluorescence curve. Standard deviations are represented by error bar (n = 3).
Table 1.
Determination of [Sn2+] in algae solutions under UV-lamp.
| Toothpaste sample | Conc. of CNP (µM) | Amount of toothpaste sample taken (µL) | Conc. of Sn2+ (µM) | Average conc. of Sn2+ (µM) |
|---|---|---|---|---|
| T1 | 1 | 100 | 0.73 | 0.73 |
| 100 | 0.74 | |||
| 100 | 0.72 | |||
| T2 | 1 | 100 | 0.69 | 0.70 |
| 100 | 0.70 | |||
| 100 | 0.71 | |||
| T3 | 1 | 100 | 0.63 | 0.64 |
| 100 | 0.65 | |||
| 100 | 0.64 |
Table 2.
Determination of [Sn2+] in different mouth wash samples.
| Mouth wash sample | Conc. of CNP (µM) | Amount of Mouth wash sample taken (µL) | Conc. of Sn2+ (µM) | Average conc. of Sn2+ (µM) |
|---|---|---|---|---|
| M1 | 1 | 100 | 0.25 | 0.25 |
| 100 | 0.23 | |||
| 100 | 0.24 | |||
| M2 | 1 | 100 | 0.29 | 0.28 |
| 100 | 0.27 | |||
| 100 | 0.28 |
Conclusion
In conclusion, a new carbazole-naphthaldehyde based colorimetric probe CNP was successfully synthesized for selective recognition of Sn2+ in the aqueous medium under physiological pH value. The structure of the synthesized probe CNP was analyzed by single crystal X-ray diffraction which represents the presence of keto (CNP-keto) form in its solid state. The sensing mechanism has been triggered by the strong coordination bonding of CNP-enol with Sn2+, which was confirmed by absorbance, 1H and 13C NMR spectroscopy as well as mass spectrometry (HRMS). Theoretical calculations were also performed to justify the binding mechanism and optical behavior of the sensor probe. CNP showed high selectivity and sensitivity for Sn2+ even in the presence of other metal ions. The detection limit of the probe for Sn2+ was calculated to be 85 nM, which is much lower than the WHO permissible amount of Sn2+ in drinking water. We further demonstrated that CNP has been utilized as a colorimetric sensor to detect and quantify trace amounts of Sn2+ in different toothpaste and mouth wash samples. A handy and accessible paper strip method has been proposed for this purpose. Being a potential probe, it can be used as an expedient ‘in-field’ approach to estimate Sn2+ for environmental and industrial purposes for sustainable and environment-friendly industrial production.
Experimental section
Materials and methods
All the reagents were purchased from Sigma-Aldrich Pvt. Ltd. (India). Unless otherwise mentioned, materials were obtained from commercial suppliers and were used without further purification. Solvents were dried according to standard procedures. Elix Millipore water was used in all respective experiments. 1H and 13C NMR spectra were recorded on a Bruker 400 MHz instrument. For NMR spectra, DMSO-d6 and for NMR titration DMSO-d6 and D2O were used as solvent using TMS as an internal standard. Chemical shifts are expressed in δ ppm units and 1H–1H and 1H–13C coupling constants in Hz. The mass spectrum (HRMS) was carried out using a micromass Q-TOF Micro™ instrument by using methanol as a solvent. UV spectra were recorded on a SHIMADZU UV-3101PC spectrophotometer. FT-IR data were recorded on Shimadzu IRAffinity-1S Fourier transform infrared spectrometer (Spectrum Two) by ATR technique. The following abbreviations are used to describe spin multiplicities in 1H NMR spectra: s = singlet; d = doublet; t = triplet; m = multiplet. Single crystal X-ray data of CNP was measured using a dual-source Rigaku Super Nova diffractometer equipped with an Atlas detector and an Oxford Cryostream cooling system using mirror-monochromated Cu-Kα radiation (λ = 1.54184 Å). Data collection and reduction for both compounds were performed using the program CrysAlisPro35 and Gaussian face-index absorption correction method was applied35. The structures were solved with Direct Methods (SHELXS)36–38 and refined by full-matrix least-squares based on F2 using SHELXL-201536–38. Non-hydrogen atoms were assigned anisotropic displacement parameters unless stated otherwise. The hydrogen atom bonded to nitrogen was located from Fourier difference maps and refined with an N–H distance restraint of approximately 0.96 Å. Otherhydrogen atoms were placed in idealised positions and included as riding. Isotropic displacement parameters for all H atoms were constrained to multiples of the equivalent displacement parameters of their parent atoms with Uiso(H) = 1.2 Ueq(parent atom). The single crystal X-ray data, experimental details as well as CCDC number are given in the Supporting Information.
Synthetic procedure of CNP
In a 100 mL round bottom flask, 2-hydroxy naphthaldehyde (1.0 g, 5.8 mmol) in 30 ml ethanol was vigorously stirred at ambient temperature for few minutes. Then, 3-amino-9-ethyl carbazole (1.46 g, 6.95 mmol) was dissolved in ethanol (10 mL) and added dropwise to the solution. The reaction mixture was refluxed for 24 h at 83 °C. After completion of the reaction (monitored by TLC), the solvent was evaporated completely under reduced vapor pressure, then extracted with chloroform and water. After drying it over anhydrous Na2SO4, the organic layer was evaporated completely to get the solid product. This product was purified by column chromatography with the eluent CHCl3:PET (5:1, v:v) to get the product CNP with 86% yield (Fig. 9). 1H NMR (400 MHz, DMSO-d6): δ (ppm) = 16.37 (s, 1H), 9.84 (s, 1H), 8.57–8.59 (d, 2H, J = 8 Hz), 8.26–8.28 (d, 1H, J = 8 Hz), 7.90–7.92 (d, 1H, J = 8 Hz), 7.77–7.82 (t, 2H, J = 20 Hz), 7.71–7.73 (d, 1H, J = 8 Hz), 7.62–7.64 (t, 1H, J = 8 Hz), 7.55–7.57 (t, 1H, J = 8 Hz), 7.47–7.51 (t, 1H, J = 16 Hz), 7.34–7.37 (t, 1H, J = 12 Hz), 7.23–7.26 (t, 1H, J = 12 Hz), 7.04–7.06 (d, 1H, J = 8 HZ), 4.47–4.49 (q, 2H, J = 8 Hz), 1.31–1.34 (t, 3H, J = 12 Hz). 13C NMR (100 MHz, DMSO-d6): δ (ppm) = 169.46, 153.90, 140.30, 138.46, 135.94, 133.15, 129.04, 127.93, 126.67, 126.32, 123.28, 123.02, 122.26, 122.11, 120.92, 120.36, 119.55, 119.05, 112.08, 109.98, 109.52, 108.67, 37.19, 13.83. HRMS (TOF MS): (m/z, %): Calcd. for C25H20N2O: 364.1576. Found: m/z = 365.1283 (M + H+).
Figure 9.
Synthesis of the probe CNP.
Supplementary Information
Acknowledgements
P.S. acknowledges CSIR, India, for awarding her the major Grant [Project file no. 02(0384)/19/EMR-II dated 20/05/2019]. S.K. and S.S. are sincerely thankful to UGC India for their research fellowship. We are thankful to Department of ISERC, Visva-Bharati University, India for the assistance with FT-IR, funded by DST FIST (ref. no. SR/FST/CS-I/2017/21).
Author contributions
S.K. performed all the experiments, interpreted data and prepared the manuscript. K.-N.T. and K.R. helped with the crystallographic analysis and revision of the manuscript. S.S. cross checked the manuscript and supporting information thoroughly and modified several sections. P.S. conceptualised the research, designed the experiments, wrote and edited the manuscript.
Competing interests
The authors declare no competing interests.
Footnotes
Publisher's note
Springer Nature remains neutral with regard to jurisdictional claims in published maps and institutional affiliations.
Supplementary Information
The online version contains supplementary material available at 10.1038/s41598-022-06299-0.
References
- 1.Ravichandiran P, Prabakaran DS, Bella AP, Boguszewska-Czubara A, Masłyk M, Dineshkumar K, Johnson PM, Park B-H, Han M-K, Kim HG, Yoo D. Naphthoquinone-dopamine linked colorimetric and fluorescence chemosensor for selective detection of Sn2+ ion in aqueous medium and its bio-imaging applications. J. ACS Sustain. Chem. Eng. 2020;8:10947–10958. doi: 10.1021/acssuschemeng.0c03548. [DOI] [Google Scholar]
- 2.Tenuta LMA, Cury JA. Laboratory and human studies to estimate anticaries efficacy of fluoride toothpastes. Monogr. Oral Sci. Basel Karger. 2013;23:108–124. doi: 10.1159/000350479. [DOI] [PubMed] [Google Scholar]
- 3.Fiorillo L, Cervino G, Herford AS, Laino L, Cicciù M. Stannous fluoride effects on enamel: A systematic review. Biomimetics. 2020;5:41. doi: 10.3390/biomimetics5030041. [DOI] [PMC free article] [PubMed] [Google Scholar]
- 4.Tinanoff N. Special issue. Int. J. Clin. Dent. 1995;6:37. [PubMed] [Google Scholar]
- 5.Keene HJ, Shklair IL, Mickel GJ. Effect of multiple dental floss-SnF2 treatment on Streptococcus mutans in interproximal plaque. J. Dent. Res. 1977;56:21. doi: 10.1177/00220345770560010301. [DOI] [PubMed] [Google Scholar]
- 6.Ravichandiran P, Kaliannagounder VK, Bella AP, Boguszewska-Czubara A, Masłyk M, Kim CS, Park CH, Johnson PM, Park B-H, Han M-K, Kim AR, Yoo DJ. Simple colorimetric and fluorescence chemosensing probe for selective detection of Sn2+ ions in an aqueous solution: Evaluation of the novel sensing mechanism and its bioimaging applications. Anal. Chem. 2021;93:801–811. doi: 10.1021/acs.analchem.0c03196. [DOI] [PubMed] [Google Scholar]
- 7.Rudel H. Case study: Bioavailability of tin and tin compounds. Ecotoxicol. Environ. Saf. 2003;56:180–189. doi: 10.1016/S0147-6513(03)00061-7. [DOI] [PubMed] [Google Scholar]
- 8.Winship KA. Toxicity of tin and its compounds. Adverse Drug React. Acute Poison. Rev. 1988;7:19–38. [PubMed] [Google Scholar]
- 9.Lan H, Wen Y, Shi Y, Liu K, Mao Y, Yi T. Fluorescence turn-on detection of Sn2+ in live eukaryotic and prokaryotic cells. Analyst. 2014;139:5223–5229. doi: 10.1039/C4AN01014K. [DOI] [PubMed] [Google Scholar]
- 10.Cardarelli N. Tin and the thymus gland: A review. Thymus. 1990;15:223–231. [PubMed] [Google Scholar]
- 11.Sherman LR, Masters J, Peterson R, Levine S. Tin concentration in the thymus glands of rats and mice and its relation to the involution of the gland. J. Anal. Toxicol. 1986;10(1):6–9. doi: 10.1093/jat/10.1.6. [DOI] [PubMed] [Google Scholar]
- 12.Viau CM, Cardone JM, Guecheva TN, Yoneama ML, Dias JF, Sousa FG, Pungartnik C, Brendel M, Henriques JA. SnCl2-induced DNA damage and repair inhibition of MMS-caused lesions in V79 Chinese hamster fibroblasts. Arch. Toxicol. 2009;83:769–775. doi: 10.1007/s00204-009-0409-z. [DOI] [PubMed] [Google Scholar]
- 13.Jianqiang W, Mengyuan L, Zhiwei W, Man Z, Changqing G, Cheng G. Highly sensitive and selective fluorescent detection of rare earth metal Sn (II) ion by organic fluorine Schiff base functionalized periodic mesoporous material in aqueous solution. J. Photochem. Photobiol. A. 2015;309:37–46. doi: 10.1016/j.jphotochem.2015.04.020. [DOI] [Google Scholar]
- 14.Christison TT, Rohrer JS. Direct determination of free cyanide in drinking water by ion chromatography with pulsed amperometric detection. J. Chromatogr. A. 2007;1155:31–39. doi: 10.1016/j.chroma.2007.02.083. [DOI] [PubMed] [Google Scholar]
- 15.Dabeka RW, McKenzie AD, Albert RH. Atomic absorption spectrophotometric determination of tin in canned foods, using nitric acid-hydrochloric acid digestion and nitrous oxide-acetylene flame: Collaborative study. J. Assoc. Off. Anal. Chem. 1985;68:209–213. [PubMed] [Google Scholar]
- 16.Safavi A, Maleki N, Shahbaazi HR. Indirect determination of cyanide ion and hydrogen cyanide by adsorptive stripping voltammetry at a mercury electrode. Anal. Chim. Acta. 2004;503:213–221. doi: 10.1016/j.aca.2003.10.032. [DOI] [Google Scholar]
- 17.Boutakhrit K, Yang ZP, Kauffmann JM. Inorganic tin(II) determination by FIA with amperometric detection of its oxinate complex. Talanta. 1995;20:1883–1890. doi: 10.1016/0039-9140(95)01650-3. [DOI] [PubMed] [Google Scholar]
- 18.Themelis DG, Karastogiann SC, Tzanavaras PD. Selective determination of cyanides by gas diffusion-stopped flow-sequential injection analysis and an on-line standard addition approach. Anal. Chim. Acta. 2009;632:93–100. doi: 10.1016/j.aca.2008.10.074. [DOI] [PubMed] [Google Scholar]
- 19.Heppeler F, Sander S, Henze G. Determination of tin traces in water samples by adsorptive stripping voltammetry. Anal. Chim. Acta. 1996;319:19–24. doi: 10.1016/0003-2670(95)00480-7. [DOI] [Google Scholar]
- 20.Ichinoki S, Iwase H, Arakawa F, Hirano K, Fujii Y. Selective determination of tin(II) ion in water by solventextraction with salicylidenamino-2-thiophenol followed byreversed-phase highperformance liquid chromatographywith photometric detection. J. Liq. Chromatogr. Relat. Technol. 2003;26:3129–3139. doi: 10.1081/JLC-120025429. [DOI] [Google Scholar]
- 21.Kundu S, Sahoo P. Estimation of hydrogen sulfide from crude petroleum: A unique invention using a simple chemosensor. New J. Chem. 2019;43:12369–12374. doi: 10.1039/C9NJ02628B. [DOI] [Google Scholar]
- 22.Kundu S, Sarkar HS, Das S, Sahoo P. Easy and rapid estimation of ammonia in cold-storage potatoes: Precautions in the environment. New J. Chem. 2019;43:6843–6847. doi: 10.1039/C9NJ00954J. [DOI] [Google Scholar]
- 23.Sarkar HS, Kundu S, Das S, Maiti PK, Mandal S, Sahoo P. 2’-Deoxy-5-(hydroxymethyl) cytidine: Estimation in human cancer cells with a simple chemosensor. RSC Adv. 2018;8:39893–39896. doi: 10.1039/C8RA08391F. [DOI] [PMC free article] [PubMed] [Google Scholar]
- 24.Ghosh A, Das S, Kundu S, Maiti PK, Sahoo P. Rapid estimation of lead in lipsticks. Sens. Actuators B Chem. 2018;266:80–85. doi: 10.1016/j.snb.2018.03.105. [DOI] [Google Scholar]
- 25.Kundu S, Maiti PK, Sahoo P. A multi-signaling performance for simultaneous surveillance and accretion of cysteine and serine in human cancer cell. Asian J. Org. Chem. 2020;9:94–98. doi: 10.1002/ajoc.201900642. [DOI] [Google Scholar]
- 26.Kundu S, Saha S, Sahoo P. Rapid and selective visual detection of DCNP (nerve gas mimic) in sea water and soil with a simple paper strip. Results Chem. 2019;1:100014. doi: 10.1016/j.rechem.2019.100014. [DOI] [Google Scholar]
- 27.Ghosh A, Das S, Sarkar HS, Kundu S, Sahoo P. Consumption of H2S from our daily diet: Determination by a simple chemosensing method. ACS Omega. 2018;3:11617–11623. doi: 10.1021/acsomega.8b01751. [DOI] [PMC free article] [PubMed] [Google Scholar]
- 28.Das S, Ghosh A, Kundu S, Saha S, Sarkar HS, Sahoo P. Development of a new fluorescent probe for detection of cysteine in processed food samples. Anal. Bioanal. Chem. 2019 doi: 10.1007/s00216-019-02012-9. [DOI] [PubMed] [Google Scholar]
- 29.Das S, Sahoo P. A colorimetric sensor for hydrogen sulfide: Detection from biogas and quantitative estimation in water. Sens. Actuators B Chem. 2019 doi: 10.1016/j.snb.2019.04.089. [DOI] [Google Scholar]
- 30.Chunwei Y, Jun Z, Jinhua L, Ping L, Peihai W, Lingxin C. Fluorescent probe for copper(II) ion based on a rhodamine spirolactame derivative, and its application to fluorescent imaging in living cells. Microchim. Acta. 2011;174:247–255. doi: 10.1007/s00604-011-0623-2. [DOI] [Google Scholar]
- 31.Das S, Sarkar HS, Uddin MR, Mandal S, Sahoo P. A chemosensor to recognize N-acyl homoserine lactone in bacterial biofilm. Sens. Actuators B Chem. 2018;259:332–338. doi: 10.1016/j.snb.2017.12.040. [DOI] [Google Scholar]
- 32.Frisch MJ, Trucks GW, Schlegel HB, Scuseria GE, Robb MA, Cheeseman JR, Scalmani G, Barone V, Mennucci B, Petersson GA, Nakatsuji H, Caricato M, Li X, Hratchian HP, Izmaylov AF, Bloino J, Zheng G, Sonnenberg JL, Hada M, Ehara M, Toyota K, Fukuda R, Hasegawa J, Ishida M, Nakajima T, Honda Y, Kitao O, Nakai H, Vreven T, Jr, Montgomery JA, Peralta JE, Ogliaro F, Bearpark M, Heyd JJ, Brothers E, Kudin KN, Staroverov VN, Kobayashi R, Normand J, Raghavachari K, Rendell A, Burant JC, Iyengar SS, Tomasi J, Cossi M, Rega N, Millam JM, Klene M, Knox JE, Cross JB, Bakken V, Adamo C, Jaramillo J, Gomperts R, Stratmann RE, Yazyev O, Austin AJ, Cammi R, Pomelli C, Ochterski JW, Martin RL, Morokuma K, Zakrzewski VG, Voth GA, Salvador P, Dannenberg JJ, Dapprich S, Daniels AD, Farkas O, Foresman JB, Ortiz JV, Cioslowski J, Fox DJ. Gaussian 09, Revision A 0.2. Gaussian Inc.; 2009. [Google Scholar]
- 33.Popovic Z, Pavlovic G, Roje V, Doslic N, Calogovic DM, Leban I. Nitroaniline derivatives of 2-Oxo-1-naphthylideneamines— Molecular self-assembling via C—H· · ·O intermolecular hydrogen bonds and stabilization of O—H· · ·N and N—H· · ·O tautomers in solution and solid state. Struct. Chem. 2004;15:6. doi: 10.1007/s11224-004-0734-z. [DOI] [Google Scholar]
- 34.Kargılı H, Agar AA, Alpaslan G, Buyukgungora O, Erdonmeza A. 1-{(Z)-[2-Methoxy-5-(trifluoromethyl) anilino]methylidene}naphthalen-2(1H)- one. Acta Cryst. 2013;E69:163. [Google Scholar]
- 35.Rigaku Oxford Diffraction . CrysAlis Pro software system, version 3846. Rigaku Corporation; 2017. [Google Scholar]
- 36.Sheldrick GM. A short history of ShelX. Acta Cryst. 2008;A64:112–122. doi: 10.1107/S0108767307043930. [DOI] [PubMed] [Google Scholar]
- 37.Sheldrick GM. SHELXL13. University of Göttingen; 2013. [Google Scholar]
- 38.Sheldrick GM. Crystal structure refinement with ShelXL. Acta Cryst. 2015;C71:3–8. doi: 10.1107/S2053229614024218. [DOI] [PMC free article] [PubMed] [Google Scholar]
Associated Data
This section collects any data citations, data availability statements, or supplementary materials included in this article.


