

Abstract
Objective:
To estimate the prevalence of mild cognitive impairment (MCI) and its subtypes and investigate the impact of midlife cardiovascular risk factors on late-life MCI among the aging Mexican population.
Method:
Analyses included a sample of non-demented adults over the age of 55 living in both urban and rural areas of Mexico (N = 1807). MCI diagnosis was assigned based on a comprehensive cognitive assessment assessing the domains of memory, executive functioning, language, and visuospatial ability. The normative sample was selected by means of the robust norms approach. Cognitive impairment was defined by a 1.5-SD cut-off per cognitive domain using normative corrections for age, years of education, and sex. Risk factors included age, education, sex, rurality, depression, insurance status, workforce status, hypertension, diabetes, stroke, and heart disease.
Results:
The prevalence of amnestic MCI was 5.9%. Other MCI subtypes ranged from 4.2% to 7.7%. MCI with and without memory impairment was associated with older age (OR = 1.01 [1.01, 1.05]; OR = 1.03 [1.01, 1.04], respectively) and residing in rural areas (OR = 1.49 [1.08, 2.06]; OR = 1.35 [1.03, 1.77], respectively). Depression (OR = 1.07 [1.02, 1.12]), diabetes (OR = 1.37 [1.03, 1.82]), and years of education (OR = 0.94 [0.91, 0.97]) were associated with MCI without memory impairment. Midlife CVD increased the odds of MCI in late-life (OR = 1.76 [1.19, 2.59], which was driven by both midlife hypertension and diabetes (OR = 1.70 [1.18, 2.44]; OR = 1.88 [1.19, 2.97], respectively).
Conclusions:
Older age, depression, low education, rurality, and midlife hypertension and diabetes were associated with higher risk of late-life MCI among older adults in Mexico. Our findings suggest that the causes of cognitive impairment are multifactorial and vary by MCI subtype.
Keywords: Mild cognitive impairment, Cognitive aging, Neuropsychology, Mex-Cog, Mexican population, MHAS
INTRODUCTION
By 2050, two-thirds of older individuals with dementia will live in low- and middle-income countries (LMICs) (Patterson, 2018). As LMICs continue to experience a reduction in mortality and improved healthcare access, it is critical to understand the factors that can increase dementia risk, such as identifying those with mild cognitive impairment (MCI) (Mathers & Loncar, 2006; Murray & Lopez, 1997).
Most widely used approaches to diagnose MCI in clinical trials (Stephan et al., 2013) and population-based studies (Sosa et al., 2012) rely on limited neuropsychological assessment, use a single test to define cognitive impairment, and self-reported memory complaints. Compared to conventional “one-test” diagnostic approaches, using a full range of neuropsychological measures with actuarial decision-making to classify MCI was associated with less likelihood of reversal to cognitively normal status, reduced false-positive diagnoses, incident dementia, and with Alzheimer’s disease (AD) biomarkers (Bondi et al., 2014; Edmonds et al., 2015). Evaluating MCI prevalence with a neuropsychological approach can help identify individuals at greater risk for dementia and improve our understanding of the sociodemographic and health factors associated with MCI in LMICs.
Studies have used different diagnostic criteria to estimate the prevalence of MCI among Mexican adults. Our group reported a 25% prevalence for cognitive impairment with no dementia (CIND) using a brief cognitive screening test (the Cross-Cultural Cognitive Examination (Mejia-Arango & Gutierrez, 2011; Mejía-Arango, Miguel-Jaimes, Villa, Ruiz-Arregui, & Gutiérrez-Robledo, 2007)). The 10/66 Dementia Research Group (Prince et al., 2007) reported a prevalence of 3.2% for the amnestic subtype of MCI using a brief cognitive assessment (Sosa et al., 2012). With a comprehensive neuropsychological evaluation, Juarez-Cedillo and colleagues estimated MCI prevalence at 6.45%. However, the study relied on a single test per cognitive domain to diagnose MCI, and the study’s sample was not representative of the general Mexican population as they were primarily insurance beneficiaries living in Mexico City. To understand the prevalence and correlates of MCI across the aging Mexican population, a large and representative sample of older adults is needed.
Moreover, while accurately identifying MCI will aid in detecting those at greater risk of dementia, midlife vascular factors can increase risk of MCI in late-life. For instance, hypertension and diabetes in midlife are associated with late-life cognitive impairment (Kivipelto et al., 2001; Launer et al., 2000). To date, it is unclear how midlife vascular factors relate to risk of cognitive impairment among the aging Mexican population.
The Mexican Health and Aging Study (MHAS) started in 2001, with a nationally representative sample of Mexican adults aged ≥50, designed to prospectively evaluate the impact of disease on health, function, and mortality (Wong, Michaels-Obregon, & Palloni, 2015). In 2016, MHAS launched an Ancillary Study on Cognitive Aging in Mexico (Mex-Cog) among a representative sub-sample of MHAS participants (Mejia-Arango et al., 2020) with the primary goal to expand the knowledge about cognitive aging in Mexico through a comprehensive cognitive assessment. The Mex-Cog study provides a unique opportunity to estimate MCI in a large sample of Mexican adults with over 15 years of follow-up.
The primary goals of the current study are (i) to define diagnostic criteria for MCI in an elderly Mexican population using an actuarial neuropsychological approach, (ii) to establish the prevalence of MCI in late-life, (iii) to evaluate the association between MCI and sociodemographic factors, and (iv) to evaluate the role of midlife vascular risk factors and other health factors on MCI in late-life.
METHODS
Participants
Mex-Cog participants were a subsample of those who participated in the 2015 wave of MHAS. Full study procedures and descriptions for MHAS have previously been reported (Wong et al., 2015) and are highly comparable to the U.S. Health and Retirement Study (Sonnega et al., 2014). Mex-Cog participants were 55 years and older, selected from eight different Mexican states using stratified sampling procedures. The eight states were selected to represent the national population using strata of states according to the following criteria: socioeconomic (percent urban/rural, number of residents who are former migrants to the United States) and health exposures (percent with obesity, diabetes, mine industry, and pottery industry). Overall, 2042 participants were administered the Mex-Cog assessment. The study was approved by the Institutional Review Boards of the University of Texas Medical Branch in the United States and the National Institute of Public Health and the National Institute of Statistics and Geography in Mexico. The research was completed in accordance with the Helsinki Declaration.
The Mex-Cog study administers a harmonized cognitive assessment protocol currently used by other ongoing population-based longitudinal studies of aging around the world (Langa et al., 2020). As per Mex-Cog protocols (Mejia-Arango et al., 2020), participants who scored ≤10 on a modified version of the Mini-Mental State Examination (MMSE) (Mex-Cog, 2018) (n = 102) were considered severely impaired and were not administered the full cognitive battery, and therefore excluded from the analysis sample. Additional exclusion criteria included missing demographic (n = 17) or neuropsychological data (n = 23), and dementia classification at their MHAS 2015 visit (n = 93). The sample for the prevalence analyses included 1807 participants (89% of the initial sample). Figure 1 shows the flow chart for the sample’s selection criteria. To evaluate the association of midlife vascular factors and late-life MCI, we evaluated a subsample of participants who were in midlife at their MHAS 2001 visit (aged <65 years, n = 758). Data on sociodemographic information (i.e., locality, workforce status, healthcare availability, depressive symptoms) and an informant interview were collected for all participants.
Fig. 1.
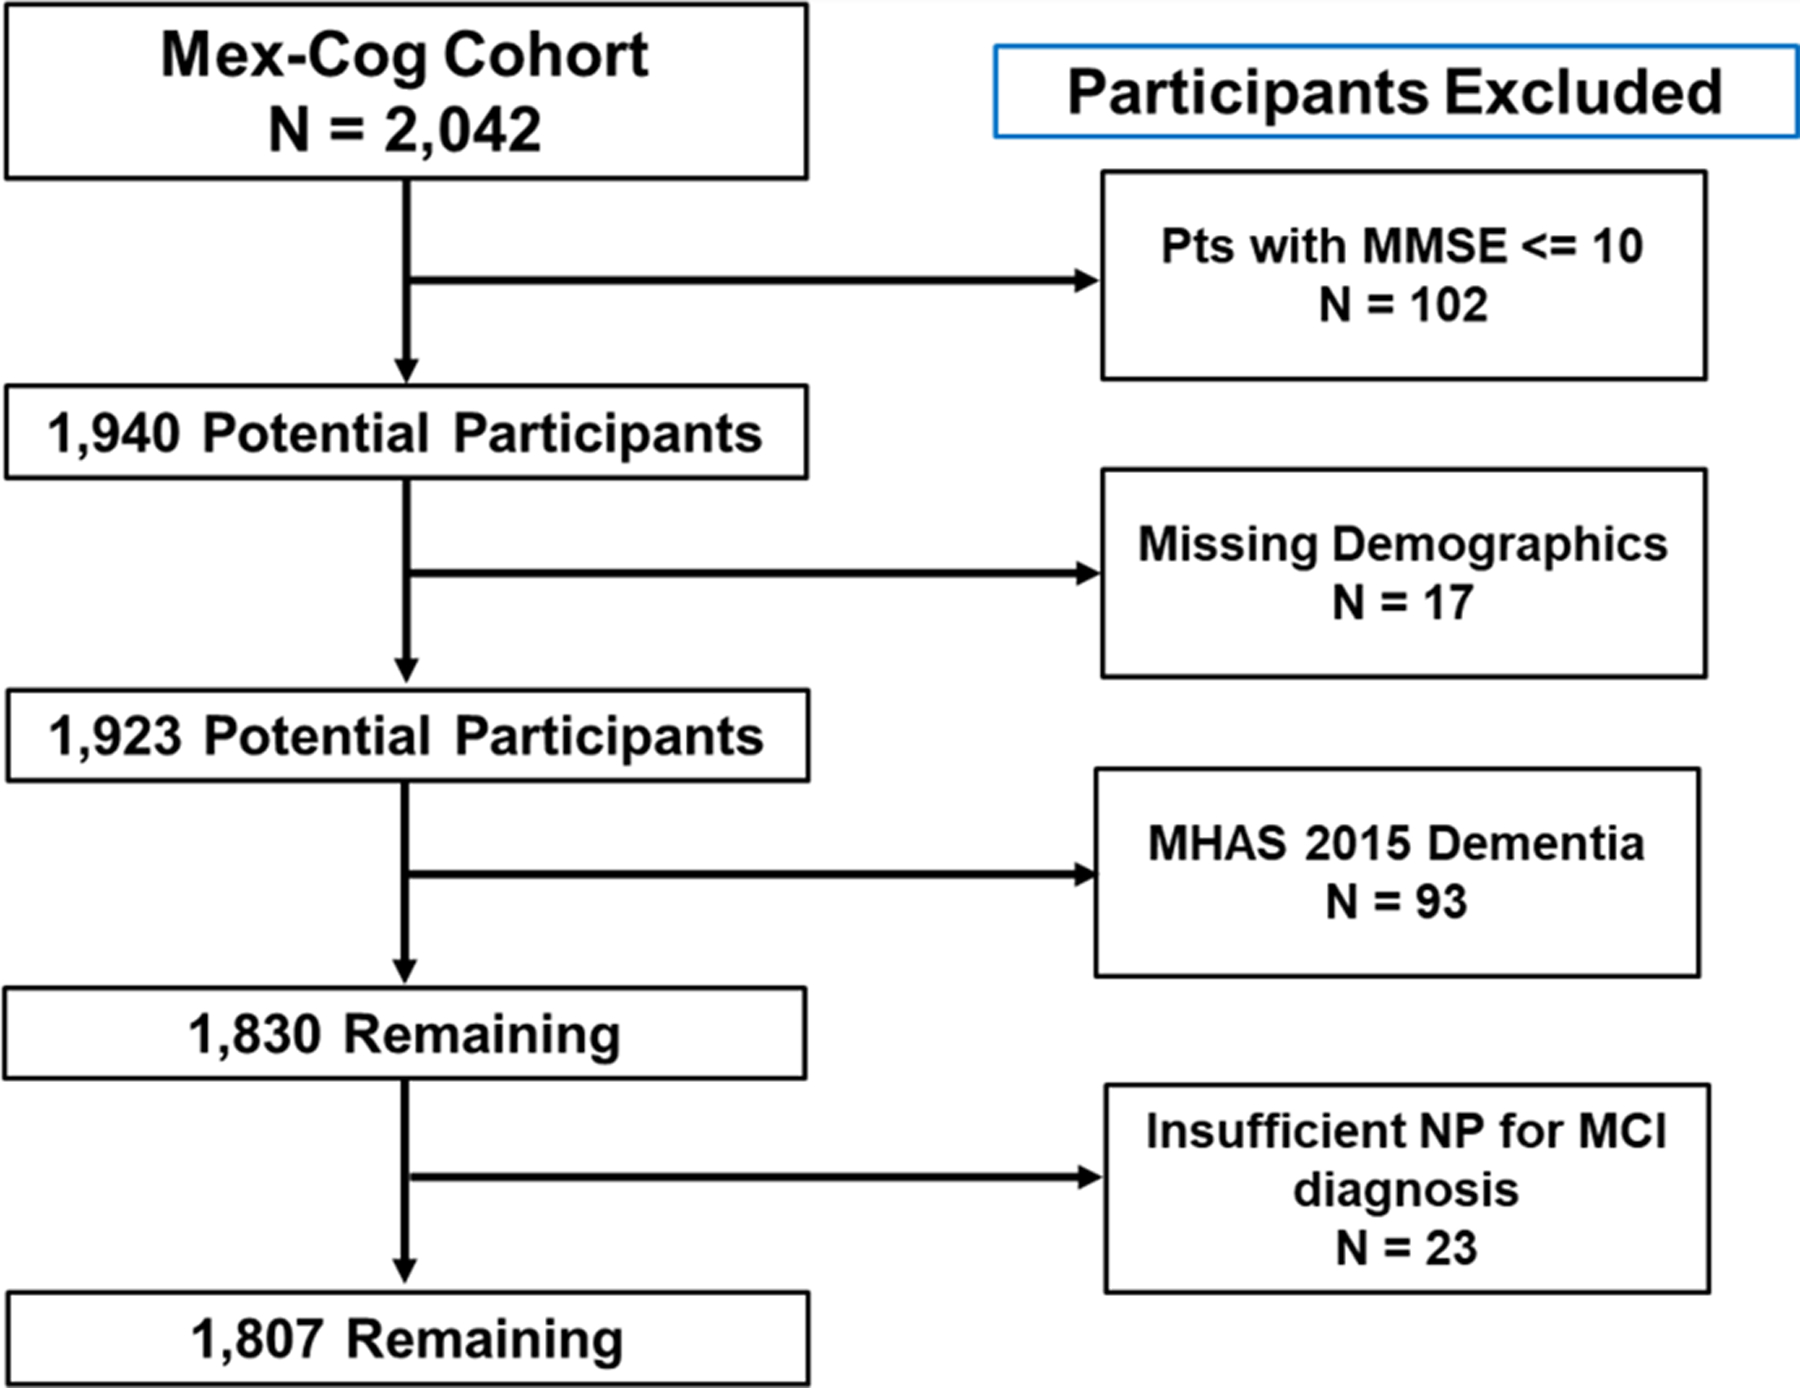
Flow diagram for identifying participants for the current sample. Note. MMSE = Mini-Mental Status Examination; NP = Neuropsychological Data; MCI = Mild Cognitive Impairment.
Cognitive Assessment
Participants completed a comprehensive cognitive assessment evaluating various cognitive domains such as memory, language, visuospatial function, and executive functioning (Table 1). Information regarding the selection process of the items that were included in the Mex-Cog cognitive battery can be found in their published protocols (Mejia-Arango et al., 2020). In brief, cognitive tests were selected based on their suitability for in-home application by trained interviewers, for their potential to be culturally adapted for rural and low-educated populations in Mexico, and to maximize harmonization with the Health and Retirement Study/Harmonized Cognitive Assessment Protocol study. All test scores were standardized using the mean and standard deviation from the entire sample. Within each cognitive domain, composite scores were calculated by averaging the z-scores. A confirmatory factor analysis indicated that this 4-factor structure model demonstrated good fit (X2 = 925.399, df = 142; root mean square error of approximation (RMSEA) = .05; comparative fit index (CFI) = .95; Tucker-Lewis index (TLI) = .94; standardized root mean square residual (SRMR) = .04).
Table 1.
Mex-Cog cognitive battery
| Cognitive domain | Neuropsychological tests |
|---|---|
| Memory |
|
| Language |
|
| Visuospatial Function |
|
| Executive Function |
|
Cardiovascular Health Factors
Cardiovascular diseases (CVD) were self-reported dichotomous variables for hypertension, diabetes, heart disease, and stroke. Participants were asked if a doctor or medical professional ever told them they had any of the aforementioned diseases. These vascular factors were obtained at each MHAS visit. For the midlife subsample, we defined the presence or absence of each individual disease in 3 categories: (1) “none” if they denied the disease in both 2001 and 2012, (2) “late-life disease” if a disease was denied in 2001 but endorsed in 2012, and (3) “midlife disease” if a disease was endorsed since 2001. Similarly, we created an overall CVD category that represented presence of 1 or more diseases in either midlife, late-life, or none at all.
Sociodemographic Factors
The MHAS 2015 visit collected data on locality, i.e., whether the participant resides in urban or rural areas based on community population density cut points using standard values used by INEGI. Locality was categorized into: (1) 100,000+ residents, (2) between 15,000 and 99,999 residents, (3) between 2500 and 14,999 residents, and (4) <2500 residents. For the current study, we dichotomized locality in urban areas (≥100,000 population size) versus all other groups. Current workforce status was ascertained by self-report (unemployed, retired, or employed). Health care availability was defined as whether participants have access or not to health insurance (governmental or private). Participants also answered questions regarding depressive symptoms using a modified version of the Center for Epidemiologic Studies Depression Scale (Aguilar-Navarro, Fuentes-Cantú, Avila-Funes, & García-Mayo, 2007). Participants were categorized as having elevated depressive symptoms based on previously established cut-offs (≥5) (Aguilar-Navarro et al., 2007).
Informant Interview
The Mex-Cog protocol included an interview with someone familiar with the behavior and health of the participant, most frequently a spouse, an adult child, or a caregiver. The Mex-Cog informant instrument included 28 items from the Community Screening Interview for Dementia (Hall et al., 1993) that asks about the participant’s performance in everyday living, and an adapted version of the History and Aethiology Scale (Dewey & Copeland, 2001) to assess history of cognitive decline. Greater detail on the informant interview can be found on the Mex-Cog methodological document (Mejia-Arango et al., 2020; Mex-Cog, 2018).
Regression-Based Neuropsychological Test Norms
To determine cut-off for cognitive impairment, we selected a normative sample. Developing relevant normative data is critical because the use of appropriate norms improves diagnostic and descriptive accuracy (Busch & Chapin, 2008). To define our normative sample, we used a robust norms approach. An ideal robust norms approach would include participants who do not develop dementia over time. However, due to the lack of follow-up cognitive data for Mex-Cog participants, we used the informant report to infer absence of clinically significant cognitive decline. The normative sample excluded participants who met criteria for impairment in their MHAS 2015 visit (i.e., CIND, dementia), reported stroke, severe depressive symptoms, and those with significant cognitive decline according to the informant’s report. Significant cognitive decline was operationalized as the informant endorsing any of the following items on the Community Screening Interview for Dementia measure: (1) regularly forgets names of family members; (2) regularly uses wrong words; (3) regularly forgets when they last saw informant; (4) forgets what happened the day before; (5) forgets where he/she is; (6) gets lost in their own neighborhood; (7) gets lost at home; (8) change in the ability to think and reason; (9) mistook a family member with another person; or (10) reasoning is confusing or illogical. We also excluded participants whose informant endorsed functional decline that could likely be attributable to significant cognitive decline or depression, such as endorsing either (1) stopped doing activities or hobbies or (2) change in the ability to handle money. A total of 547 participants were selected as the normative sample.
A regression-based approach was used to develop demographically corrected T-scores (Heaton, Miller, Taylor, & Grant, 2004; Manly et al., 2005). Multiple linear regression analyses evaluated the influence of age, sex, and education on each of the cognitive domains using the normative sample. We then used the resulting beta coefficients and standard error of each regression model to calculate predicted scores for each cognitive composite (i.e., expected scores based on the participant’s age, sex, and education) across the entire sample (N = 1830). A residual score was calculated by then subtracting each participant’s predicted composite score from their actual composite score. Last, residual scores were converted to T-scores according to the following formula: T-score = [(Residual Score/SE of Estimate for the Regression Equation) × 10] + 50.
MCI Neuropsychological Classification
Participants were classified as MCI following an actuarial neuropsychological approach (Bondi et al., 2014; Jak et al., 2009). Participants were classified as MCI if a composite cognitive domain score was ≥1.5 SD below demographically corrected T-scores (T-score ≤35). We deviated from prior published actuarial neuropsychological approaches in two ways. First, we chose to use composite domain scores instead of individual test scores given previous studies indicating that composite domain scores provide greater stability when measuring cognition over time (Jonaitis et al., 2019). However, we did require that composite domain scores be composed of at least 2 cognitive tests per domain. Last, we applied a more conservative approach to defining cognitive impairment by using a ≥ 1.5 SD cut-off instead of ≥1.0 SD. This ≥1.5 SD criterion was decided given that we developed our own norms, and the study was not designed to create a normative sample. In addition, by using a ≥1.5 SD criterion, we wanted to maximize sensitivity in identifying individuals who when classified as MCI may be more likely to develop dementia over time. Future studies can evaluate different impairment cut-offs and its ability to predict longitudinal cognitive change.
Mutually exclusive MCI subtypes were determined as follows. Single-domain MCI (i.e., MCI-amnestic, MCI-language, MCI-dysexecutive, MCI-visuospatial) was assigned if impairment was demonstrated on the corresponding cognitive domain, while performance on all other domains was within normal limits. Multiple domain amnestic MCI was made if there was impairment on the memory domain and on ≥1 cognitive domains. Multiple domain non-amnestic MCI was assigned if there was impairment in two or more of the non-memory domains, while the memory composite score was within normal limits. Last, given that prior studies indicate that MCI with memory impairment is associated with a faster decline in daily functioning (Thomas et al., 2020), greater differences in pattern of cortical thinning (Edmonds et al., 2016), and has a stronger association with AD biomarkers (Bangen et al., 2016), we dichotomized participants as either MCI with or without memory impairment, regardless of single- or multiple-domain classification as done in previous studies (Manly et al., 2005; Matallana et al., 2011).
Statistical Analyses
MCI prevalence and 95% confidence intervals (95% CI) were calculated for the overall sample (N = 1807) and stratified by age (median split 66), years of education (median split 6), and sex. We assumed a Poisson distribution when determining the 95%CI for the prevalence. Chi-square tests evaluated the relationship of each MCI subtype by age, years of education, and sex. Multinomial logistic regressions evaluated the independent association between MCI with and without memory impairment and sociodemographic and health factors.
In the subsample of participants in midlife enrolled since MHAS 2001 (n = 758), we ran several models to test the independent association between mid and late-life CVD and MCI. First, we ran a logistic regression with MCI (yes/no) as the outcome and the overall mid to late-life CVD variable as a predictor. Then, secondary models evaluated each individual mid to late-life CVD variable (hypertension, diabetes, heart disease, stroke) as predictors with MCI as the outcome. All models included age, years of education, sex, and locality as covariates. Third, we included a multiplicative interaction term between overall CVD and either education or rurality with global MCI as the outcome. Last, we ran a final logistic regression that evaluated the independent association between mid and late-life CVDs, sociodemographic factors (age, years of education, sex, rurality, depression, insurance status, and workforce status) and MCI. A 2-sided p value of less than .05 was used as the cut-off for statistical significance. Descriptive statistics were conducted in SPSS 26. Logistic and multinomial logistic regressions were conducted in R.
RESULTS
A total of 1807 participants were included in the prevalence analytic sample (1064 [59%] women; mean [SD] age, 67 [8] years, mean [SD] education, 6 [5] years; Table 2). The sub-sample of participants who were enrolled since 2001 (n = 758) had an average age of 57 ± 4 years in 2001 and of 71 ± 4 years in 2015, 57% (n = 433) were female, and mean education level of 5 ± 4 years (Supplemental Materials Table 1). The normative sample was on average 66 years of age (SD = 7.8, range 54–97 years), with an average of 7 years of education (SD = 4.9, range 0–19 years), and 59% women.
Table 2.
Mex-Cog participant characteristics stratified by MCI diagnosis (N = 1807)
| All (N = 1807) | non-MCI (n = 1185) | MCI with memory impairment (n = 235) | MCI without memory impairment (n = 387) | p-Value | |
|---|---|---|---|---|---|
| Age; mean (SD) | 67.2 (8.4) | 66.4 (7.9) | 68.6 (9.7) | 68.7 (8.7) | <0.001 |
| Education; avg (SD) | 5.7 (4.5) | 6.2 (4.31) | 5.43 (4.7) | 4.2 (4.5) | <0.001 |
| Sex | |||||
| Women; % (n) | 58.9 (1,064) | 57.6 (682) | 63.8 (150) | 59.9 (232) | 0.181 |
| Depressive symptoms | |||||
| CESD; avg (SD) | 3.7 (2.7) | 3.5 (2.7) | 3.9 (2.5) | 4.3 (2.7) | <0.001 |
| Rurality; % (n) | <0.001 | ||||
| 100,000+ | 57.9 (1,046) | 61.6 (730) | 52.8 (124) | 49.6 (192) | |
| 99,999–15,000 | 14.7 (266) | 14.9 (177) | 11.1 (26) | 16.3 (63) | |
| 14,999–2500 | 8.4 (152) | 7.6 (90) | 10.2 (24) | 9.8 (38) | |
| <2500 | 19.0 (343) | 15.9 (188) | 26.0 (61) | 24.3 (94) | |
| Insured; % (n) | 91.0 (1,643) | 91.3 (1,080) | 91.1 (214) | 90.2 (349) | 0.802 |
| Employment status | 0.001 | ||||
| Employed; % (n) | 35.7 (645) | 37.1 (439) | 27.8 (65) | 36.4 (141) | |
| Retired; % (n) | 16.2 (292) | 17.9 (212) | 14.5 (34) | 11.9 (46) | |
| Unemployed; % (n) | 48.1 (868) | 45.0 (533) | 57.7 (135) | 51.7 (200) | |
| Medical conditions | |||||
| Hypertension; % (n) | 47.3 (854) | 47.4 (562) | 46.6 (109) | 47.4 (183) | 0.972 |
| Diabetes; % (n) | 26.6 (481) | 25.5 (302) | 24.8 (58) | 31.3 (121) | 0.065 |
| Heart disease; % (n) | 9.3 (167) | 10.2 (120) | 6.0 (14) | 8.7 (33) | 0.117 |
| Stroke; % (n) | 2.3 (41) | 1.9 (23) | 1.7 (4) | 3.6 (14) | 0.130 |
| Mid-Late Life Conditions* | 0.022 | ||||
| No diseases; % (n) | 35.6 (270) | 37.9 (195) | 31.6 (24) | 30.4 (51) | |
| Late-life (>65 yr); % (n) | 24.5 (186) | 25.9 (133) | 17.1 (13) | 23.8 (40) | |
| Midlife (<65 yr); % (n) | 39.8 (302) | 36.2 (186) | 51.3 (39) | 45.8 (77) | |
CESD = Center for Epidemiologic Studies Depression Scale;
evaluated among the subsample of participants enrolled since the MHAS baseline survey 2001 (n = 758).
Across 1807 participants, 13% (n = 235) met criteria for MCI with memory impairment and 21% (n = 379) for MCI without memory impairment. Compared with non-MCI individuals, MCI participants with and without memory impairment were older, had fewer years of education, endorsed more depressive symptoms, were more likely to live in a rural setting, and more likely to be unemployed.
Prevalence of MCI
Table 3 describes the prevalence of MCI and its subtypes stratified by age, education, and sex. Across the entire sample, the prevalence of MCI subtypes ranged from 4.2% with MCI-dysexecutive to 7.7% with MCI-visuospatial. The frequency of overall MCI was higher among those older than 66 years of age (X2 = 8.48, p = .004) and among those with less education (X2 = 34.64, p < .001). Across MCI subtypes, participants who were older were more likely to have isolated deficits in visuospatial abilities (X2 = 4.10, p = .043) and multiple-domain amnestic MCI (X2 = 4.56, p = .033). Less-educated participants were more likely to have isolated deficits in language (X2 = 8.38, p = .004), visuospatial abilities (X2 = 14.33, p < .001), executive functioning (X2 = 7.35, p = .007), multiple-domain amnestic MCI (X2 = 13.31, p < .001), and non-amnestic multiple-domain MCI (X2 = 21.93, p < .001). Women were more likely to have non-amnestic multiple-domain MCI than men (X2 = 5.15, p = .023).
Table 3.
Prevalence of MCI stratified by its subtypes
| Factor | Any MCI (n = 622) | Amnestic (n = 107) | Language (n = 78) | Visuospatial (n = 139) | Executive (n = 75) | MCDM (n = 128) | MCDN (n = 95) |
|---|---|---|---|---|---|---|---|
| Overall | 34.4 (31.70–37.10) | 5.9 (4.78–7.02) | 4.3 (3.46–5.25) | 7.7 (6.42–8.98) | 4.2 (3.25–.15) | 7.1 (5.87–8.33) | 5.3 (4.23–6.37) |
| Age group | |||||||
| ≤66 | 31.2 (27.60–34.80) | 8.2 (6.07–10.33) | 5.5 (3.73–7.27) | 8.9 (6.68–11.12) | 5.1 (3.39–6.81) | 8.1 (5.98–10.22) | 6.3 (4.42–8.18) |
| >66 | 37.8 (33.74–41.86) | 8.3 (6.00–10.60) | 6.9 (4.79–9.01) | 12.3 (9.55–15.05) | 6.9 (4.79–9.01) | 11.6 (8.92–14.28) | 8.7 (6.34–11.06) |
| Education | |||||||
| ≤6 years | 38.7 (35.29–42.11) | 7.7 (5.83–9.57) | 7.5 (5.66–9.34) | 12.7 (10.37–15.03) | 7.2 (5.39–9.01) | 11.8 (9.54–14.06) | 9.8 (7.72–11.88) |
| >6 years | 24.2 (20.01–28.39) | 9.5 (6.63–12.37) | 3.4 (1.62–5.18) | 5.9 (3.59–8.21) | 3.4 (1.62–5.18) | 5.4 (3.19–7.61) | 2.4 (0.91–3.89) |
| Sex | |||||||
| Men | 32.3 (28.21–36.39) | 7.4 (5.11–9.69) | 5.8 (3.76–7.84) | 11.9 (9.07—14.73) | 5.1 (3.18–7.02) | 8.2 (5.80–10.59) | 5.5 (3.50–7.50) |
| Women | 35.9 (32.30–39.50) | 8.9 (6.77—11.03) | 6.4 (4.57–8.23) | 9.4 (7.21–11.59) | 6.6 (4.73–8.47) | 10.8 (8.48–13.12) | 8.8 (6.68–10.92) |
MCI = mild cognitive impairment; MCDM = multiple domains with memory impairment; MCDN = multiple domains without memory impairment.
Note. Values represent % (95% confidence intervals).
Sociodemographic and Health Factors and MCI
Results of the multinomial logistic regression (Table 4) showed that older age and residing in a rural setting were independently associated with increased prevalence of MCI with memory impairment. MCI without memory impairment was independently associated with older age, less education, rurality, higher prevalence of depression, and history of diabetes. Being retired compared with being employed was associated with MCI without memory impairment. Of note, descriptive analyses reveal that retired participants were better educated [M(SD) = 8.32(5.24)] compared to employed [M(SD) = 6.05(4.61)] and unemployed participants [M (SD) = 4.48(3.59); F(2,1804) = 92.43, p < .001]. History of heart disease was associated with lower prevalence of MCI with and without memory impairment. Sex, stroke, hypertension, and insurance were not associated with prevalence of MCI with or without memory impairment.
Table 4.
Multinomial logistic regression predicting MCI status
| 95% CI for OR | ||||
|---|---|---|---|---|
| B (SE) | OR | Lower | Upper | |
| MCI-Memory vs Unimpaired | ||||
| Age | 0.03 (.01) | 1.03** | 1.01 | 1.05 |
| Education | 0.02 (.02) | 1.02 | 0.98 | 1.06 |
| Sex | 0.19 (.18) | 1.21 | 0.85 | 1.74 |
| Rurality | 0.40 (.16) | 1.49* | 1.08 | 2.06 |
| Depressive symptoms | 0.05 (.03) | 1.05 | 0.99 | 1.12 |
| Medical conditions | ||||
| Stroke | 0.08 (.56) | 1.08 | 0.36 | 3.21 |
| Hypertension | −0.10 (.16) | 0.91 | 0.66 | 1.24 |
| Diabetes | −0.07 (.18) | 0.93 | 0.65 | 1.33 |
| Heart disease | −0.62 (.31) | 0.54* | 0.29 | 0.99 |
| Insurance status | 0.08 (.26) | 1.08 | 0.65 | 1.82 |
| Employment status | ||||
| Retired | −0.03 (.26) | 0.97 | 0.59 | 1.61 |
| Unemployed | −0.14 (.20) | 1.33 | 0.90 | 1.96 |
| MCI–Non–Memory vs Unimpaired | ||||
| Age | 0.02 (.01) | 1.03** | 1.01 | 1.04 |
| Education | −0.06 (.02) | 0.94*** | 0.91 | 0.97 |
| Sex | 0.01 (.15) | 1.01 | 0.75 | 1.36 |
| Rurality | 0.30 (.14) | 1.35* | 1.03 | 1.77 |
| Depressive symptoms | 0.07 (.03) | 1.07** | 1.02 | 1.12 |
| Medical conditions | ||||
| Stroke | 0.61 (.38) | 1.84 | 0.88 | 3.85 |
| Hypertension | −0.15 (.14) | 0.86 | 0.66 | 1.12 |
| Diabetes | 0.31 (.14) | 1.37* | 1.03 | 1.82 |
| Heart disease | −0.49 (.23) | 0.61* | 0.38 | 0.98 |
| Insurance status | −0.07 (.23) | 0.93 | 0.60 | 1.45 |
| Employment status | ||||
| Retired | −0.47 (.22) | 0.63* | 0.40 | 0.97 |
| Unemployed | −0.14 (.16) | 0.87 | 0.64 | 1.19 |
MCI, mild cognitive impairment.
Note. Age and education were mean centered; male sex, urban setting, absence of medical condition, being insured, and employed were the reference groups;
p < .001,
p < .01,
p < .05.
Mid and Late-Life CVD and MCI
Results of the logistic regression showed that overall CVD in midlife was associated with greater odds of MCI (OR = 1.74 [1.20, 2.51]), whereas CVD in late-life was not reliably associated with MCI (OR = 1.05 [0.69, 1.60]). When evaluating the role of mid and late-life presence of each individual disease on the likelihood of MCI, both hypertension and diabetes in midlife were associated with greater risk of MCI (OR = 1.70 [1.18, 2.44]; OR = 1.88 [1.19, 2.97], respectively). Neither hypertension (OR = 1.07 [0.70, 1.62]) or diabetes in late-life (OR = 1.39 [0.89, 2.17]) were associated with MCI. While heart disease in midlife was not associated with MCI (OR = 0.82 [0.28, 2.42]), heart disease in late-life was negatively associated with MCI (OR = 0.24 [0.71, 0.80]). Mid- or late-life presence of stroke was not independently associated with MCI (all p’s > .05). There was no interaction between overall CVD and education or rurality (all p’s > .10). Last, in the fully adjusted models, midlife CVD increased the odds of MCI in late-life (OR = 1.76 [1.19, 2.59], while late-life CVD did not reliably increase greater odds (OR = 1.11 [0.71, 1.71]). In addition, depressive symptoms increased risk of MCI, while female sex and being retired were associated with lower odds of MCI. Table 5 displays the results of the fully adjusted logistic regressions.
Table 5.
Multiple logistic regression predicting MCI status (n = 758)
| 95% CI for OR | ||||
|---|---|---|---|---|
| B (SE) | OR | Lower | Upper | |
| Age | 0.02 (.02) | 1.02 | 0.97 | 1.06 |
| Education | −0.04 (.02) | 0.96 | 0.91 | 1.00 |
| Sex | −0.39 (.19) | 0.67* | 0.45 | 0.99 |
| Rurality | 0.15 (.18) | 1.15 | 0.82 | 1.63 |
| Depressive symptoms | 0.08 (.03) | 1.08* | 1.01 | 1.15 |
| Insurance status | 0.09 (.30) | 1.09 | 0.59 | 1.98 |
| Employment status | ||||
| Retired | −0.86 (.26) | 042*** | 0.25 | 0.69 |
| Unemployed | −0.13 (.21) | 0.87 | 0.58 | 1.32 |
| Medical conditions | ||||
| Late-Life diseases | 0.10 (22) | 1.10 | 0.71 | 1.71 |
| Midlife diseases | 0.56 (19) | 1.75** | 1.19 | 2.59 |
MCI = mild cognitive impairment.
Note. Age and education were mean centered; male sex, urban setting, no depression, absence of medical condition, being insured, and employed were the reference groups;
p < .001,
p < .01,
p < .05.
DISCUSSION
MCI is a long-recognized risk factor for dementia (Albert et al., 2011); therefore, estimating MCI prevalence and its associated sociodemographic and health factors is critical. Using comprehensive cognitive data from a cohort of older adults in Mexico, the prevalence of MCI was estimated as 13% and 21% for MCI with and without memory impairment, respectively.
Population-based estimates of MCI prevalence are highly variable, ranging from 3% to 42% for any type of MCI, and 0.5% to 31.9% for amnestic MCI (Ward, Arrighi, Michels, & Cedarbaum, 2012). In the Mexican population, the estimates of MCI prevalence are also highly variable, most likely due to the differences in MCI criteria and characteristics of the specific samples evaluated. Previous work with the 2001 wave of MHAS reported prevalence estimates for CIND of 25% (Mejia-Arango & Gutierrez, 2011). Several methodological differences may explain the discrepancy in MCI estimates. In the 2001 MHAS study (Mejia-Arango & Gutierrez, 2011), the criteria for MCI relied on a cognitive screener, the Cross-Cultural Cognitive Examination, while for the current study, we used the Mex-Cog. Relying on a cognitive screener may lead to a greater overestimation of cognitive impairment because of its coarse measurement and inability to assess impairment by cognitive domain (Heaton et al., 2004; Ranson et al., 2019; Saxton et al., 2009).
The 10/66 Dementia Research Group reported a prevalence rate of 3.2% for amnestic MCI among a diverse sample of older Mexicans (Sosa et al., 2012), while our study found a higher estimate (5.9%). A key methodological difference was that the 10/66 research group relied on the Petersen criteria (Petersen & Morris, 2005), which incorporates memory complaints in the diagnostic criteria. When we included memory complaints, meaning that the diagnostic criteria were more restrictive by requiring participants to demonstrate both cognitive impairment and self-report memory complaints, the prevalence of amnestic MCI in our sample decreased to 2.2%.
Juarez-Cedillo et al. reported a prevalence rate for MCI among older healthcare beneficiaries residing in Mexico City of 0.3% for multiple-domain non-amnestic MCI and 2.6% for multiple-domain amnestic MCI (Juarez-Cedillo et al., 2012). While participants in the Juarez-Cedillo study (Juarez-Cedillo et al., 2012) were evaluated with a comprehensive cognitive assessment, it was heavily weighted on memory assessment, and it was unclear which other domains were evaluated, and whether they included memory complaints in their diagnostic criteria. In addition, most of the normative standards for their cognitive instruments were derived from non-Mexican Spanish-speaking populations (i.e., the Syndrom–Kurztest was validated among elderly Chileans) (Fornazzari et al., 2001), which can limit the reliability to detect cognitive impairment. Last, all participants were residing in Mexico City and had access to healthcare through the Mexican Social Security Institute (IMSS), which provides health insurance to workers in the formal labor market. In contrast, almost half (42%) of the participants in our study resided in less populated settings, and only 54% reported receiving their healthcare through the IMSS.
CVD burden in midlife was associated with greater odds of MCI. By leveraging the over 15-year follow-up of MHAS, we were able to evaluate whether the presence of CVD in mid- and late-life increased risk of MCI. Hypertension and diabetes in midlife were uniquely associated with greater likelihood of MCI in late-life. These results are in line with prior work that has identified midlife vascular risk factors as important modifiable risk factors for late-life cognitive decline and dementia (Whitmer, Sidney, Selby, Johnston, & Yaffe, 2005), and association of these factors with increased vascular brain injury (Debette et al., 2011) and elevated brain amyloid deposition in late-life (Gottesman et al., 2017). Our results also suggest that the effects of midlife cardiovascular factors are not modified by years of education or rurality. It may be that the impact of CVD in midlife on late-life cognition is strong regardless of one’s sociodemographic background. To our knowledge, this is the first study to evaluate midlife vascular risk factors and risk of cognitive impairment among Mexican adults residing in rural and urban areas. These results add important information to the cognitive health of Mexican adults, given the high prevalence of vascular risk factors such as hypertension and diabetes.
While hypertension and diabetes were associated with greater odds of MCI, in line with prior studies among older Mexican adults (Downer, Kumar, Mehta, Al Snih, & Wong, 2016; Mejía-Arango & Zúñiga-Gil, 2011), heart failure was associated with a reduced odds of cognitive impairment. There are a few possible explanations for this counterintuitive finding. First, cross-sectional studies examining the association between heart disease and cognitive impairment have yielded inconsistent results. A potential reason is the complexity of assessing the entire spectrum of heart disease such that frequently only heart disease severe enough to result in a cardiac event such as a myocardial infarction is investigated (Aronson et al., 1990; Breteler, Claus, Grobbee, & Hofman, 1994; Bursi et al., 2005). Consequently, subjects with severe heart disease who are not surgical candidates, and those with less severe heart disease (e.g., stable angina), may not be included in studies assessing the association of heart disease with cognitive impairment (Roberts et al., 2010). In addition, since study participants with heart disease were more likely to be insured (7.9% vs. 2.5%, p = 0.010), it is possible that non-MCI participants are more likely to have greater access and utilization of healthcare services (Ton et al., 2017) and therefore show higher prevalence of diagnosed heart disease. Moreover, the self-reported nature of heart disease may contribute to spurious associations. As such, these results highlight the need for future studies to adequately evaluate the full spectrum of heart disease throughout the life course and as it relates to access to and utilization of healthcare.
As previously reported, older age, fewer years of education, and greater depressive symptoms were associated with MCI. Studies of the Mexican population have reported the association between age, education, depression, and cognitive impairment (Juarez-Cedillo et al., 2012; Mejia-Arango & Gutierrez, 2011; Sachdev et al., 2015). Results of studies evaluating the impact of sex on the risk of MCI have been conflicting: some reported higher risk of MCI among women (Juarez-Cedillo et al., 2012; Mejia-Arango & Gutierrez, 2011), others among men (Petersen et al., 2010), others found no differences (Di Carlo et al., 2002). In our study, we did not find sex differences in risk of MCI. Finally, our results showed that retirees were less likely to have MCI compared to those employed. When compared with the unemployment group, the retired group appeared to be better educated. It is possible that higher educational attainment and other socioeconomic factors contribute to the lower prevalence of MCI among retirees.
A strength of the study was the use of an actuarial neuropsychological approach to defining MCI. Different MCI subtypes are associated with unique brain-behavior traits. For instance, amnestic MCI is associated with greater cortical thinning of temporal structures (Clark et al., 2013), while MCI with deficits in executive functioning is associated with white matter lesions (Delano-Wood et al., 2009). Similarly, MCI diagnoses derived with a neuropsychological approach when compared to MCI classifications using traditional criteria (i.e., Petersen et al.) were more likely over time to remain as MCI or progress to dementia, less likely to be reclassified as cognitively normal, more likely to be APOE-4 carriers and demonstrate abnormal cerebrospinal fluid AD-biomarker levels (Bondi et al., 2014). Future studies will be needed that include biomarkers.
Several limitations deserve mention. First, further work is warranted to characterize the current cognitive assessment and determine its measurement invariance by examining whether it measures the same cognitive constructs across different subpopulations (e.g., sex/gender, educational gradients) (Avila et al., 2020; Horn & McArdle, 1992). Second, due to the lack of follow-up data for Mex-Cog participants, we relied on informant report to determine both clinically significant cognitive and functional decline and were unable to evaluate the incidence of MCI and dementia (Sliwinski, Lipton, Buschke, & Stewart, 1996). Third, due to the lack of a clinical diagnosis of dementia or detailed information on instrumental activities of daily living at the Mex-Cog visit, participants classified as MCI may very well meet criteria for clinical diagnosis of dementia.
Understanding the prevalence and factors associated with MCI can help elucidate the determinants of MCI and subsequent dementia in order to inform research and policy for preventative strategies. Establishing a protocol to define MCI using a neuropsychological approach across large studies of health and aging may improve our understanding of cognitive health among LMICs such as Mexico.
Supplementary Material
ACKNOWLEDGMENTS
The authors would like to acknowledge Dr. Nicole Schupf for her valuable input on the development of the manuscript.
FINANCIAL SUPPORT
This research was completed with funding from the NIA/NIH (grant R56-AG059756, R01 AG 051158, 1K99AG066932), and support from the WHO/Collaborating Center on Aging and Health at the University of Texas Medical Branch (UTMB). The MHAS is funded by the NIA/NIH (grant R01 AG018016) and the Instituto Nacional de Estadística y Geografia (INEGI) in Mexico.
Footnotes
SUPPLEMENTARY MATERIAL
To view supplementary material for this article, please visit https://doi.org/10.1017/S1355617721000539
CONFLICT OF INTEREST
The authors have nothing to disclose.
PUBLICATION HISTORY
This manuscript was previously published in MedRxiv: https://doi.org/10.1101/2020.01.03.20016345.
DATA AVAILABLILITY STATEMENT
Data requests can be submitted online at http://www.mhasweb.org/.
REFERENCES
- Aguilar-Navarro SG, Fuentes-Cantú A, Avila-Funes JA, & García-Mayo EJ (2007). Validity and reliability of the screening questionnaire for geriatric depression used in the Mexican Health and Age Study. Salud publica de Mexico, 49(4), 256–262. [DOI] [PubMed] [Google Scholar]
- Albert MS, DeKosky ST, Dickson D, Dubois B, Feldman HH, Fox NC, … Petersen RC (2011). The diagnosis of mild cognitive impairment due to Alzheimer’s disease: Recommendations from the National Institute on Aging-Alzheimer’s Association workgroups on diagnostic guidelines for Alzheimer’s disease. Alzheimer’s & Dementia, 7(3), 270–279. [DOI] [PMC free article] [PubMed] [Google Scholar]
- Aronson M, Ooi W, Morgenstern H, Hafner A, Masur D, Crystal H, … Katzman R (1990). Women, myocardial infarction, and dementia in the very old. Neurology, 40(7), 1102–1102. [DOI] [PubMed] [Google Scholar]
- Avila JF, Rentería MA, Witkiewitz K, Verney SP, Vonk JM, & Manly JJ (2020). Measurement invariance of neuropsychological measures of cognitive aging across race/ethnicity by sex/gender groups. Neuropsychology, 34(1), 3. [DOI] [PMC free article] [PubMed] [Google Scholar]
- Bangen KJ, Clark AL, Werhane M, Edmonds EC, Nation DA, Evangelista N, … Delano-Wood L (2016). Cortical amyloid burden differences across empirically-derived mild cognitive impairment subtypes and interaction with APOE ε4 geno-type. Journal of Alzheimer’s Disease, 52(3), 849–861. [DOI] [PMC free article] [PubMed] [Google Scholar]
- Bondi MW, Edmonds EC, Jak AJ, Clark LR, Delano-Wood L, McDonald CR, … Galasko D (2014). Neuropsychological criteria for mild cognitive impairment improves diagnostic precision, biomarker associations, and progression rates. Journal of Alzheimer’s Disease, 42(1), 275–289. [DOI] [PMC free article] [PubMed] [Google Scholar]
- Breteler MM, Claus JJ, Grobbee DE, & Hofman A (1994). Cardiovascular disease and distribution of cognitive function in elderly people: the Rotterdam Study. BMJ, 308(6944), 1604–1608. [DOI] [PMC free article] [PubMed] [Google Scholar]
- Bursi F, Rocca WA, Killian JM, Weston SA, Knopman DS, Jacobsen SJ, & Roger VL (2005). Heart disease and dementia: a population-based study. American Journal of Epidemiology, 163(2), 135–141. [DOI] [PubMed] [Google Scholar]
- Busch RM, & Chapin JS (2008). Review of normative data for common screening measures used to evaluate cognitive functioning in elderly individuals. The Clinical Neuropsychologist, 22(4), 620–650. [DOI] [PubMed] [Google Scholar]
- Clark LR, Delano-Wood L, Libon DJ, McDonald CR, Nation DA, Bangen KJ, … Bondi MW (2013). Are empirically-derived subtypes of mild cognitive impairment consistent with conventional subtypes? Journal of the International Neuropsychological Society, 19(6), 635–645. [DOI] [PMC free article] [PubMed] [Google Scholar]
- IBM Corp. Released 2019. IBM SPSS Statistics for Macintosh, Version 26.0 Armonk, NY: IBM Corp. [Google Scholar]
- Debette S, Seshadri S, Beiser A, Au R, Himali J, Palumbo C, … DeCarli C (2011). Midlife vascular risk factor exposure accelerates structural brain aging and cognitive decline. Neurology, 77(5), 461–468. [DOI] [PMC free article] [PubMed] [Google Scholar]
- Delano-Wood L, Bondi MW, Sacco J, Abeles N, Jak AJ, Libon DJ, & Bozoki A (2009). Heterogeneity in mild cognitive impairment: Differences in neuropsychological profile and associated white matter lesion pathology. Journal of the International Neuropsychological Society, 15(6), 906–914. [DOI] [PMC free article] [PubMed] [Google Scholar]
- Dewey ME, & Copeland JR (2001). Diagnosis of dementia from the history and aetiology schedule. International journal of geriatric psychiatry, 16(9), 912–917. [DOI] [PubMed] [Google Scholar]
- Di Carlo A, Baldereschi M, Amaducci L, Lepore V, Bracco L, Maggi S, … Farchi G (2002). Incidence of dementia, Alzheimer’s disease, and vascular dementia in Italy. The ILSA Study. Journal of the American Geriatrics Society, 50(1), 41–48. [DOI] [PubMed] [Google Scholar]
- Downer B, Kumar A, Mehta H, Al Snih S, & Wong R (2016). The effect of undiagnosed diabetes on the association between self-reported diabetes and cognitive impairment among older Mexican adults. American Journal of Alzheimer’s Disease & Other Dementias®, 31(7), 564–569. [DOI] [PMC free article] [PubMed] [Google Scholar]
- Edmonds EC, Delano-Wood L, Clark LR, Jak AJ, Nation DA, McDonald CR, … Salmon DP (2015). Susceptibility of the conventional criteria for mild cognitive impairment to false-positive diagnostic errors. Alzheimer’s & Dementia, 11(4), 415–424. [DOI] [PMC free article] [PubMed] [Google Scholar]
- Edmonds EC, Eppig J, Bondi MW, Leyden KM, Goodwin B, Delano-Wood L, … Initiative ASDN (2016). Heterogeneous cortical atrophy patterns in MCI not captured by conventional diagnostic criteria. Neurology, 87(20), 2108–2116. [DOI] [PMC free article] [PubMed] [Google Scholar]
- Fornazzari L, Cumsille F, Quevedo F, Quiroga P, Rioseco P, Klaasen G, … Rivera E (2001). Spanish validation of the Syndrom Kurztest (SKT). Alzheimer Disease & Associated Disorders, 15(4), 211–215. [DOI] [PubMed] [Google Scholar]
- Gottesman RF, Schneider AL, Zhou Y, Coresh J, Green E, Gupta N, … Sharrett AR (2017). Association between midlife vascular risk factors and estimated brain amyloid deposition. Jama, 317(14), 1443–1450. [DOI] [PMC free article] [PubMed] [Google Scholar]
- Hall K, Hendrie H, Brittain H, Norton J, Rodgers D, Prince C, … Nath A (1993). The development of a dementia screening interview in 2 distinct languages. International Journal of Methods in Psychiatric Research, 3(1), 1–28. [Google Scholar]
- Heaton RK, Miller SW, Taylor MJ, & Grant I (2004). Revised comprehensive norms for an expanded Halstead-Reitan Battery: demographically adjusted neuropsychological norms for African American and Caucasian adults. Lutz, FL: Psychological Assessment Resources. [Google Scholar]
- Horn JL, & McArdle JJ (1992). A practical and theoretical guide to measurement invariance in aging research. Experimental Aging Research, 18(3), 117–144. [DOI] [PubMed] [Google Scholar]
- Jak AJ, Bondi MW, Delano-Wood L, Wierenga C, Corey-Bloom J, Salmon DP, & Delis DC (2009). Quantification of five neuropsychological approaches to defining mild cognitive impairment. The American Journal of Geriatric Psychiatry, 17(5), 368–375. [DOI] [PMC free article] [PubMed] [Google Scholar]
- Jonaitis EM, Koscik RL, Clark LR, Ma Y, Betthauser TJ, Berman SE, … Van Hulle CA (2019). Measuring longitudinal cognition: Individual tests versus composites. Alzheimer’s & Dementia: Diagnosis, Assessment & Disease Monitoring, 11, 74–84. [DOI] [PMC free article] [PubMed] [Google Scholar]
- Juarez-Cedillo T, Sanchez-Arenas R, Sanchez-Garcia S, Garcia-Pena C, Hsiung G-YR, Sepehry AA, … Jacova C (2012). Prevalence of mild cognitive impairment and its subtypes in the Mexican population. Dementia and Geriatric Cognitive Disorders, 34(5–6), 271–281. [DOI] [PubMed] [Google Scholar]
- Kivipelto M, Helkala E-L, Hänninen T, Laakso MP, Hallikainen M, Alhainen K, … Nissinen A (2001). Midlife vascular risk factors and late-life mild cognitive impairment: a population-based study. Neurology, 56(12), 1683–1689. [DOI] [PubMed] [Google Scholar]
- Langa KM, Ryan LH, McCammon RJ, Jones RN, Manly JJ, Levine DA, … Weir DR (2020). The health and retirement study harmonized cognitive assessment protocol project: Study design and methods. Neuroepidemiology, 54, 1–11. [DOI] [PMC free article] [PubMed] [Google Scholar]
- Launer LJ, Ross GW, Petrovitch H, Masaki K, Foley D, White LR, & Havlik RJ (2000). Midlife blood pressure and dementia: the Honolulu–Asia aging study☆. Neurobiology of Aging, 21(1), 49–55. [DOI] [PubMed] [Google Scholar]
- Manly JJ, Bell-McGinty S, Tang M-X, Schupf N, Stern Y, & Mayeux R (2005). Implementing diagnostic criteria and estimating frequency of mild cognitive impairment in an urban community. Archives of neurology, 62(11), 1739–1746. [DOI] [PubMed] [Google Scholar]
- Matallana D, De Santacruz C, Cano C, Reyes P, Samper-Ternent R, Markides KS, … Reyes-Ortiz CA (2011). The relationship between education level and mini-mental state examination domains among older Mexican Americans. Journal of Geriatric Psychiatry and Neurology, 24(1), 9–18. [DOI] [PMC free article] [PubMed] [Google Scholar]
- Mathers CD, & Loncar D (2006). Projections of global mortality and burden of disease from 2002 to 2030. PLoS Medicine, 3(11), e442. [DOI] [PMC free article] [PubMed] [Google Scholar]
- Mejia-Arango S, & Gutierrez LM (2011). Prevalence and incidence rates of dementia and cognitive impairment no dementia in the Mexican population: data from the Mexican Health and Aging Study. Journal of Aging and Health, 23(7), 1050–1074. [DOI] [PMC free article] [PubMed] [Google Scholar]
- Mejía-Arango S, Miguel-Jaimes A, Villa A, Ruiz-Arregui L, & Gutiérrez-Robledo LM (2007). Cognitive impairment and associated factors in older adults in Mexico. Salud publica de Mexico, 49(S4), 475–481. [DOI] [PubMed] [Google Scholar]
- Mejia-Arango S, Nevarez R, Michaels-Obregon A, Trejo B, Mendoza-Alvarado L, Sosa-Ortiz AL, … Wong R (2020). The Mexican Cognitive Aging Ancillary Study (Mex-Cog): study design and methods. Archives of Gerontology and Geriatrics, 104210. [DOI] [PMC free article] [PubMed] [Google Scholar]
- Mejía-Arango S, & Zúñiga-Gil C (2011). Diabetes mellitus as a risk factor for dementia in the Mexican elder population. Revista de neurologia, 53(7), 397–405. [PMC free article] [PubMed] [Google Scholar]
- Mex-Cog. (2018). Study on Cognitive Aging Linked to MHAS: Methodological Document, Version 1, November 2018. Retrieved 09/25/2019
- Murray CJ, & Lopez AD (1997). Alternative projections of mortality and disability by cause 1990–2020: Global Burden of Disease Study. The Lancet, 349(9064), 1498–1504. [DOI] [PubMed] [Google Scholar]
- Patterson C (2018). World Alzheimer Report 2018. The state of the art of dementia research: New frontiers London: Alzheimer’s Dis Int. [Google Scholar]
- Petersen RC, & Morris JC (2005). Mild cognitive impairment as a clinical entity and treatment target. Archives of Neurology, 62(7), 1160–1163. [DOI] [PubMed] [Google Scholar]
- Petersen RC, Roberts RO, Knopman DS, Geda YE, Cha RH, Pankratz V, … Rocca WA (2010). Prevalence of mild cognitive impairment is higher in men: The Mayo Clinic Study of Aging. Neurology, 75(10), 889–897. [DOI] [PMC free article] [PubMed] [Google Scholar]
- Prince M, Ferri CP, Acosta D, Albanese E, Arizaga R, Dewey M, … Jacob K (2007). The protocols for the 10/66 dementia research group population-based research programme. BMC Public Health, 7(1), 165. [DOI] [PMC free article] [PubMed] [Google Scholar]
- Ranson JM, Kuźma E, Hamilton W, Muniz-Terrera G, Langa KM, & Llewellyn DJ (2019). Predictors of dementia misclassification when using brief cognitive assessments. Neurology: Clinical Practice, 9(2), 109–117. [DOI] [PMC free article] [PubMed] [Google Scholar]
- Roberts RO, Knopman DS, Geda YE, Cha RH, Roger VL, & Petersen RC (2010). Coronary heart disease is associated with non-amnestic mild cognitive impairment. Neurobiology of Aging, 31(11), 1894–1902. [DOI] [PMC free article] [PubMed] [Google Scholar]
- Sachdev PS, Lipnicki DM, Kochan NA, Crawford JD, Thalamuthu A, Andrews G, … Lipton RB (2015). The prevalence of mild cognitive impairment in diverse geographical and ethnocultural regions: the COSMIC collaboration. PloS one, 10(11), e0142388. [DOI] [PMC free article] [PubMed] [Google Scholar]
- Saxton J, Snitz BE, Lopez OL, Ives DG, Dunn LO, Fitzpatrick A, … Investigators GS (2009). Functional and cognitive criteria produce different rates of mild cognitive impairment and conversion to dementia. Journal of Neurology, Neurosurgery & Psychiatry, 80(7), 737–743. [DOI] [PMC free article] [PubMed] [Google Scholar]
- Sliwinski M, Lipton RB, Buschke H, & Stewart W (1996). The effects of preclinical dementia on estimates of normal cognitive functioning in aging. The Journals of Gerontology Series B: Psychological Sciences and Social Sciences, 51(4), P217–P225. [DOI] [PubMed] [Google Scholar]
- Sonnega A, Faul JD, Ofstedal MB, Langa KM, Phillips JW, & Weir DR (2014). Cohort profile: the health and retirement study (HRS). International Journal of Epidemiology, 43(2), 576–585. [DOI] [PMC free article] [PubMed] [Google Scholar]
- Sosa AL, Albanese E, Stephan BC, Dewey M, Acosta D, Ferri CP, … Jimenez-Velazquez IZ (2012). Prevalence, distribution, and impact of mild cognitive impairment in Latin America, China, and India: a 10/66 population-based study. PLoS medicine, 9(2), e1001170. [DOI] [PMC free article] [PubMed] [Google Scholar]
- Stephan BCM, Minett T, Pagett E, Siervo M, Brayne C, & McKeith IG (2013). Diagnosing Mild Cognitive Impairment (MCI) in clinical trials: a systematic review. BMJ Open, 3(2), e001909. [DOI] [PMC free article] [PubMed] [Google Scholar]
- Team, R. (2018). RStudio: Integrated Development for R. Boston, MA: Retrieved from http://www.rstudio.com/. [Google Scholar]
- Thomas KR, Cook SE, Bondi MW, Unverzagt FW, Gross AL, Willis SL, & Marsiske M (2020). Application of neuropsychological criteria to classify mild cognitive impairment in the active study. Neuropsychology, 34(8), 862. [DOI] [PMC free article] [PubMed] [Google Scholar]
- Ton TG, DeLeire T, May SG, Hou N, Tebeka MG, Chen E, & Chodosh J (2017). The financial burden and health care utilization patterns associated with amnestic mild cognitive impairment. Alzheimer’s & Dementia, 13(3), 217–224. [DOI] [PubMed] [Google Scholar]
- Ward A, Arrighi HM, Michels S, & Cedarbaum JM (2012). Mild cognitive impairment: disparity of incidence and prevalence estimates. Alzheimer’s & Dementia, 8(1), 14–21. [DOI] [PubMed] [Google Scholar]
- Whitmer RA, Sidney S, Selby J, Johnston SC, & Yaffe K (2005). Midlife cardiovascular risk factors and risk of dementia in late life. Neurology, 64(2), 277–281. [DOI] [PubMed] [Google Scholar]
- Wong R, Michaels-Obregon A, & Palloni A (2015). Cohort profile: the Mexican health and aging study (MHAS). International Journal of Epidemiology, 46(2), e2–e2. [DOI] [PMC free article] [PubMed] [Google Scholar]
Associated Data
This section collects any data citations, data availability statements, or supplementary materials included in this article.
Supplementary Materials
Data Availability Statement
Data requests can be submitted online at http://www.mhasweb.org/.