Figure 6.
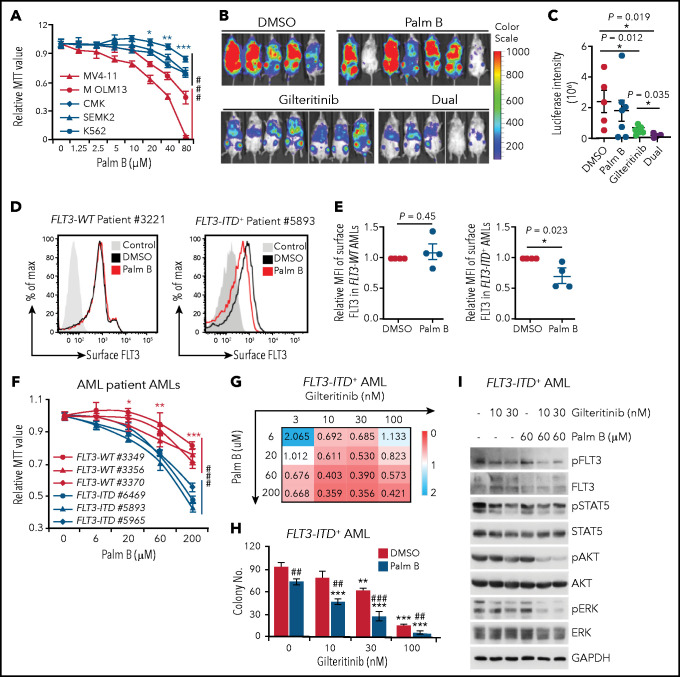
Depalmitoylation inhibitor synergizes with gilteritinib in restraining FLT3-ITD–mediated signaling and leukemia cell growth. (A) Cell growth curves of different leukemia cell lines in a graded dose of the depalmitoylation inhibitor palm B. Cells were grown in triplicate for 3 days; relative MTT values are shown. MV4;11: FLT3-ITD homozygous; MOLM13: FLT3-ITD heterozygous; CMK and SEMK2: FLT3-WT; K562: FLT3−. (B) MV4;11 cells were pretreated with DMSO, 60 μM palm B alone, 2 nM gilteritinib alone, or dual drugs for 6 hours, followed by xenotransplantation into sublethally irradiated NSG mice. Bioluminescence imaging at 2 weeks after xenograft is shown. (C) Quantification of bioluminescence signals as in panel B. DMSO (n = 5), palm B alone (n = 7), gilteritinib alone (n = 7), or dual drugs (n = 5). (D) Representative flow cytometric plots of surface FLT3 levels in FLT3-WT and FLT3-ITD+ AMLs, with or without 60 μM palm B treatment. (E) Quantification of surface FLT3 level as in panel D. FLT3-WT (n = 4) and FLT3-ITD+ patients with AML (n = 4). (F) Primary FLT3-WT and FLT3-ITD+ AML cells were grown in triplicate for 3 days in media containing graded concentrations of palm B. Cell growth was examined by MTT assay. (G) Primary FLT3-ITD+ AML cells were grown in triplicate for 3 days in the presence of various concentrations of palm B or gilteritinib, followed by MTT analysis. Drug synergy scoring calculated by CompuSyn software is shown. CI<1, synergism; CI = 1, additive effect; CI>1, antagonism. (H) Colony numbers of primary FLT3-ITD+ AML cells plated in triplicate in various concentrations of gilteritinib in the presence or absence of palm B. (I) Examination of FLT3-ITD downstream signaling in primary FLT3-ITD+ AML cells treated with the indicated doses of palm B, gilteritinib, or dual drugs. (A,F) Data in are presented as means ± SD. Statistics of the FLT3-WT and FLT3-ITD+ groups in panels A and F were first examined by 2-way analysis of variance (###P < .001), followed by Bonferroni post hoc tests for individual doses. *P < .05; **P < .01; ***P < .001. (C,E) Data are presented as means ± standard error of the mean. (C,E) Each symbol represents an individual mouse or patient AML sample. (H) Data are presented as means ± standard deviation. (H) *Comparison of different concentrations of gilteritinib to 0 nM gilteritinib in the respective DMSO or palm B group. #Comparison of the DMSO and palm B groups in the presence of the same concentration of gilteritinib. In all relevant panels, * ,** or ##P < .01; *** or ###P < .001, as determined by 2-tailed Student t test. CI, combination index; MTT, 3-[4,5-dimethylthiazol-2-yl]-2,5-diphenyltetrazolium bromide.

