

Abstract
Brain age is a neuroimaging-based biomarker of aging. This study examined whether the difference between brain age and chronological age (brain-PAD) is associated with cognitive function at baseline and longitudinally. Participants were relatively healthy, predominantly white community-dwelling older adults (n = 531, aged ≥70 years), with high educational attainment (61% ≥12 years) and socioeconomic status (59% ≥75th percentile). Brain age was estimated from T1-weighted magnetic resonance images using an algorithm by Cole et al., 2018.
After controlling for age, gender, education, depression and body mass index, brain-PAD was negatively associated with psychomotor speed (Symbol Digit Modalities Test) at baseline (Bonferroni p < 0.006), but was not associated with baseline verbal fluency (Controlled Oral Word Association Test), delayed recall (Hopkins Learning Test Revised), or general cognitive status (Mini-Mental State Examination). Baseline brain-PAD was not associated with 3-year change in cognition (Bonferroni p > 0.006).
These findings indicate that even in relatively healthy older people, accelerated brain aging is associated with worse psychomotor speed, but future longitudinal research into changes in brain-PAD is needed.
Keywords: Estimated brain age, Brain aging, Predicted age difference, Neuroimaging, Magnetic resonance imaging, Cognitive function
1. Introduction
Aging is an inevitable biological process characterized by an accumulation of cell and tissue damage over the lifespan (Lopez-Otin et al., 2013). The inability to repair this damage subsequently impairs normal physiological functions (Lopez-Otin et al., 2013). The brain is particularly sensitive to the effects of aging, which manifest as changes in brain structure and associated cognitive functions (Oschwald et al., 2019). Neuroimaging has made it possible to view these changes in vivo. The most commonly reported age-related brain changes include cortical atrophy (i.e., a loss of brain tissue volume) (Grajauskas et al., 2019) and the decline in white matter integrity and connectivity (Coelho et al., 2021; Damoiseaux, 2017).
Age-related changes in the brain have a wide range of neurocognitive consequences. This includes a decline in domain-specific cognitive functions, such as memory, processing speed, and verbal fluency (Armstrong et al., 2020; Ritchie et al., 2015). Cognitive decline is a key symptom of dementia, which is a major cause of disability and loss of independence among older people worldwide (Organization, 2019; Tucker-Drob, 2019). Biological brain aging and associated changes in cognitive functioning, however, are highly heterogeneous among the population. While some people will retain brain tissue volume and high cognitive proficiency throughout life (so called “super agers”), another subgroup will experience earlier and more severe cortical atrophy and cognitive decline (so-called “accelerated agers”). As such, chronological age alone is a poor marker of cognitive function and risk of decline (Tucker-Drob, 2019).
In order to provide a more individually-relevant measure of overall brain health, increasing attention has been paid to the development of neuroimaging-based biomarkers that reflect a person’s “brain age,” as distinct from their chronological age. An older brain age, relative to chronological age is considered a sign of accelerated brain aging (i.e., greater age-related changes to the brain, such as cortical atrophy); while a lower brain age suggests decelerated brain aging (i.e., fewer age-related changes, and thus, preserved brain tissue). A number of different models have been developed and validated for estimation of brain age from structural magnetic resonance imaging (MRI) data (Dinsdale et al., 2021; Franke et al., 2010; Kaufmann et al., 2019; Liem et al., 2017), and these have shown promise as biomarkers of aging (Oschwald et al., 2019). One commonly used approach is that of Cole and colleagues (Cole et al., 2018) “brain predicted age difference” (brain-PAD) model. This algorithm has been trained and validated using large population samples encompassing ages 18–92 years. Its source code is freely available, and growing use of this algorithm across a wide number of studies and populations also facilitates direct between study comparison and replication (Biondo et al., 2020; Ly et al., 2020; Soros and Bantel, 2020). It has been associated with other markers of aging (i.e., grip strength, lung function, walking speed and allostatic load), subsequent dementia diagnosis, and mortality risk, and thus has potential as a biomarker of age-related cognitive decline (Biondo et al., 2020; Cole et al., 2018).
A growing number of cross-sectional studies have investigated the relationship between brain age and cognitive function in unimpaired community dwelling adults, covering a range of domains including psychomotor speed, verbal fluency, delayed recall, and general cognitive status. Most consistently reported is the association between accelerated brain aging and worse psychomotor speed (Boyle et al., 2021; Elliott et al., 2019; Jonsson et al., 2019; Smith et al., 2019), while evidence for all other domains is relatively sparse, and inconsistent. Such discrepancies may relate to varying participant characteristics (i.e., wide age ranges that cover developmental and degenerative processes, or cohorts are limited to young and/or middle aged adults), and methods of measuring brain age.
Longitudinal investigations of the association between brain age and cognitive function have so far been limited to clinical populations. This body of literature consistently reports associations between accelerated brain aging and poor cognitive status in people with mild cognitive impairment and Alzheimer’s Disease (refer to Wrigglesworth et al., 2021 for a systematic review of these findings) (Franke and Gaser, 2012; Gaser et al., 2013; Lowe et al., 2016). Though 1 prospective study has investigated brain age in middle aged, community dwelling adults (~45 years), declines in cognitive function reflects changes occurring from child- to middle age adulthood (Elliott et al., 2019). Thus, to our knowledge, no study has investigated this association prospectively in community dwelling older adults.
Using the Cole and colleagues brain-PAD model (Cole et al., 2018), we determined whether (1) brain-PAD is cross-sectionally associated with 4 domains of cognitive function, selected for their propensity to decline in later life, and (2) if brain-PAD is predictive of changes in cognitive function over a 3 year follow-up. In the context of cognitive function, brain-PAD compares as a marker of local tissue volume (i.e., gray, white matter and cerebrospinal fluid) from across the whole brain, while other models are specific to 1 or more brain tissues types (i.e., gray matter density), or modalities. Our study is a novel examination of the 3-year change in 4 domains of cognitive function in cognitively unimpaired older participants. We hypothesized an association between accelerated brain aging and both poorer cognitive function and cognitive decline.
2. Materials and methods
2.1. Study design
ASPREE-NEURO is a neuroimaging sub-study of the ASPirin in Reducing Events in the Elderly (ASPREE) clinical trial (Ward et al., 2017). The NEURO sub-study recruited 572 cognitively healthy individuals from ASPREE, aged 70 years and over. Full eligibility criteria have been published elsewhere (Group, 2013), but in brief, exclusion criteria included established cardiovascular disease; diagnosis of dementia or a Modified Mini-Mental State Examination score <78 (Teng and Chui, 1987); severe disability or inability to perform 6 basic activities of daily living (Woods et al., 2020); a condition with a high current or recurrent risk of bleeding; anemia; and current use of aspirin or any other antiplatelet or anti-coagulated medications (McNeil et al., 2017). Of the 572 NEURO participants, 531 (95%) had usable MRI and cognitive assessment data at baseline. Fourteen participants did not complete a baseline MRI, and 27 were excluded due to poor image quality. Two hundred and fifty-nine participants had complete neuropsychological assessments at baseline, 1- and 3-year visits, and comprise our longitudinal subsample. The other 272 participants did not have complete longitudinal assessments. Reasons include death (n = 7), no longer attending in-person visits (i.e., assessments conducted via phone or through medical review [n = 11]), or the trial phase of ASPREE had ended before the third-year cognitive assessment (n = 254). ASPREE is registered with the International Standard Randomized Controlled Trial Number Register (ISRCTN83772183) and Clinicaltrials.gov (NCT01038583). NEURO is independently registered with the Australian New Zealand Clinical Trial Registry (AC-TRN12613001313729). The study was approved by the Monash University Human Research and Ethics Committee, and all participants provided written informed consent.
2.3. Brain age prediction
Brain age was estimated using a trained, publicly sourced processing pipeline and prediction model developed by Cole and colleagues (BrainageR, version 2.1 [https://github.com/james-cole/brainageR]) (Cole et al., 2018). Full details of the data acquisition, image quality assessment, and brain age protocol are provided in the Supplementary Methods. In brief, MRI data was acquired using a 3 Tesla Siemens Skyra scanner (Siemens, Erlangen, Germany) with a 32-channel head coil, located at the Monash Biomedical Imaging facility, Melbourne, Australia. Raw 3D T1-weighted images were preprocessed using the Statistical Parametric Mapping toolbox (University College London, London, UK) for MATLAB (Cole et al., 2015). This includes segmentation into gray matter (GM), white matter (WM) and cerebrospinal fluid, and normalization to Montreal Neurological Institute space using nonlinear registration (Ashburner, 2007). Images were modulated and resampled to a voxel size of 1.5 mm. Finally, spatial smoothing was applied using a kernel of 4 mm at FWHM.
Features of brain volume were combined, and divided into 435 principle components identified for the training cohort (n = 3377 healthy adults, 18–92 years old). Brain age was derived from these components, using a Gaussian process regression algorithm. Our primary outcome of interest is the brain-predicted age difference (brain-PAD), defined as the difference between an individual’s estimated brain age and their chronological age. A positive brain-PAD defines a predictive brain age that is older than one’s chronological age, while a negative value suggests brain age is younger than expected.
Estimated brain age had a significant positive correlation of ρ = 0.46 with chronological age, indicating moderate accuracy (p < 0.0001; Supplementary Figure 1A). Estimated brain age was evaluated for age bias (i.e., overestimation in younger, while underestimated in older participants) using the correlation between brain-PAD and chronological age. Brain-PAD was not associated with chronological age (ρ = −0.01, p = 0.83; Supplementary Figure 1B). These results were consistent among the longitudinal subsample (brain age: ρ = 0.45, p < 0.0001; brain-PAD: ρ = 0.01, p = 0.87).
2.4. Cognitive function
As a part of the ASPREE clinical trial, participants underwent cognitive assessments at baseline, year 1 and year 3 of follow-up. Cognitive tests include the Controlled Oral Word Association Test (COWAT) to measure verbal fluency (Ross, 2003), the Hopkins Verbal Learning Test - Revised Delayed Recall task for episodic memory (Benedict et al., 1998), the Symbol Digit Modalities Test (SDMT) for psychomotor speed (Smith, 1982), and the Modified Mini-Mental State (3MS), an overall screening of general cognitive status (Teng and Chui, 1987). A higher test score represents a better cognitive performance.
2.5. Study covariates
Extensive lifestyle and health information was available for all participants, allowing for an analysis of their contributing or confounding influence on the relationship between brain age and cognition. These include self-reported demographics (e.g., education, living arrangement), lifestyle factors (e.g., smoking and alcohol), and physical measures (e.g., blood pressure, body mass index [BMI]) that were collected at baseline, and at each follow-up of the ASPREE study. The diagnosis of diabetes, hypertension, dyslipidemia, and chronic kidney disease were derived from data collected at baseline, and have been described in detail elsewhere (McNeil et al., 2017).
2.6. Statistical analysis
Two key analyses were undertaken in line with our 2 key aims: (1) baseline brain-PAD versus baseline cognitive measures in all participants; and (2) baseline brain-PAD versus longitudinal change in cognitive measures in a subgroup of participants with cognitive data available over the 3-year follow-up (see Results).
Univariable linear regression models were used to assess the association between baseline brain-PAD and cognitive function (Aim 1), and baseline brain-PAD relative to changes in cognitive function (Aim 2), with brain-PAD treated as the exposure, and cognitive function the outcome of interest. The 3-year change in cognitive function was defined as the difference between baseline and year 3 cognitive assessment (Year 3 – Baseline). The coefficient of determination, and normality of residuals were used to evaluate the fit of each model. Multivariable linear regressions were subsequently undertaken to account for the influence of confounding covariates. Relevant covariates were identified using a univariable linear regression model, and a liberal criterion (p ≤ 0.20). In this sample of participants who were without major cognitive impairment and cardiovascular disease, we adjusted for chronological age (Model 1), in addition to gender, education, depression and BMI (Model 2). Our final model was specific to the analysis of change in cognitive function, and includes all covariates, along with baseline cognitive function (Model 3). With the exception of gender, chronological age, and education, covariates not associated with both cognition and brain-PAD were not included as this does not fit the criteria of confounding. These include socioeconomic percentile (SES), smoking, alcohol consumption, diabetes, hypertension, and chronic kidney disease diagnoses (refer to Supplementary Table 1). The multivariable models considered consecutive adjustment for covariates, and interactions to determine whether individual covariates were having a strong influence on the results (refer to Supplementary Table 2). For all models, we account for multiple testing (i.e., 4 measures of cognitive function at 2 time-points) by applying a Bonferroni correction of p ≤ 0.006.
We conducted a number of sensitivity analyses to assess the robustness of our main findings. This included: (1) analyses focused on individuals aged 70–75 years only, to ensure that the findings were not driven by the oldest participants in the cohort; and (2) investigating the 2 years (Year 3 – Year 1) change in cognitive function, to help account for potential practice effects with the cognitive tests administered in 2 consecutive years (baseline and year 1). Results were compared to the 1-year change in cognitive function (Baseline – Year 1) - a shorter re-test interval considered more susceptible to the effects of practice (Tombaugh, 2005). Analyses were performed using Stata software, release 16 (StataCorp).
3. Results
3.1. Participant characteristics
At baseline, the total cohort ranged in age from 70 to 88 years, but the majority were aged 70–74 years (Table 1). Most participants resided in more advantaged areas (higher SES percentile), completed tertiary education (i.e., 12 years or more), were over-weight and hypertensive.
Table 1.
Baseline characteristics of participants included in the study
| N | Total cohort 531 |
Longitudinal cohort 259 |
|---|---|---|
| Chronological age (y), median (IQR) | 72.5 (71.2–75.5) | 72.3 (71.2–75.2) |
| Age group (y), n (%) | ||
| 70–74 | 386 (72.7) | 188 (72.6) |
| ≥75 | 145 (27.3) | 71 (27.4) |
| Female gender, n (%) | 257 (48.4) | 111 (42.9) |
| aRace, n (%) | ||
| White | 517 (97.6) | 250 (96.5) |
| Other | 13 (2.5) | 9 (3.5) |
| Education (y), n (%) | ||
| <12 | 204 (38.4) | 102 (39.4) |
| ≥12 | 327 (61.6) | 157 (60.6) |
| SES (percentile), n (%) | ||
| ≤25 | 34 (6.4) | 13 (5.0) |
| 25–74 | 184 (34.7) | 99 (38.2) |
| ≥75 | 313 (59.0) | 147 (56.8) |
| Living alone (yes), n (%) | 143 (26.9) | 62 (23.9) |
| Smoking (yes), n (%) | ||
| Current | 20 (3.8) | 8 (3.1) |
| Former | 207 (39.0) | 94 (36.3) |
| Never | 304 (57.3) | 157 (60.6) |
| Alcohol consumption, n (%) | ||
| Never | 68 (12.8) | 34 (13.1) |
| Former | 17 (3.2) | 8 (3.1) |
| Low risk | 200 (37.7) | 85 (32.8) |
| High risk | 246 (46.3) | 132 (51.0) |
| aBMl (kg/m2), n (%) | ||
| <20 | 5 (1.0) | 2 (0.8) |
| 20–24 | 139 (26.3) | 63 (24.3) |
| 25–29 | 239 (45.3) | 126 (48.7) |
| ≥30 | 145 (27.5) | 68 (26.3) |
| Diabetes (yes), n (%) | 58 (10.9) | 29 (11.2) |
| Dyslipidemia (yes), n (%) | 312 (58.8) | 151 (58.3) |
| Depression (yes), n (%) | 54 (10.2) | 26 (10.0) |
| Hypertensive (yes), n (%) | 371 (69.9) | 184 (71.0) |
| aChronic Kidney Disease (yes), n (%) | 91 (18.2) | 43 (17.5) |
| Frail, n (%) | ||
| Not frail | 377 (71.0) | 191 (73.8) |
| Prefrail | 150 (28.3) | 67 (25.9) |
| Frail | 4 (0.75) | 1 (0.4) |
| Aspirin treatment (yes), n (%) | 265 (49.9) | 135 (52.1) |
Number of participants from total cohort who are missing from body mass index (BMI, n = 3), race (n = 1), and Chronic Kidney Disease (CKD, n = 31); participants missing from longitudinal sub-sample who are missing from CKD (n = 13). Education is defined as less than 12 years of education (i.e., did not complete secondary education in Australia), or 12 or more years of education (i.e., completed tertiary education in Australia) (Tunny, 2006). Baseline socioeconomic status (SES) was derived using the Index of Relative Socio-Economic Advantage and Disadvantage percentile score (SEIFA) (Statistics, 2016). Current alcohol consumption defined as low (<10 standard drinks per week/4 standard drinks on any 1 day), or high risk (≥10 standard drinks per week/4 standard drinks on any 1 day) (Council, 2009). Diabetes is defined as a fasting glucose level at least 126mg per deciliter (≥7 mmol per liter), or a recipient of diabetes medication or self-report. Dyslipidemia is defined as the receipt of cholesterol lowering medications, or as serum cholesterol levels of at least 212mg per deciliter (≥5.5 mmol per liter), or as a lipoprotein density level of more than 160 mg per deciliter (≥4.1 mmol per liter). Depression is defined as a score of ≥8 on the 10-item Centre for Epidemiologic Studies Depression Scale (Radloff, 1977). Hypertension is defined as receipt of treatment for high blood pressure(BP) or a BP more than 140/90 at ASPREE trial entry. Chronic Kidney Disease is defined as having an estimated glomerular filtration rate less than 60ml per min per 1.73m2, or a ratio of albumin (milligrams per liter) to creatinine (mmols per liter) in urine of 3 or more. Frailty is defined using the modified Fried Frailty criteria, that include low body weight, low grip strength, low gait speed, exhaustion, slow walking speed and low levels of physical activity (Wolfe et al., 2018). Participants were categorized as “prefrail” if they met 1 or 2 criteria, while “frail” individuals met 3 or more.
Participants from the longitudinal subsample (n = 259) had completed a 1 and 3-year cognitive assessment a median duration 358 and 1072 days after baseline, respectively (Table 1). These participants were similar to the remaining study sample that had not attended the follow-up cognitive assessments, with the exception that there were significantly more men (57% vs. 46%) and fewer women (43% vs. 54%; Pearson χ2[1] = 6.22, p = 0.013).
3.2. Estimated brain age and brain-predicted age difference (brain-PAD)
T1-weighted MRI scans were acquired a median of 14 (IQR = 11–20) days after cognitive assessment. The median brain-PAD was −1.5 (IQR = −5.5 to 2.8) and ranged between −19.5 and 14.6 years. Relative to the remaining total cohort, the longitudinal subsample had a similar estimated brain age (mean difference = 0.50 [95% CI = −0.68, 1.69] years, p = 0.51), and brain-PAD (mean difference = 0.30 [95% CI = −0.72, 1.33] years, p = 0.56).
3.3. Baseline and change in cognitive function
Baseline and longitudinal measures of cognitive performance are presented in Table 2. The distribution of baseline scores in 3MS, and HVLT-R were positively skewed, and thus the majority were high scoring on these tests. For COWAT and SDMT, baseline scores were normally distributed.
Table 2.
Cognitive function at baseline and year 3
| Cognitive measure | Total cohort | Longitudinal cohort | |||||
|---|---|---|---|---|---|---|---|
| ne | Mean (SD) | ne | Baseline Mean (SD) | Follow-up Mean (SD) | Change in cognitive function | ||
| Mean (95% CI) | p | ||||||
| 3MS, total scorea | 531 | 93.8 (4.3) | 258 | 93.6 (4.2) | 94.0 (4.9) | 0.5 (−0.1, 1.0) | 0.10 |
| COWATb | 531 | 12.4 (4.5) | 259 | 12.1 (4.2) | 13.5 (5.0) | 1.3 (0.8, 1.9) | <0.0001 |
| SDMTc | 528 | 39.1 (8.9) | 258 | 39.5 (9.0) | 39.0 (9.2) | −0.5 (−1.1, 0.3) | 0.21 |
| HVLT-R, delayed recalld | 530 | 8.0 (2.7) | 257 | 8.0 (2.7) | 8.3 (3.2) | 0.3 (−0.02, 0.6) | 0.07 |
Bold indicates significant change in scores of cognitive functions assessed at baseline to year 3 follow-up (p < 0.05). Key: CI, confidence interval; COWAT, Controlled Oral Word Association Test; HVLT, Hopkins Verbal Learning Test-Revised, delayed recall; 3MS, Modified Mini-Mental State Examination, overall score; SDMT, Symbol Digit Modalities Test.
Total 3MS scores range from 78 to 100, with higher scores representing a better general cognitive status (Teng and Chui, 1987).
Values represent the total number of words starting with F, that were produced over three 60 second time trials, minus any unacceptable responses (Ross, 2003). A greater number of words suggests better phonemic verbal fluency.
Represents the number of correct items from form C of the SDMT, in 90 seconds (Ryan et al., 2020). Participants completing more task are considered to have faster psychomotor speed.
The number of words recalled for the delayed recall task. Words were 12 nouns consisting of 4 words drawn from 3 semantic categories. A greater number of words indicates a better delayed recall.
Individuals could not be included as they declined to provide data for SDMT (n = 3) and HVLT-R (n = 1) at baseline; declined to provide data at the 3-year assessment for SDMT (n = 1), and HVLT-R (n = 2), or the study ceased before the year 3 assessment of 3MS (n = 1).
In the longitudinal subsample there was evidence of practice effects, with the average scores for COWAT increasing slightly from baseline to year 3 (Table 2). Scores on the other 3 tests remained stable, with on average (across all participants) no significant difference between the 2 time points. With the exception of SDMT (n = 257, mean difference = 0.30 [95% CI = −0.43, 1.02], p = 0.43), the shorter follow-up of 1 year resulted in a significant improvement in the average score of multiple domains, including 3MS (n = 259, mean difference = 1.04 [95% CI = 0.56, 1.53], p < 0.0001), COWAT (n = 258, mean difference = 1.26 [95% CI = 0.81, 1.72], p < 0.0001) and HVLT-R (n = 256, mean difference = 0.31 [95% CI = 0.05, 0.57], p = 0.02). In contrast, when removing baseline scores from measures of change (i.e., 2-year change), a slight significant decrease in 3MS was observed over the year 1 and year 3 follow-up (mean difference = −0.58 [95% CI = −1.10, −0.05], p = 0.03), while change in all other domains were not significant (COWAT: mean difference = 0.05 [95% CI = −0.45, 0.56], p = 0.83; SDMT: mean difference = −0.67 [95% CI = −1.39, 0.06], p = 0.07; HVLT-R: mean difference = −0.02 [95% CI = −0.28, 0.24], p = 0.88).
3.4. Brain aging and baseline cognitive function
Univariable analyses of baseline brain-PAD and cognitive function show a positive brain-PAD (i.e., older brain age relative to chronological age) was significantly associated with lower scores on the SDMT and HVLT-R (Fig. 1A and B; Table 3). When adjusting for multiple comparisons, only the association between brain-PAD and SDMT remained significant (p ≤ 0.006).
Fig. 1.
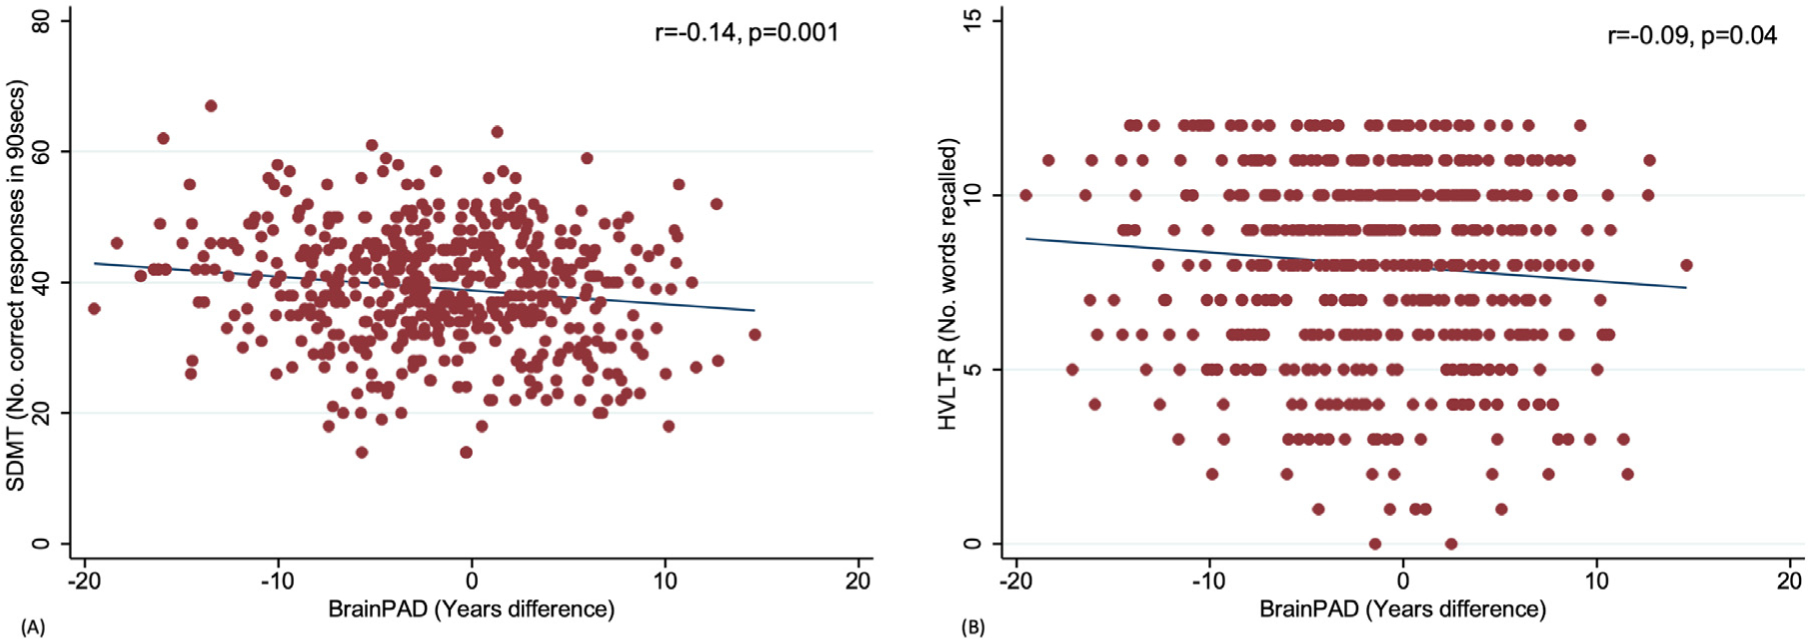
Scatterplots correlating brain-predicted age difference (brain-PAD) with baseline SDMT (A) and HVLT-R delayed recall (B).
Table 3.
Analyses of linear associations between brain-predicted age difference and cognitive function at baseline, and the change in cognition (Year 3 – Baseline)
| Cognitive measure 3MS, total score | Baseline cognitive function | Three-year Change | ||||||
|---|---|---|---|---|---|---|---|---|
| na | r | b (95% CI) | p | nb | r | b (95% CI) | p | |
| Univariable | 531 | −0.02 | −0.01 (−0.07, 0.05) | 0.72 | 258 | −0.1 | −0.08 (−0.17, 0.01) | 0.09 |
| Model 1 | 531 | −0.01 (−0.07, 0.05) | 0.7 | 258 | −0.08 (−0.17, 0.01) | 0.10 | ||
| Model 2 | 528 | −0.01 (−0.07, 0.05) | 0.75 | 258 | −0.08 (−0.17, 0.02) | 0.10 | ||
| Model 3 | 258 | −0.09 (−0.17, −0.01) | 0.04 | |||||
| COWAT | ||||||||
| Univariable | 531 | −0.08 | −0.06 (−0.13, 0.003) | 0.06 | 259 | −0.04 | −0.03 (−0.12, 0.06) | 0.51 |
| Model 1 | 531 | −0.06 (−0.13, 0.003) | 0.06 | 259 | −0.03 (−0.13, 0.06) | 0.47 | ||
| Model 2 | 528 | −0.06 (−0.12, 0.004) | 0.07 | 259 | −0.04 (−0.13, 0.06) | 0.43 | ||
| Model 3 | 259 | −0.03 (−0.12, 0.06) | 0.48 | |||||
| SDMT | ||||||||
| Univariable | 528 | −0.14 | −0.21 (−0.34, −0.08) | 0.001 | 258 | 0.06 | 0.06 (−0.06, 0.17) | 0.35 |
| Model 1 | 528 | −0.21 (−0.34, −0.09) | 0.001 | 258 | 0.06 (−0.06, 0.17) | 0.34 | ||
| Model 2 | 525 | −0.22 (−0.34, −0.10) | <0.0001 | 258 | 0.06 (−0.05, 0.18) | 0.29 | ||
| Model 3 | 258 | 0.04 (−0.08, 0.15) | 0.51 | |||||
| HVLT-R, delayed recall | ||||||||
| Univariable | 530 | −0.09 | −0.04 (−0.08, −0.003) | 0.04 | 257 | −0.15 | −0.07 (−0.12, −0.01) | 0.02 |
| Model 1 | 530 | −0.04 (−0.08, −0.004) | 0.03 | 257 | −0.06 (−0.11, −0.01) | 0.02 | ||
| Model 2 | 527 | −0.04 (−0.08, −0.002) | 0.04 | 257 | −0.06 (−0.11, −0.01) | 0.02 | ||
| Model 3 | 257 | −0.06 (−0.11, −0.01) | 0.02 | |||||
Model 1: adjusting for age; Model 2: adjusting for age, gender, education, body mass index (BMI), depression; Model 3: adjusting for all covariates, including baseline cognitive function.
Bold indicates significant association between PAD and cognitive function after Bonferroni correction (p < 0.006).
Key: b, unstandardized beta coefficient; CI, confidence interval; COWAT, Controlled Oral Word Association Test; HVLT, Hopkins Verbal Learning Test-Revised, delayed recall; 3MS, Modified Mini-Mental State Examination, overall score; SDMT, Symbol Digit Modalities Test.
Individuals could not be included as they declined to provide baseline data for SDMT (n = 3) and HVLT-R (n = 1), or participants were missing baseline body mass index (n = 3).
Individuals could not be included as they declined to provide baseline and/or follow-up data for the 3-year change in SDMT (n = 1), and HVLT-R (n = 2), or the study had ceased before year 3 assessment for 3MS (n = 1).
In multivariable analyses including chronological age (Model 1), gender, BMI, education and depression (Model 2), brain-PAD remained significantly associated with SDMT, and HVLT-R (Table 3). Only the association between brain-PAD and SDMT remained significant following adjustment for multiple comparisons (p ≤ 0.006). Interactions between brain-PAD and any of the chosen covariates were not significantly associated with cognitive function (p > 0.05) (Supplementary Table 2). No significant associations were observed with 3MS or COWAT (Table 3).
3.5. Brain aging and cognitive change
Univariable analyses were first performed using data from the longitudinal cohort. From this analysis, a greater positive baseline brain-PAD was significantly associated with a decline in HVLT-R over 3 years of follow-up (Fig. 2). The association between brain-PAD and the 3-year change in HVLT-R was no longer significant after correction for multiple comparisons (Table 3). Exclusion of 2 visual outliers with a very large decline in cognition (decrease of 9 and 11 words recalled; refer to Fig. 2) had minimal influence on the results with HVLT-R (n = 255, r = −0.16, b = −0.06 [95% CI = −0.11, −0.02], p = 0.01) and were thus retained in subsequent analyses.
Fig. 2.
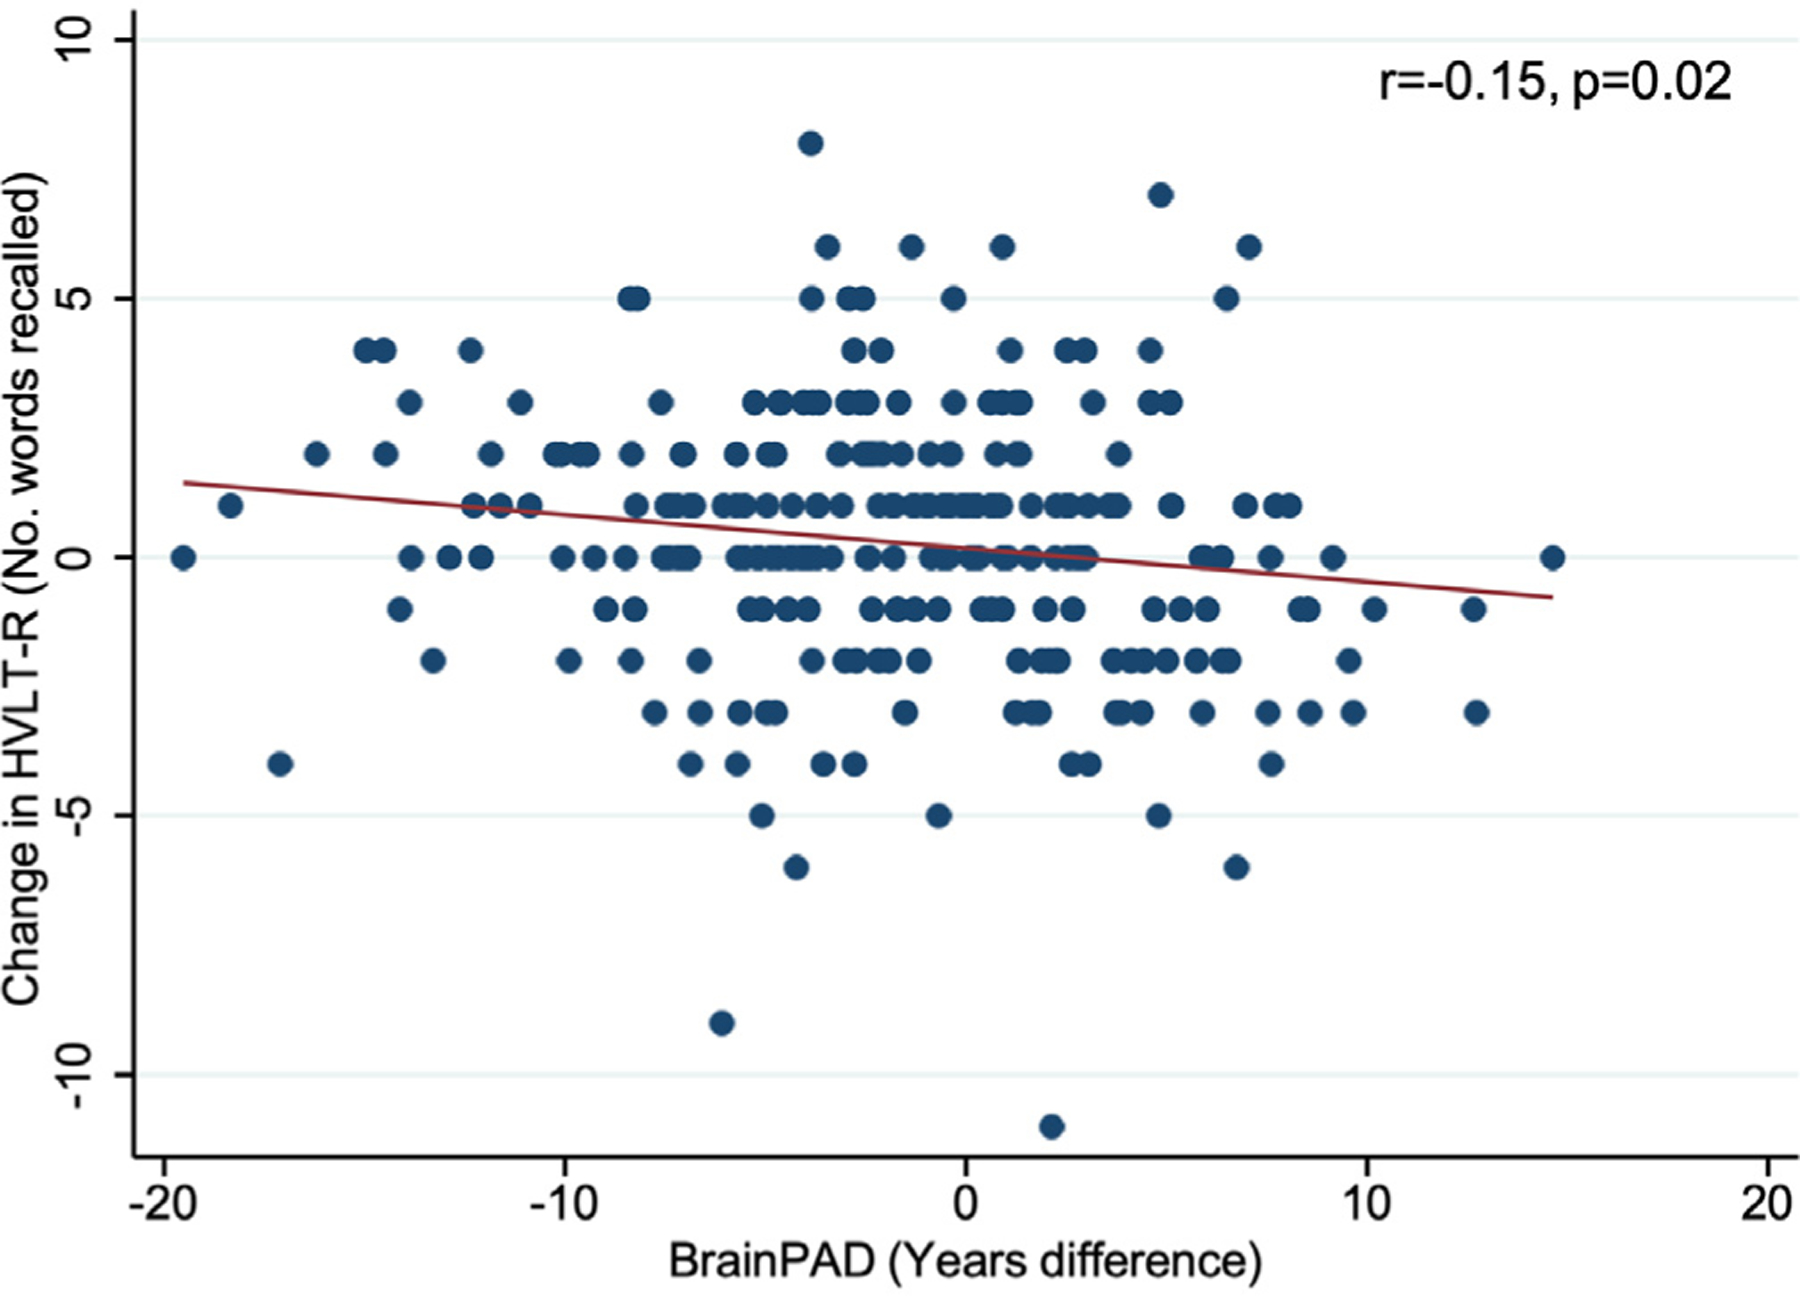
The association between baseline brain-predicted age difference (brain-PAD) and the 3 year change in delayed recall task of HVLT-R.
Associations with the decline in HVLT-R remained significant when adjusting for chronological age (Model 1), or all covariates (Model 2), including baseline cognitive function (Model 3; Table 3). All models passed standard fit and regression assumptions (Supplementary Figure 2A–F). When adjusted for baseline cognitive function, positive values of brain-PAD were significantly associated with a greater decline in 3MS (Table 3). After adjusting for multiple comparisons, the association between brain-PAD and the 3-year change in HVLT-R and 3MS did not reach significance (p > 0.006).
Interactions between positive brain-PAD and depression were also significantly associated with the 3-year decline in SDMT. Both interactions, however, no longer remained following correction for multiple comparisons (education: n = 257, b = −0.13 [95% CI = 0.01, 0.24], p = 0.04; depression (n = 258, b = 0.37[0.05, 0.70], p = 0.02).
3.6. Sensitivity analyses
Sensitivity analyses were performed to further explore the relationship between baseline brain-PAD and cognitive function by limiting the analysis to only participants aged below 76 years. Univariable findings were consistent to our corrected main results, and remained when adjusting for covariates (Supplementary Table 3). Removing these participants from the longitudinal subsample (n = 71), we observed no association between brain-PAD and any measure of change in cognitive function (Supplementary Table 3 and 4).
Further analyses were performed on a 1 year (baseline to year 1) and 2 years (year 1 to year 3) change in cognitive function. Univariable analyses show no association between brain-PAD and the 1 year change in cognitive function (Supplementary Table 5). Similar to our main findings, a more positive brain-PAD was significantly associated with a greater decline in HVLT-R over the 2-year follow-up, which remained consistent when adjusting for chronological age, and all covariates (i.e., chronological age, gender, BMI, education and depression; Supplementary Table 3, Models 1 and 2). Models passed standard fit and regression assumptions (Supplementary Figure 3A–D).
4. Discussion
This study aimed to determine whether interindividual differences in brain-PAD are associated with baseline cognitive function, and changes in cognitive function over time. In a sample of 531 older community dwelling adults aged 70 years and above, accelerated brain aging (i.e., older predicted brain age relative to chronological age) was associated with slower baseline psychomotor speed and worse delayed recall. After correcting for multiple comparisons, only the association with psychomotor speed remained.
In a subsample of 259 participants followed longitudinally, accelerated brain aging at baseline was predictive of a modest decline in delayed recall and general cognitive status over 3 years, although these findings didn’t reach Bonferroni-corrected significance levels. Given the likely practice effects observed (i.e., changes in cognitive performance that may be attributable to a prior test experience rather than normal age-related change) (Salthouse, 2019), in particular in relation to COWAT, we attempted to account for this by performing a sensitivity analysis that examined the change in cognitive function from year 1 to year 3. In this respect, we ignored baseline test scores, which was the first-time participants had likely undertaken such a test, and examined change when participants were equally familiar with the cognitive assessment. Through this analysis, we confirm our findings regarding delayed recall, but observed no association with general cognitive status. However, when excluding the few participants aged 76 years and above, we no longer identified an association with the change in cognition, and thus findings may be influenced by these few older participants. No significant associations were found with baseline scores of general cognitive status and verbal fluency, nor the decline in verbal fluency.
4.1. Cross-sectional associations between brain aging and cognitive function
Although an increasing number of studies have investigated the relationship between brain-PAD and health conditions, including dementia (Wrigglesworth et al., 2021), few have determined associations with cognitive function in unimpaired older populations. In the published literature, psychomotor speed has been most extensively examined, with the majority of studies reporting associations between accelerated brain aging and impaired or worse cognitive function in this domain (Boyle et al., 2021; Elliott et al., 2019; Jonsson et al., 2019; Smith et al., 2019). This aligns with the findings of our study, and is consistent with the slower processing speed identified in older populations (Ebaid et al., 2017). Only 1 study found no association between accelerated brain aging and psychomotor function, but they defined psychomotor function using computational modelling of responses to a letter-based task rather than directly from neuropsychological tests (Bundesen, 1990; Richard et al., 2018).
The cognitive domain of memory has received less attention, with only 3 studies examining this association (Boyle et al., 2021; Elliott et al., 2019; Richard et al., 2018). Of these studies, 2 found no association between brain aging and memory (Boyle et al., 2021; Richard et al., 2018), while the third observed a significant association. Although we initially identified a significant association with memory, these findings had not survived multiple correction. These distinctions may relate to differences in the methodologies, measures of brain age and cognitive function, as well as the cohort characteristics of the study samples. For example, compared to our target group of late-life participants (aged 70–88 years old), Elliot and colleagues identified an association in adults aged approximately 45 years (aged 43–47 years old) (Elliott et al., 2019). The evidence regarding phonological verbal fluency is also inconsistent, and may also be explained by these distinctions. For example, 2 cross-sectional studies have investigated phonological fluency – 1 in community dwelling cohorts aged ~47–94 years and the second in patients with a traumatic brain injury (Boyle et al., 2021; Cole et al., 2015). Interestingly, both studies reported associations with brain age estimated from GM, rather than overall GM and WM as undertaken herein, and reported in other studies of verbal fluency (Armstrong et al., 2020; Richard et al., 2018). Thus, discrepancies may also relate to tissue-specific sensitivity of brain aging to impairment in specific cognitive domains, but more research is needed.
We also failed to find any evidence of a significant relationship between brain-PAD and general cognitive status (i.e., as measured using the 3MS). In the context of brain aging, the evidence on general cognitive status is extensive, but primarily related to cognitively impaired or Alzheimer’s disease populations (Beheshti et al., 2018; Franke et al., 2010). In line with our current results, 2 previously mentioned studies that used screening tools to assess general cognitive status (Mini Mental State Examination, Montreal Cognitive Assessment), similar to the 3MS assessment we used, did not find an association or reported mixed results across different cohorts (Boyle et al., 2021; Richard et al., 2018). Thus, participant characteristics may play an important role when investigating brain-PAD and general cognitive status, and warrants further investigation.
4.2. Longitudinal associations between brain aging and the change in cognitive function over time
Our study also identified an association between accelerated brain-PAD at baseline and a 3-year change in delayed recall. This, however, was only a small effect, and no longer significant when adjusting for multiple comparisons. Further, we identified no association with change when excluding participants aged 76 years and above, and thus initial findings may be biased by these few outliers. We also did not find an association with longitudinal declines in psychomotor speed, verbal fluency, and general cognitive status. An association with general cognitive status was observed when adjusting for covariates including baseline cognitive function, but was no longer significant after applying a multiple correction. Given the high educational attainment and negative brain-PAD of most participants, it is possible our findings represent contributing factors like cognitive reserve and brain reserve which have enabled some individuals to tolerate more age-related change, and thus, prolong the onset of cognitive decline (Stern et al., 2020). Findings, however, corroborate evidence from neuroimaging studies which also report no association between baseline brain volume and change in cognitive function in middle aged, and older adults (Armstrong et al., 2020; Charlton et al., 2010; Ritchie et al., 2015). As there are currently no longitudinal studies investigating brain age and cognitive decline, further evidence is required.
4.3. Strengths and limitations
A number of strengths of this study are notable. The prospective investigation of cognitive function from a large community-based cohort of older cognitively unimpaired participants enabled inferences to be targeted to the stage of life associated with cognitive decline and heterogeneous aging trajectories. We also estimated brain age using a publicly sourced model that has been previously validated using an independent test cohort (Cole et al., 2018), providing for transparency and replicability of our results, while also undertaking a robust, quantitative evaluation of image quality prior to data analysis. Further, estimates are derived from local tissue volume (i.e., GM and WM volume) from across the whole brain, which change with aging (Grajauskas et al., 2019). Finally, we accounted for possible learning effects on our neuropsychological tests by performing a sensitivity analysis that assessed associations with a 1- and 2-year change in cognitive function.
Several limitations must also be considered, and are as following. Although we targeted a community-based sample, most participants who enrolled in the study were predominantly white, highly educated (completed tertiary education), and were in the higher SES percentile. Further, the proportion of participants who completed at least secondary school education is a bit higher than the overall ASPREE populations, and estimates from the broader Australian population (Tunny, 2006), which is around 50%. Though we account for the effects of education, this, along with the inclusion of cognitively unimpaired individuals, may have influenced cognitive outcomes and trajectories, given the established relationship between wealth or SES and cognitive reserve. Considering the HVLT-R delayed recall is prone to ceiling effects, and that eligible ASPREE participants required a 3MS score of 78 or above, these factors reduced the variability in cognitive scores in the population and thus may have reduced the power to detect significant associations (Ryan et al., 2019).
Though longitudinal, this study was limited to a 3-year follow-up period. A longer follow-up period would allow for greater variability in cognitive trajectories, including the onset of clinically-relevant cognitive decline in some people, to emerge (Wu et al., 2021). Further, findings were limited to a select few cognitive domains (i.e., delayed recall, psychomotor speed, and verbal fluency and general cognitive status), that were evaluated using single tests. Longitudinal analyses were also limited to a smaller sub-sample of participants with cognitive data available at each follow-up time point. In future, the release of longitudinal cognitive follow-up data for the NEURO participants, who had not yet attended a year 3 visit at the time the intervention phase of the ASPREE study was truncated in mid-2017, will allow this to be addressed. Though as few as 3 repeated measures may not be enough to produce reliable estimates, alternative approaches like linear mixed models have an innate flexibility to handle missing values, and thus may be more appropriate for subsequent studies (Brauer and Curtin, 2018).
The fit of the brain age prediction model was relatively accurate in our population; however, the strength of the association is weaker than in the training sample and the independent validation cohort used to develop the model. This may relate to the relatively narrow age range included in our sample, in comparison to data from the full adult lifespan included in the training cohort. The less accurate model fit may have introduced a measure of noise into our estimates, alongside true interindividual variability, but does not invalidate our inferences (Cole et al., 2017).
Despite a statistically significant association with baseline psychomotor speed and delayed recall, and the 3-year change in memory and general cognitive status, the overall effect of brain-PAD was relatively small, and only psychomotor speed remains significant when applying a conservative Bonferroni corrected p value of 0.006 (4 cognitive tests at 2 time points) to reduce the risk of type 1 error due to multiple comparisons. Thus, there is the possibility that our findings reflect a false positive. Though the direction of the association between brain-PAD and cognitive function are as predicted, our interpretation of a positive brain-PAD – considered to reflect an older, “less healthy” looking brain – being associated with a worse cognitive performance may be over simplistic. Further, we infer “brain aging” from our cross-sectional measure of brain-PAD. While brain-PAD is often interpreted as a proxy marker of accelerated or decelerated biological aging (Franke and Gaser, 2019), it does not reflect a measure of longitudinal change in brain anatomy. Finally, further research will be necessary to determine how different sub regions of the brain may be contributing to the brain age estimation and cognition relationships, and whether inclusion of other imaging modalities (e.g., white matter integrity) may improve the fit and sensitivity of the model (Scheinost et al., 2019).
5. Conclusions
This study investigated whether brain aging is associated with cognitive function and cognitive decline, in community dwelling older adults. Using estimates of local tissue volume from across the whole brain, we provide additional evidence of an association between accelerated brain aging and impaired psychomotor speed. Evidence of a weak effect of accelerated brain aging on delayed recall memory, the decline in memory and general cognitive status were also identified, but these didn’t remain significant after adjustment for multiple comparisons. Given few studies have investigated brain age and cognitive decline in later life, future research will benefit from further prospective analyses of associations between brain age, cognitive function, and the risk of clinically-relevant cognitive impairment in initially healthy, community dwelling older adults.
Supplementary Material
Acknowledgements
The authors would like to thank participants of the Australian ASPREE and NEURO studies for volunteering their time, and general practitioners for supporting participants throughout the trial. Authors also acknowledge the hard work of all ASPREE field staff, and those at the Monash Biomedical Imaging facility who attained magnetic resonance images. Supported by grants (U01AG029824 and U19AG062682) from the National Institute on Aging and the National Cancer Institute at the National Institutes of Health, by grants (334047; 1086188 and 1127060) from the National Health and Medical Research Council of Australia, and by Monash University and the Victorian Cancer Agency. Funders did not direct the conduction of this study, nor the decision to publish these findings.
Disclosure statement
Jo Wrigglesworth is the recipient of a Research Training Program stipend, awarded by Monash University and the Australian government. Ian H. Harding is supported by NHMRC Fellowship [APP1106533]. Joanne Ryan is funded by a NHMRC Dementia Research Leader Fellowship [APP1135727]. Sharna Jamadar is supported by an Australian National Health and Medical Research Council Fellowship [APP1174164] and the Australian Research Council Centre of Excellence for Integrative Brain Function [CE140100007]. The remaining authors report no conflicts of interest.
Footnotes
Verification
No part of this manuscript has been published previously and it has not been submitted for publication elsewhere. All authors approve the publication of this manuscript.
Supplementary materials
Supplementary material associated with this article can be found, in the online version, at doi: 10.1016/j.neurobiolaging.2021.10.007.
CRediT authorship contribution statement
Jo Wrigglesworth: Conceptualization, Methodology, Formal analysis, Writing – original draft, Visualization. Nurathifah Yaacob: Writing – review & editing. Phillip Ward: Supervision, Conceptualization, Resources, Writing – review & editing. Robyn L. Woods: Supervision, Conceptualization, Resources, Writing – review & editing. John McNeil: Resources, Writing – review & editing. Elsdon Storey: Resources. Gary Egan: Resources, Writing – review & editing. Anne Murray: Resources, Writing – review & editing. Raj C. Shah: Resources, Writing – review & editing. Sharna D. Jamadar: Writing – review & editing. Ruth Trevaks: Writing – review & editing. Stephanie Ward: Resources, Writing – review & editing. Ian H. Harding: Supervision, Conceptualization, Methodology, Writing – review & editing. Joanne Ryan: Supervision, Conceptualization, Writing – review & editing.
References
- Armstrong NM, An Y, Shin JJ, Williams OA, Doshi J, Erus G, Davatzikos C, Ferrucci L, Beason-Held LL, Resnick SM, 2020. Associations between cognitive and brain volume changes in cognitively normal older adults. Neuroimage 223, 117289. [DOI] [PMC free article] [PubMed] [Google Scholar]
- Ashburner J, 2007. A fast diffeomorphic image registration algorithm. Neuroimage 38 (1), 95–113. [DOI] [PubMed] [Google Scholar]
- Beheshti I, Maikusa N, Matsuda H, 2018. The association between “Brain-Age Score” (BAS) and traditional neuropsychological screening tools in Alzheimer’s disease. Brain Behav. 8 (8), e01020. [DOI] [PMC free article] [PubMed] [Google Scholar]
- Benedict RH, Schretlen D, Groninger L, Brandt J, 1998. Hopkins verbal learning test–revised: normative data and analysis of inter-form and test-retest reliability. Clin. Neuropsychol 12 (1), 43–55. [Google Scholar]
- Biondo F, Jewell A, Pritchard M, Mueller C, Steves CJ, Cole JH, 2020. Brain-age predicts subsequent dementia in memory clinic patients: Neuroimaging/Optimal neuroimaging measures for early detection. Alzheimer’s & Dementia 16 (S5), e037378. doi: 10.1002/alz.037378, In press. [DOI] [Google Scholar]
- Boyle R, Jollans L, Rueda-Delgado LM, Rizzo R, Yener GG, McMorrow JP, Knight SP, Carey D, Robertson IH, Emek-Savas DD, Stern Y, Kenny RA, Whelan R, 2021. Brain-predicted age difference score is related to specific cognitive functions: a multi-site replication analysis. Brain Imaging Behav. 15 (1), 327–345. [DOI] [PMC free article] [PubMed] [Google Scholar]
- Brauer M, Curtin JJ, 2018. Linear mixed-effects models and the analysis of non-independent data: a unified framework to analyze categorical and continuous independent variables that vary within-subjects and/or within-items. Psychol. Methods 23 (3), 389–411. [DOI] [PubMed] [Google Scholar]
- Bundesen C, 1990. A theory of visual attention. Psychol. Rev 97 (4), 523–547. [DOI] [PubMed] [Google Scholar]
- Charlton RA, Schiavone F, Barrick TR, Morris RG, Markus HS, 2010. Diffusion tensor imaging detects age related white matter change over a 2 year follow-up which is associated with working memory decline. J. Neurol. Neurosurg. Psychiatry 81 (1), 13–19. [DOI] [PubMed] [Google Scholar]
- Coelho A, Fernandes HM, Magalhaes R, Moreira PS, Marques P, Soares JM, Amorim L, Portugal-Nunes C, Castanho T, Santos NC, Sousa N, 2021. Signatures of white-matter microstructure degradation during aging and its association with cognitive status. Sci. Rep 11 (1), 4517. [DOI] [PMC free article] [PubMed] [Google Scholar]
- Cole JH, Leech R, Sharp DJ Alzheimer’s Disease Neuroimaging, I., 2015. Prediction of brain age suggests accelerated atrophy after traumatic brain injury. Ann. Neurol 77 (4), 571–581. [DOI] [PMC free article] [PubMed] [Google Scholar]
- Cole JH, Ritchie SJ, Bastin ME, Valdes Hernandez MC, Munoz Maniega S, Royle N, Corley J, Pattie A, Harris SE, Zhang Q, Wray NR, Redmond P, Marioni RE, Starr JM, Cox SR, Wardlaw JM, Sharp DJ, Deary IJ, 2018. Brain age predicts mortality. Mol. Psychiatry 23 (5), 1385–1392. [DOI] [PMC free article] [PubMed] [Google Scholar]
- Cole JH, Underwood J, Caan MW, De Francesco D, van Zoest RA, Leech R, Wit FW, Portegies P, Geurtsen GJ, Schmand BA, Schim van der Loeff MF, Franceschi C, Sabin CA, Majoie CB, Winston A, Reiss P, Sharp DJ collaboration, C., 2017. Increased brain-predicted aging in treated HIV disease. Neurology 88 (14), 1349–1357. [DOI] [PMC free article] [PubMed] [Google Scholar]
- Council, M., 2009. Australian Guidelines to Reduce Health Risks from Drinking Alcohol. NHMRC, Canberra. [DOI] [PMC free article] [PubMed] [Google Scholar]
- Damoiseaux JS, 2017. Effects of aging on functional and structural brain connectivity. Neuroimage 160, 32–40. [DOI] [PubMed] [Google Scholar]
- Dinsdale NK, Bluemke E, Smith SM, Arya Z, Vidaurre D, Jenkinson M, Namburete AIL, 2021. Learning patterns of the ageing brain in MRI using deep convolutional networks. Neuroimage 224, 117401. [DOI] [PubMed] [Google Scholar]
- Ebaid D, Crewther SG, MacCalman K, Brown A, Crewther DP, 2017. Cognitive processing speed across the lifespan: beyond the influence of motor speed. Front. Aging Neurosci 9, 62. [DOI] [PMC free article] [PubMed] [Google Scholar]
- Elliott ML, Belsky DW, Knodt AR, Ireland D, Melzer TR, Poulton R, Ramrakha S, Caspi A, Moffitt TE, Hariri AR, 2019. Brain-age in midlife is associated with accelerated biological aging and cognitive decline in a longitudinal birth cohort. Mol. Psychiatry 26, 3829–3838 In press. [DOI] [PMC free article] [PubMed] [Google Scholar]
- Franke K, Gaser C, 2012. Longitudinal changes in individual BrainAGE in healthy aging, mild cognitive impairment, and Alzheimer’s disease. GeroPsych 25 (4), 235. [Google Scholar]
- Franke K, Gaser C, 2019. Ten years of BrainAGE as a neuroimaging biomarker of brain aging: what insights have we gained? Front. Neurol 10, 789. [DOI] [PMC free article] [PubMed] [Google Scholar]
- Franke K, Ziegler G, Kloppel S, Gaser C Alzheimer’s Disease Neuroimaging, I., 2010. Estimating the age of healthy subjects from T1-weighted MRI scans using kernel methods: exploring the influence of various parameters. Neuroimage 50 (3), 883–892. [DOI] [PubMed] [Google Scholar]
- Gaser C, Franke K, Kloppel S, Koutsouleris N, Sauer H Alzheimer’s Disease Neuroimaging, I., 2013. BrainAGE in mild cognitive impaired patients: predicting the conversion to Alzheimer’s disease. PLoS One 8 (6), e67346. [DOI] [PMC free article] [PubMed] [Google Scholar]
- Grajauskas LA, Siu W, Medvedev G, Guo H, D’Arcy RCN, Song X, 2019. MRI-based evaluation of structural degeneration in the ageing brain: pathophysiology and assessment. Ageing Res. Rev 49, 67–82. [DOI] [PubMed] [Google Scholar]
- Group, A.I., 2013. Study design of ASPirin in Reducing Events in the Elderly (ASPREE): a randomized, controlled trial. Contemp. Clin. Trials 36 (2), 555–564. [DOI] [PMC free article] [PubMed] [Google Scholar]
- Jonsson BA, Bjornsdottir G, Thorgeirsson TE, Ellingsen LM, Walters GB, Gudbjartsson DF, Stefansson H, Stefansson K, Ulfarsson MO, 2019. Brain age prediction using deep learning uncovers associated sequence variants. Nat. Commun 10 (1), 5409. [DOI] [PMC free article] [PubMed] [Google Scholar]
- Kaufmann T, van der Meer D, Doan NT, Schwarz E, Lund MJ, Agartz I, Alnaes D, Barch DM, Baur-Streubel R, Bertolino A, Bettella F, Beyer MK, Boen E, Borgwardt S, Brandt CL, Buitelaar J, Celius EG, Cervenka S, Conzelmann A, Cordova-Palomera A, Dale AM, de Quervain DJF, Di Carlo P, Djurovic S, Dorum ES, Eisenacher S, Elvsashagen T, Espeseth T, Fatouros-Bergman H, Flyckt L, Franke B, Frei O, Haatveit B, Haberg AK, Harbo HF, Hartman CA, Heslenfeld D, Hoekstra PJ, Hogestol EA, Jernigan TL, Jonassen R, Jonsson EG, Karolinska Schizophrenia P, Kirsch P, Kloszewska I, Kolskar KK, Landro NI, Le Hellard S, Lesch KP, Lovestone S, Lundervold A, Lundervold AJ, Maglanoc LA, Malt UF, Mecocci P, Melle I, Meyer-Lindenberg A, Moberget T, Norbom LB, Nordvik JE, Nyberg L, Oosterlaan J, Papalino M, Papassotiropoulos A, Pauli P, Pergola G, Persson K, Richard G, Rokicki J, Sanders AM, Selbaek G, Shadrin AA, Smeland OB, Soininen H, Sowa P, Steen VM, Tsolaki M, Ulrichsen KM, Vellas B, Wang L, Westman E, Ziegler GC, Zink M, Andreassen OA, Westlye LT, 2019. Common brain disorders are associated with heritable patterns of apparent aging of the brain. Nat. Neurosci 22 (10), 1617–1623. [DOI] [PMC free article] [PubMed] [Google Scholar]
- Liem F, Varoquaux G, Kynast J, Beyer F, Kharabian Masouleh S, Huntenburg JM, Lampe L, Rahim M, Abraham A, Craddock RC, Riedel-Heller S, Luck T, Loeffler M, Schroeter ML, Witte AV, Villringer A, Margulies DS, 2017. Predicting brain-age from multimodal imaging data captures cognitive impairment. Neuroimage 148, 179–188. [DOI] [PubMed] [Google Scholar]
- Lopez-Otin C, Blasco MA, Partridge L, Serrano M, Kroemer G, 2013. The hallmarks of aging. Cell 153 (6), 1194–1217. [DOI] [PMC free article] [PubMed] [Google Scholar]
- Lowe LC, Gaser C, Franke K Alzheimer’s Disease Neuroimaging, I., 2016. The effect of the APOE genotype on individual BrainAGE in normal aging, mild cognitive impairment, and Alzheimer’s disease. PLoS One 11 (7), e0157514. [DOI] [PMC free article] [PubMed] [Google Scholar]
- Ly M, Yu GZ, Karim HT, Muppidi NR, Mizuno A, Klunk WE, Aizenstein HJ Alzheimer’s Disease Neuroimaging, I., 2020. Improving brain age prediction models: incorporation of amyloid status in Alzheimer’s disease. Neurobiol. Aging 87, 44–48. [DOI] [PMC free article] [PubMed] [Google Scholar]
- McNeil JJ, Woods RL, Nelson MR, Murray AM, Reid CM, Kirpach B, Storey E, Shah RC, Wolfe RS, Tonkin AM, Newman AB, Williamson JD, Lockery JE, Margolis KL, Ernst ME, Abhayaratna WP, Stocks N, Fitzgerald SM, Trevaks RE, Orchard SG, Beilin LJ, Donnan GA, Gibbs P, Johnston CI, Grimm RH Group, A.I., 2017. Baseline characteristics of participants in the ASPREE (ASPirin in Reducing Events in the Elderly) study. J. Gerontol. A Biol. Sci. Med. Sci 72 (11), 1586–1593. [DOI] [PMC free article] [PubMed] [Google Scholar]
- Organization, W.H., 2019. Risk reduction of cognitive decline and dementia: WHO guidelines. [PubMed] [Google Scholar]
- Oschwald J, Guye S, Liem F, Rast P, Willis S, Rocke C, Jancke L, Martin M, Merillat S, 2019. Brain structure and cognitive ability in healthy aging: a review on longitudinal correlated change. Rev. Neurosci 31 (1), 1–57. [DOI] [PMC free article] [PubMed] [Google Scholar]
- Radloff LS, 1977. The CES-D scale: A self-report depression scale for research in the general population. Appl. Psychol. Meas 1 (3), 385–401. [Google Scholar]
- Richard G, Kolskar K, Sanders AM, Kaufmann T, Petersen A, Doan NT, Monereo Sanchez J, Alnaes D, Ulrichsen KM, Dorum ES, Andreassen OA, Nordvik JE, Westlye LT, 2018. Assessing distinct patterns of cognitive aging using tissue-specific brain age prediction based on diffusion tensor imaging and brain morphometry. PeerJ 6, e5908. [DOI] [PMC free article] [PubMed] [Google Scholar]
- Ritchie SJ, Dickie DA, Cox SR, Valdes Hernandez Mdel C, Corley J, Royle NA, Pattie A, Aribisala BS, Redmond P, Munoz Maniega S, Taylor AM, Sibbett R, Gow AJ, Starr JM, Bastin ME, Wardlaw JM, Deary IJ, 2015. Brain volumetric changes and cognitive ageing during the eighth decade of life. Hum. Brain Mapp 36 (12), 4910–4925. [DOI] [PMC free article] [PubMed] [Google Scholar]
- Ross TP, 2003. The reliability of cluster and switch scores for the controlled oral word association test. Arch. Clin. Neuropsychol 18 (2), 153–164. [PubMed] [Google Scholar]
- Ryan J, Woods RL, Britt C, Murray AM, Shah RC, Reid CM, Kirpach B, Wolfe RS, Nelson MR, Lockery JE, Orchard SG, Trevaks RE, McNeil JJ, Storey E Group, A.I., 2019. Normative performance of healthy older individuals on the Modified Mini-Mental State (3MS) examination according to ethno-racial group, gender, age, and education level. Clin. Neuropsychol 33 (4), 779–797. [DOI] [PMC free article] [PubMed] [Google Scholar]
- Ryan J, Woods RL, Britt CJ, Murray AM, Shah RC, Reid CM, Wolfe R, Nelson MR, Orchard SG, Lockery JE, Trevaks RE, Storey E behalf of the, A.I.G.o., 2020. Normative data for the symbol digit modalities test in older White Australians and Americans, African-Americans, and Hispanic/Latinos. J. Alzheimers Dis. Rep 4 (1), 313–323. [DOI] [PMC free article] [PubMed] [Google Scholar]
- Salthouse TA, 2019. Trajectories of normal cognitive aging. Psychol. Aging 34 (1), 17–24. [DOI] [PMC free article] [PubMed] [Google Scholar]
- Scheinost D, Noble S, Horien C, Greene AS, Lake EM, Salehi M, Gao S, Shen X, O’Connor D, Barron DS, Yip SW, Rosenberg MD, Constable RT, 2019. Ten simple rules for predictive modeling of individual differences in neuroimaging. Neuroimage 193, 35–45. [DOI] [PMC free article] [PubMed] [Google Scholar]
- Smith A, 1982. Symbol digit modalities test (SDMT) manual (Revised). Western Psychological Services, Los Angeles. [Google Scholar]
- Smith SM, Vidaurre D, Alfaro-Almagro F, Nichols TE, Miller KL, 2019. Estimation of brain age delta from brain imaging. Neuroimage 200, 528–539. [DOI] [PMC free article] [PubMed] [Google Scholar]
- Soros P, Bantel C, 2020. Chronic noncancer pain is not associated with accelerated brain aging as assessed by structural magnetic resonance imaging in patients treated in specialized outpatient clinics. Pain 161 (3), 641–650. [DOI] [PubMed] [Google Scholar]
- Statistics, A.B.o., 2016. Socio-Economic Indexes for Areas (SEIFA), in: Statistics, A.B.o. (Ed.). Australian Bureau of Statistics, Canberra. [Google Scholar]
- Stern Y, Arenaza-Urquijo EM, Bartres-Faz D, Belleville S, Cantilon M, Chetelat G, Ewers M, Franzmeier N, Kempermann G, Kremen WS, Okonkwo O, Scarmeas N, Soldan A, Udeh-Momoh C, Valenzuela M, Vemuri P, Vuoksimaa E the Reserve, R., Protective Factors, P.I.A.E.D., Conceptual Frameworks, W., 2020. Whitepaper: defining and investigating cognitive reserve, brain reserve, and brain maintenance. Alzheimers Dement 16 (9), 1305–1311. [DOI] [PMC free article] [PubMed] [Google Scholar]
- Teng EL, Chui HC, 1987. The Modified Mini-Mental State (3MS) examination. J. Clin. Psychiatry 48 (8), 314–318. [PubMed] [Google Scholar]
- Tombaugh TN, 2005. Test-retest reliable coefficients and 5-year change scores for the MMSE and 3MS. Arch. Clin. Neuropsychol 20 (4), 485–503. [DOI] [PubMed] [Google Scholar]
- Tucker-Drob EM, 2019. Cognitive aging and dementia: a life-span perspective. Annu. Rev. Dev. Psychol 1, 177–196. [DOI] [PMC free article] [PubMed] [Google Scholar]
- Tunny G, 2006. Educational attainment in Australia. Economic Round-up (Autumn 2006), 1–9. [Google Scholar]
- Ward SA, Raniga P, Ferris NJ, Woods RL, Storey E, Bailey MJ, Brodtmann A, Yates PA, Donnan GA, Trevaks RE, Wolfe R, Egan GF, McNeil JJ on behalf of the, A.i.g., 2017. ASPREE-NEURO study protocol: a randomized controlled trial to determine the effect of low-dose aspirin on cerebral microbleeds, white matter hyperintensities, cognition, and stroke in the healthy elderly. Int. J. Stroke 12 (1), 108–113. [DOI] [PMC free article] [PubMed] [Google Scholar]
- Wolfe R, Murray AM, Woods RL, Kirpach B, Gilbertson D, Shah RC, Nelson MR, Reid CM, Ernst ME, Lockery J, Donnan GA, Williamson J, McNeil JJ, 2018. The aspirin in reducing events in the elderly trial: statistical analysis plan. Int. J. Stroke 13 (3), 335–338. [DOI] [PMC free article] [PubMed] [Google Scholar]
- Woods RL, Espinoza S, Thao LTP, Ernst ME, Ryan J, Wolfe R, Shah RC, Ward SA, Storey E, Nelson MR, Reid CM, Lockery JE, Orchard SG, Trevaks RE, Fitzgerald SM, Stocks NP, Williamson JD, McNeil JJ, Murray AM, Newman AB Group, A.I., 2020. Effect of aspirin on activities of daily living disability in community-dwelling older adults. J. Gerontol. A Biol. Sci. Med. Sci 76, 2007–2014. [DOI] [PMC free article] [PubMed] [Google Scholar]
- Wrigglesworth J, Ward P, Harding IH, Nilaweera D, Wu Z, Woods RL, Ryan J, 2021. Factors associated with brain ageing-a systematic review. BMC Neurol. 21 (1), 1–23. [DOI] [PMC free article] [PubMed] [Google Scholar]
- Wu Z, Woods RL, Wolfe R, Storey E, Chong TTJ, Shah RC, Orchard SG, McNeil JJ, Murray AM, Ryan J Group, A. I., 2021. Trajectories of cognitive function in community-dwelling older adults: a longitudinal study of population heterogeneity. Alzheimers Dement (Amst) 13 (1), e12180. [DOI] [PMC free article] [PubMed] [Google Scholar]
Associated Data
This section collects any data citations, data availability statements, or supplementary materials included in this article.