Abstract
The high background tumor mutation burden in cutaneous melanoma limits the ability to identify significantly mutated genes (SMGs) that drive this cancer. To address this, we performed a mutation significance study of over 1,000 melanoma exomes, combined with a multi-omic analysis of 470 cases from The Cancer Genome Atlas. We discovered several SMGs with co-occurring loss-of-heterozygosity and loss-of-function mutations, including PBRM1, PLXNC1 and PRKAR1A, which encodes a protein kinase A holoenzyme subunit. Deconvolution of bulk tumor transcriptomes into cancer, immune and stromal components revealed a melanoma-intrinsic oxidative phosphorylation signature associated with protein kinase A pathway alterations. We also identified SMGs on the X-chromosome, including the RNA helicase DDX3X, whose loss-of-function mutations were exclusively observed in males. Finally, we found that tumor mutation burden and immune infiltration contain complementary information on survival of patients with melanoma. In summary, our multi-omic analysis provides insights into melanoma etiology and supports contribution of specific mutations to the sex bias observed in this cancer.
INTRODUCTION
Cutaneous melanoma is the most aggressive form of skin cancer. Most frequently it develops on non-acral, sun-exposed skin, linked with DNA damage from ultraviolet radiation (UVR). It can also arise on acral skin, such as the soles of the feet, palms of the hands, and fingernail matrix, where UVR is thought to play a lesser role.1 Melanomas originating from sun-exposed skin display one of the highest tumor mutation burden (TMB) among all malignancies.2–4 The majority of these mutations are UVR-induced C>T transitions occurring at dipyrimidines.5
An important yet poorly understood aspect of melanoma is that males have higher incidence and worse prognosis at all clinical stages.6,7 The mechanisms that mediate these differences remain unclear. Recently, differential expression of a gonosomal gene, PPP2R3B, between sexes in melanoma was proposed to explain some of these differences.8 However, the cumulative effect of X-inactivation-escaping genes on melanoma biology remains largely unknown.
Despite methodological advances in the identification of significantly mutated genes (SMGs)2,9–12, it remains difficult to determine which genes are under positive selection in melanoma. For instance, recent studies have reported a context-specific mutational signature characterized by extremely high mutation rates in ETS transcription factor binding sites.13–16 This phenomenon occurs at cytosines flanked by a specific sequence ([C]TTCCG)13, where transcription factor binding causes conformational changes increasing DNA vulnerability to UVR-induced damage14 and reducing repair efficiency.15,16 Classical trinucleotide mutation models do not account for this context-specific signature12,13, which can lead to spurious evidence of positive selection. Additionally, the large proportion of passenger mutations greatly reduces the statistical power to detect genes under positive selection.2 Previous estimates suggest ~1,000 melanoma exomes are needed to achieve the same sensitivity provided by 200 breast cancer cases.17 The largest integrative analysis of cutaneous melanoma from The Cancer Genome Atlas (TCGA) included 331 cases, identifying 13 SMGs4, and a more recent analysis of 437 cases identified 17 SMGs.12 Thus, a comprehensive catalogue of oncogenes and tumor suppressors is still lacking for cutaneous melanoma.
Here, we performed a mutation analysis of cutaneous melanoma, combining whole exome somatic variants for 1,014 melanomas from five studies2,4,18–20, with integration of the complete melanoma TCGA cohort of 470 cases with copy number, transcriptomic, methylation and clinical data. We controlled for background mutational processes by analyzing samples with different mutational signatures separately and limited the risk of false positives by accounting for ETS-binding sites and other confounding factors. For several identified SMGs, we observed independent evidence of positive selection, such as co-occurring mutations and loss-of-heterozygosity (LOH). The power gained by analyzing over 1,000 melanoma exomes, along with our integrative analysis, facilitated the identification of previously unrecognized SMGs in cutaneous melanoma, uncovered the importance of a male-specific tumor suppressor, DDX3X, and provided insights into the relationship of UVR, TMB, and immune infiltration with patient survival.
RESULTS
Summary of samples
We collected and uniformly annotated whole exome somatic variant calls for 1,014 melanomas (623 males, 390 females, and one unannotated) from four whole exome sequencing studies2,4,19,20 and one whole genome sequencing study18 (Supplementary Tables 1 and 2). The combined cohort comprised 219 primary, 663 metastatic, and 132 unannotated samples. The majority (n = 772) originated on non-acral skin, and the rest were from acral (n = 51), mucosal (n = 14), or of unknown, uncertain, or unavailable origin (n = 177). We referred to a published curated annotation to define non-acral cutaneous melanomas in TCGA.21 Cases from the Hayward et al. study (n = 183) and the majority from TCGA (n = 470) were systemic and radiation treatment naïve prior to tumor sample procurement (Supplementary Table 2). The other cohorts were not restricted to treatment naïve samples2,19,20. Only the TCGA cohort had matching gene expression, methylation and copy number data (Supplementary Table 3).
Identification of significantly mutated genes
We identified SMGs using OncodriveFML11 (OFML), an algorithm that detects positive selection by comparing the average impact score of the mutations in a gene with its expected distribution under the hypothesis of neutral evolution. While OFML uses a permutation approach that controls for variations of the mutation rate across the genome, it relies on a global estimate of the tri-nucleotide background mutation rates. Consequently, we stratified our cohort according to the dominant tri-nucleotide mutational signature in each sample using non-negative matrix factorization (NMF). The optimal NMF decomposition consisted of three mutational signatures (Extended Data Fig. 1a–d), which we compared to a set of 65 pan-cancer signatures from the COSMIC database (Extended Data Fig. 1f, g).22 Our first signature matched UVR-associated mutational signatures (SBS7a and 7b) that dominated the majority of non-acral cutaneous melanomas (Extended Data Fig. 1e). Our second signature was a mixture of an aging-associated signature (SBS1) and another signature of unknown etiology (SBS39), most prevalent in acral and mucosal melanomas (Extended Data Fig. 1d, e, g). Our third signature corresponded to an alkylating agent-associated mutational signature (SBS11) dominant in 13 samples, likely due to prior treatment with an alkylating agent (Extended Data Fig. 1d). We performed separate mutation significance analyses on UVR-high (>50% UVR-mutations, n = 824) and UVR-low samples (≤50% UVR-mutations, n = 177), excluding samples with a dominant alkylating signature (n = 13).
OFML employs the CADD score23, which combines multiple annotations (e.g. conservation measures such as phyloP24 and protein-level scores such as SIFT25) into a single metric to reflect the relative functional impact of any single nucleotide change. It does not explicitly distinguish between gain-of-function (GoF) and loss-of-function (LoF) mutations. To improve our ability to detect tumor suppressor genes (TSGs), we used an additional score that considers high confidence LoF mutations (frameshifts, loss of translation start sites, premature stop codons, and splice site mutations).2
We identified 38 SMGs (false discovery rate (FDR) < 1%) in our combined OFML analyses (Supplementary Table 4 and Extended Data Fig. 2a–d). These included established melanoma oncogenes and tumor suppressors in pathways related to RTK-RAS-MAPK kinase signaling (BRAF, NRAS, NF1, KIT, MAP2K1, RAC1), apoptosis and cell cycle (TP53, CDKN2A, RB1, CDK4), PI 3-kinase signaling (PTEN), immune evasion (B2M), epigenetic regulation (ARID2), and mRNA splicing (SF3B1) (Fig. 1a, b, Extended Data Fig. 2e). Comparing mutational frequencies across acral, mucosal, and UVR-high and -low non-acral cutaneous melanomas, we observed that KIT and SF3B1 were found significantly mutated only in the UVR-low analysis (Extended Data Fig. 2d) and had higher mutation frequency in mucosal melanomas (~21% [3 of 14] for SF3B1 and ~14% [2 of 14] for KIT), as reported previously (Extended Data Fig. 2f).18 Although KIT mutations were more frequent in acral (~8% [4 of 51]) compared to non-acral cutaneous melanomas (~4% [29 of 772])26,27, the UVR-low subset of non-acral cutaneous melanomas had a KIT mutation frequency comparable to acral melanomas (~10% [8 of 82]; Extended Data Fig. 2g).26
Figure 1. The landscape of somatic driver mutations in melanoma.
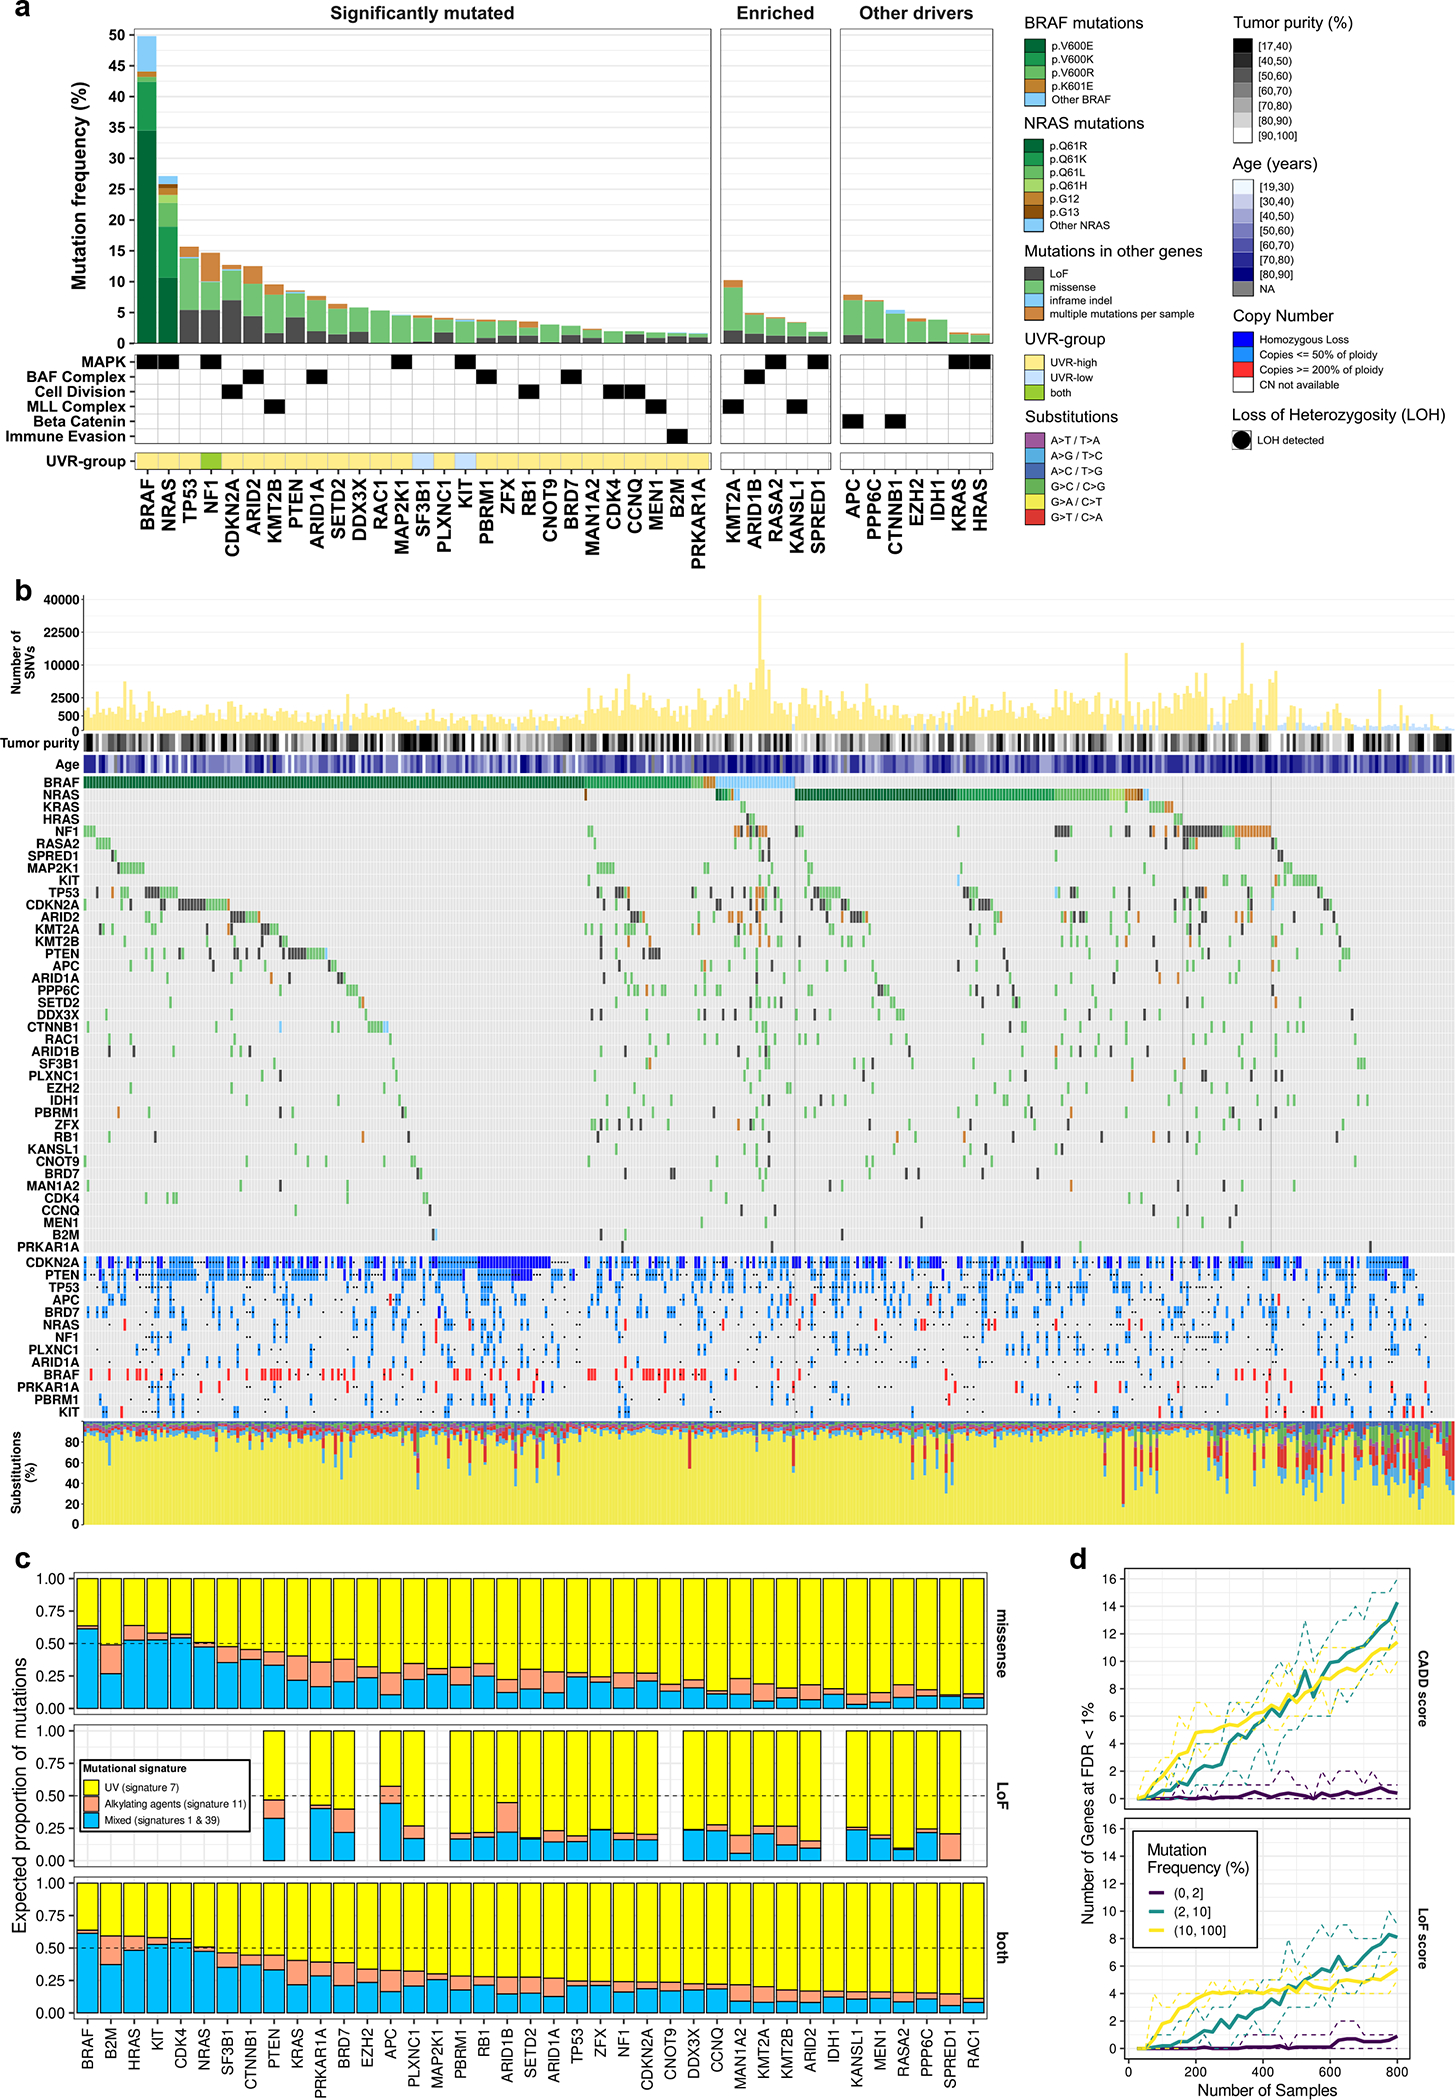
(a) Gene mutation frequencies in 1,014 melanoma tumors. Select biological roles are indicated by black boxes. The significantly mutated set (n = 27 genes) comprises genes inferred to undergo positive selection (OFML FDR < 1%). The UVR-group colour bar indicates whether a gene is significantly mutated in UVR-low or UVR-high tumors. The enriched set (n = 5 genes) comprises genes which passed a less conservative OFML FDR cut-off (<10%), selected based on their involvement in MAPK signalling, BAF, and MLL protein complexes. The other drivers set (n = 7 genes) comprises genes previously linked to melanoma. (b) Mutation and DNA copy number profiles of melanomas from the TCGA (n = 449 tumors). From top to bottom: (1) Number of single nucleotide variants (y-axis) per tumor (x-axis), plotted on a square root scale. (2) Tumor purity inferred by ABSOLUTE. (3) Patient age at the time of tumor sample procurement. (4) Gene-by-tumor matrix of mutations in significantly mutated genes, enriched genes, and other drivers. (5) Gene-by-tumor matrix of copy number alterations in genes that exhibited co-occurrence of mutations and loss-of-heterozygosity (LOH) or DNA copy gain (p<0.05; one-tailed Fisher’s exact test). (6) Single nucleotide substitution frequencies per tumor. (c) Proportion of mutations per gene attributed to each mutational signature identified by NMF (n = 1,014 tumors). (d) Saturation analysis of SMG detection using OFML with CADD or LoF scores. The y-axes show the mean number of SMGs detected (FDR < 1%) across ten random subsamples of a given sample size, indicated on the x-axis. Genes are stratified by mutation frequency in UVR-high tumors (n = 824 tumors). Dotted lines correspond to the min and max values observed across the 10 replicates.
Filtering potential false positives
While OFML and similar well-established algorithms2,9–11 have demonstrated their proficiency in the identification of cancer driver genes, their mutational models remain a simplification of a more complex and heterogeneous process. For instance, several ETS binding sites exhibit high neutral mutation rates in melanoma (Extended Data Fig. 3a). This can lead to recurrent mutations that do not confer a selective advantage,13–16 but still deviate from background mutational models. While these mutations are usually located near the transcription start sites of actively transcribed genes, they can overlap with the coding region of low or non-expressed isoforms and be mis-annotated as non-synonymous variants. We believe this to be the case for STK19, SLC27A5, and SUCO among our SMGs (Extended Data Fig. 3b, c). We also observed nine SMGs (PDE7B, KCNQ, RNF217, SLC27A5, IVL, DACH1, RUNX1T1, HS3ST4, and DSPP) that had extremely low mRNA abundance and/or high neutral mutation rates (Extended Data Fig. 3d,e), two well-known discriminative features of false positives.10 We omitted these genes from downstream analyses.
Significantly Mutated Genes
Our SMG analysis highlighted evidence of positive selection for the recently reported candidate oncogene CNOT9/RQCD128 (mRNA helicase), the candidate tumor suppressor SETD219 (histone lysine methyltransferase), and members of the SWI/SNF (BAF) complex family, ARID1A and BRD7.2,12,19 Here, we report significant enrichment of LoF mutations in an additional member of the SWI/SNF complexes, PBRM1, in ~4% of melanoma cases. Altogether, SWI/SNF complex subunits highlighted by our study (ARID2, ARID1A, ARID1B, PBRM1, and BRD7) exhibited LoF mutations in >12% of melanoma samples (Extended data Fig. 4c). We also observed LoF mutations in a transmembrane receptor for semaphorins, PLXNC1, in ~5% of cases. Finally, the cAMP-protein kinase A (PKA) signaling pathway is known to play an important role in melanoma; however, driver somatic mutations affecting this pathway have remained elusive.29 We observed a significant enrichment of LoF mutations in PRKAR1A, a regulatory subunit of the cAMP-dependent PKA holoenzyme, which were found in ~2% of samples. PRKAR1A loss is known to activate PKA signalling and is observed in an autosomal dominant syndrome called Carney Complex, which is associated with the development of multiple neural-crest-derived tumors.30 Over 50% of mutations in most SMGs were likely acquired due to UVR mutagenesis (Fig. 1c). Our significance analysis omitted several established melanoma-associated genes, possibly due to their low mutation frequency or the limitations of OFML, and a saturation analysis suggests that additional low frequency driver genes would be uncovered in larger cohorts (Fig. 1d). These genes included APC, CTNNB1, EZH2, IDH1, KRAS, HRAS and PPP6C (Fig. 1a, b). We considered these genes false negatives and included them in downstream analyses.
To identify trending genes that did not meet our 1% FDR significance cut-off, we performed gene set enrichment analysis (GSEA) on 75 genes with an OFML FDR <10%. We found an expected enrichment of MAPK pathway genes (Extended data Fig. 4a), including two recently reported RASopathy genes with tumor suppressor functions, SPRED1 and RASA2.19,31 We identified one member of the mixed-lineage leukemia (MLL) complex family, KMT2B, as significantly mutated, and an enrichment for other members, KMT2A, MEN1, and KANSL1 in our mutation analysis (Extended data Fig. 4b). These MLL complex genes collectively exhibited LoF mutations in ~7% of samples (Extended data Fig. 4c).
Finally, three SMGs identified at <1% FDR were located on the X chromosome: DDX3X (a DEAD-box RNA helicase), CCNQ/FAM58A (the activating cyclin for CDK10), and ZFX (a C2H2 zinc finger transcription factor).3,4,12 Despite sex being one of the strongest independent prognostic factors in melanoma,6,7 sex differences in driver mutations have not yet been reported in melanoma.
DDX3X is a sex-specific tumor suppressor in cutaneous melanoma
Some tumor suppressors escape X chromosome inactivation (XCI), which has been proposed to explain the protective effect of the X chromosome against cancer.32 We compared TMB between sexes and observed lower values for autosomes in females relative to males (Fig. 2a).33 We observed no significant difference for the X chromosome, likely explained by the accumulation of mutations on the additional copy in females (Fig. 2a). We compared the mutation frequency of the SMGs identified in our analysis and observed that autosomal SMGs were mutated more frequently in males than females, but these differences were not statistically significant when controlling for the difference in TMB between sexes (Fig. 2b and Supplementary Table 5). The three X-linked SMGs, DDX3X, CCNQ and ZFX were also more frequently mutated in males (Fig. 2b). This was unexpected given the similar TMB observed between sexes for the X chromosome. DDX3X showed the only significant imbalance in our analyzed cohort (FDR < 1%; two-tailed Fisher’s exact test), with its LoF mutations (n = 19) found exclusively in males (Fig. 2c). This result remained significant when controlling for age, study, and TMB using a logistic regression approach (Extended Data Fig. 5a).
Figure 2. DDX3X is enriched in loss-of-function (LoF) mutations in males and escapes X-inactivation in females.
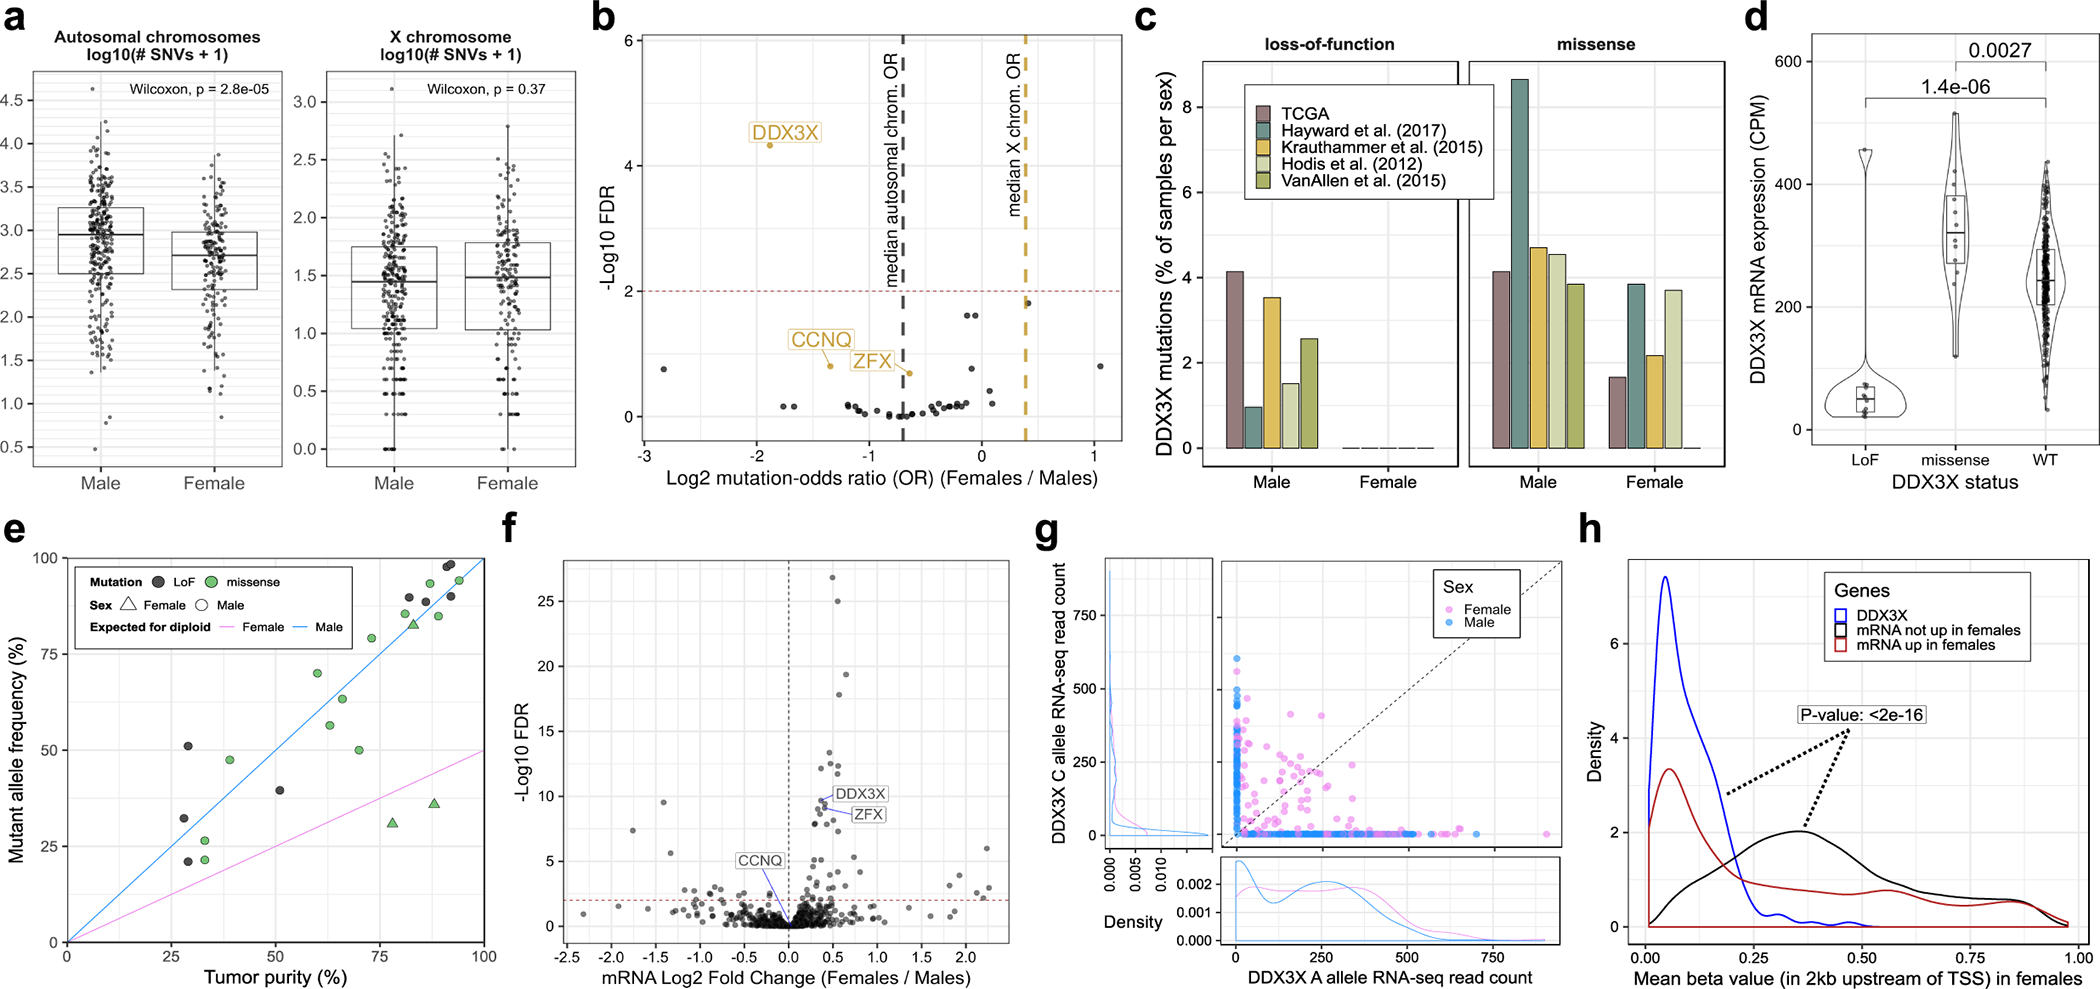
(a) Box and whisker plots showing the number of autosomal and X-chromosome single nucleotide variants (SNVs) in male (n = 623) and female (n = 390) melanoma tumors. Each point represents one tumor. Boxes indicate the first, second, and third quartiles. Whiskers extend to the minimum and maximum data points, no further than 1.5 times the inter-quartile range from the hinges. P-values are from a two-tailed Wilcoxon rank sum test. (b) Volcano plot showing the relationship between patient sex and the mutation frequencies of 39 driver genes considered in this study. Each point represents one gene. X-linked genes are labelled in gold. The x-axis shows the odds ratio (OR) of mutation in females (n = 390 tumors) relative to males (n = 623 tumors). The y-axis corresponds to FDR-adjusted p-values from a two-tailed Fisher’s exact test of divergence from the expected OR, denoted by a dark grey dotted line for autosomal genes and gold dotted line for X-linked genes. A horizontal red dotted line marks the FDR cut-off of 1%. (c) Frequency of DDX3X LoF in females and males, stratified by patient cohort. (d) Box and whisker plot of DDX3X mRNA expression in male TCGA tumors, stratified by DDX3X mutation status (nLoF = 12; nmissense = 12; nWT = 265 tumors). Each point represents one tumor. Box plot elements are described in (a). Violin widths correspond to the density of points. P-values are from a two-tailed Wilcoxon rank sum test comparing mRNA expression levels between DDX3X wild-type (WT) and mutant tumors. (e) Allele frequencies of DDX3X mutations in TCGA tumors plotted against tumor purity (i.e. proportion of cancer cells) (n = 24 tumors). Each point represents one tumor. The diagonal lines represent the expected allelic frequencies for clonal mutations in males and heterozygous females. (f) Volcano plot showing differences in mRNA expression of 757 X-linked genes between females (n = 174 tumors) and males (n = 273 tumors) from the TCGA cohort. Each point represents one gene. The x-axis corresponds to the difference in mean expression relative to males and the y-axis shows FDR-adjusted p-values (using the Benjamini-Hochberg procedure). The horizontal red dotted line marks an FDR cut-off of 1%. The fold-changes and FDR values were estimated using DESeq2, parameterized to perform a two-tailed Wald test on negative binomial generalized linear model coefficients. (g) Number of RNA-seq reads supporting the A (x-axis) and C (y-axis) alleles of SNP rs5963957 at the DDX3X locus in the TCGA cohort (n = 468 tumors). Each point represents one tumor. Density plots show the distribution of points along the x- and y-axes separately for males and females. (h) Distribution of mean DNA methylation at the DDX3X promoter in female tumors (blue line; n = 180 tumors) compared to the promoters of other X-linked genes either upregulated (red line; n = 7,200 promoters across 180 tumors), or not upregulated (black line; n = 98,916 promoters across 180 tumors) in females compared to males. Blue and black distributions were compared using a one-tailed Kolmogorov-Smirnov test for a rightward shift in the black distribution relative to the blue distribution. TSS is an acronym for transcription start site.
LoF mutations in DDX3X were associated with a decrease in its mRNA expression (Fig. 2d). A comparison of mutated allele frequencies with tumor sample purity derived computationally by ABSOLUTE suggests that most DDX3X LoF mutations are homozygous clonal (Fig. 2e), indicating they likely occurred prior to clonal expansion. Our NMF mutation signature analysis revealed ~75% of DDX3X mutations are attributable to UVR (Fig. 1c).
We examined all X-linked genes for differential expression between sexes and identified 45 genes significantly upregulated in females (Fig. 2f), which suggests they escape XCI. DDX3X expression was ~1.3-fold higher in melanomas from females (FDR < 1%). We observed biallelic expression of a common single nucleotide polymorphism (rs5963957) located in DDX3X (Fig. 2g). Furthermore, upregulated X-linked genes, and specifically DDX3X, had lower levels of promoter methylation (Fig. 2h). These results indicate that females are protected against complete loss of DDX3X in the event of a single mutation, as opposed to males, which could explain some of the observed sex bias in melanoma incidence and outcomes.
To gain insight into the biological consequences of DDX3X mutations in melanoma, we compared mRNA expression profiles of wild-type samples to those harboring LoF and missense DDX3X mutations in TCGA. We controlled for potential confounding factors, such as tumor purity, and confined our analysis to male samples. We identified 57 upregulated and 10 downregulated genes (FDR < 20%) (Fig. 3a), including DVL1, which exhibited 50% upregulation in mutant samples. DVL1 is a regulator of the WNT/β-catenin signaling axis, one of the best-characterized DDX3X-regulated pathways.34 Given the high genetic heterogeneity in these tumors, we sought additional evidence supporting these mutant DDX3X associated changes. We analysed public RNA-Seq data of DDX3X knockdown in three cell lines (K562, HepG2, and the melanoma cell line, HT144).35,36 We observed substantial concordance between expression differences in these lines and tumors (Extended Data Fig. 5b, c).
Figure 3. Genes and pathways dysregulated as a result of DDX3X mutations.
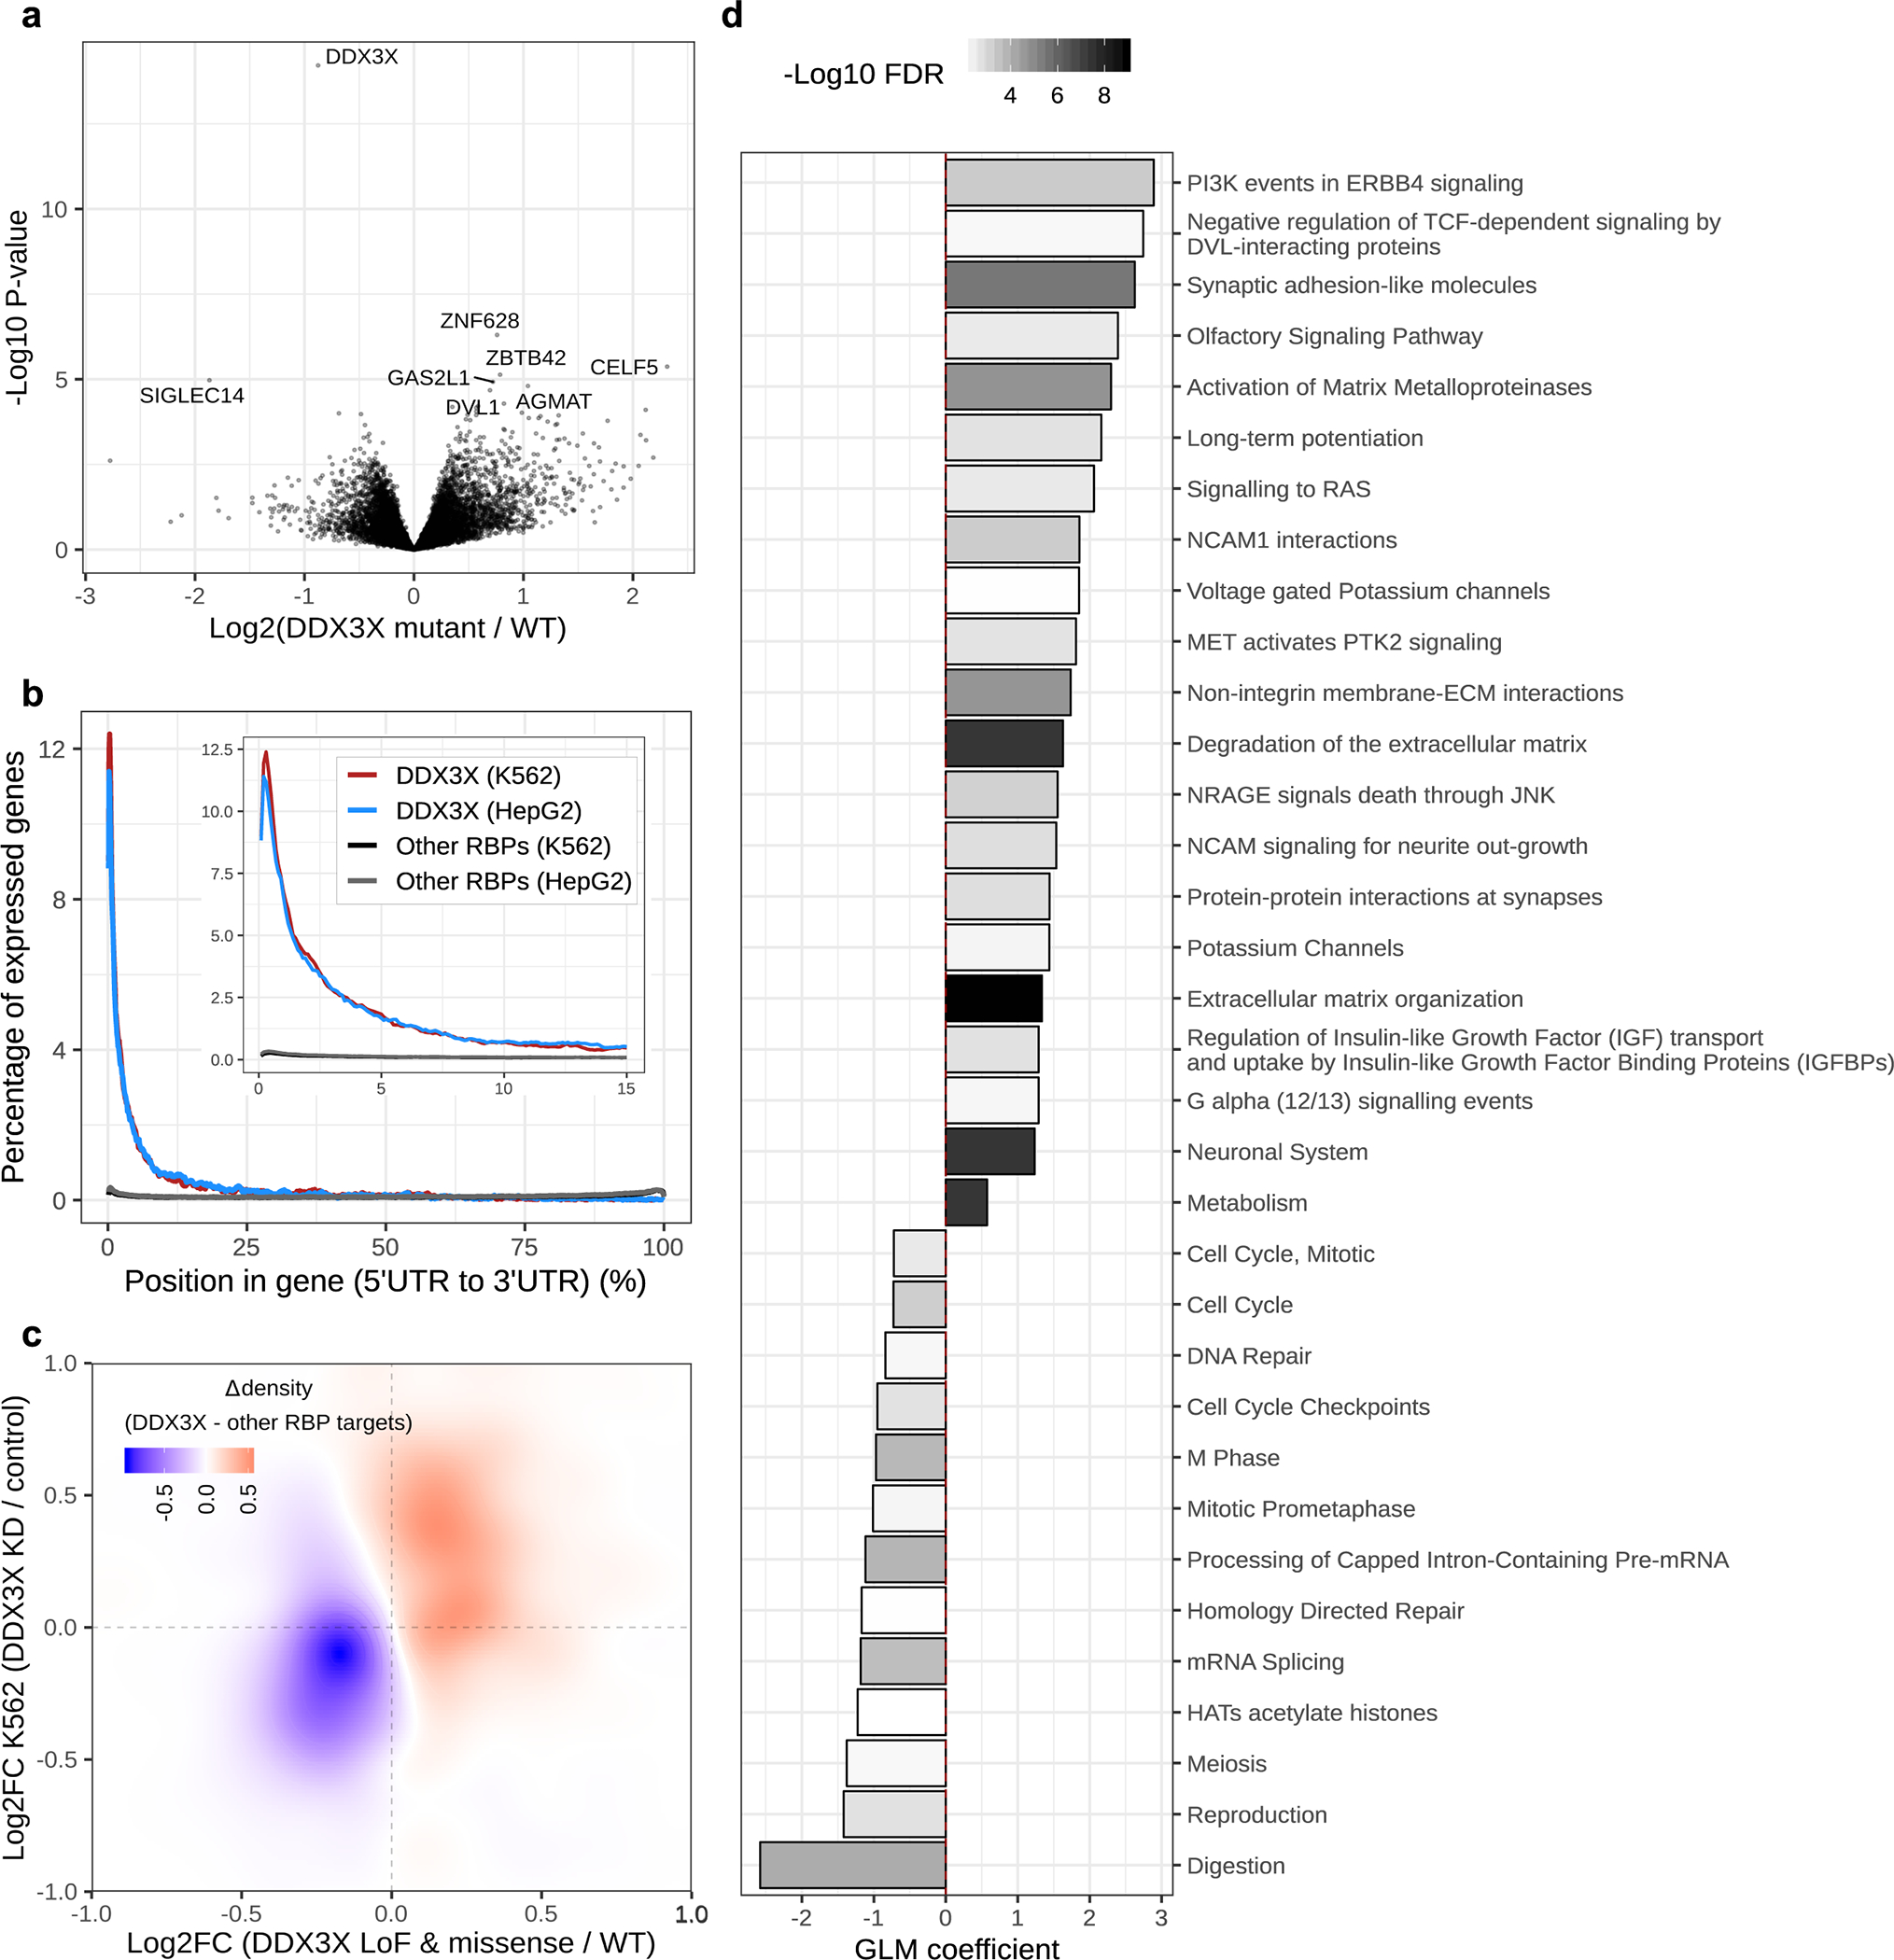
(a) Volcano plot showing differences in mRNA expression of genes between DDX3X mutant and wildtype (WT) male tumors from the TCGA cohort (n = 22 mutant; n = 167 wildtype tumors). Each point represents one gene. The x-axis shows to the log2 fold-change in mean expression relative to WT samples, and the y-axis shows corresponding p-values (unadjusted). Eight genes with the smallest p-values are labelled on the plot. Fold-changes and p-values were estimated using the Limma R package, parameterized to perform a two-tailed t-test on linear model coefficients. (b) Distribution of eCLIP peaks for DDX3X, and other RNA binding proteins (RBPs), along transcripts in K562 and HepG2 cell lines. The x-axis corresponds to the gene length percentile, beginning at the 5’UTR. The y-axis shows the proportion of genes with overlapping RNA binding protein (RBP) peaks at a given percentile relative to the total number of genes bound by the RBP. (c) A heatmap showing the difference in densities of differentially expressed DDX3X targets in TCGA tumors (x-axis) and K562 cells (y-axis), relative to the targets of other RBPs (n = 22 DDX3X mutant tumors, n = 164 DDX3X wildtype tumors; n = 2 biological replicates of DDX3X knockdown, n = 2 biological replicates of non-targeting controls in K562 cells; n = 1,196 DDX3X targets, n = 2,808 other RBP targets). (d) Gene set enrichment analysis (GSEA) of mutant DDX3X-associated transcriptional changes in male melanomas from the TCGA (n = 22 mutant tumors, n = 164 WT tumors). The x-axis corresponds to the effect size (i.e. the coefficient from a logistic regression GLM). A positive or negative effect size indicates whether a gene set on the y-axis is upregulated or downregulated upon DDX3X loss, respectively. The colour of each bar indicates the FDR-adjusted p-value (using Benjamini-Hochberg procedure) associated with the effect size. Only pathways which passed an FDR cut-off of <1% and were concordantly dysregulated in HT144 cells after DDX3X knockdown (p < 0.05) are shown (n = 2 biological replicates of knockdown, n = 2 biological replicates of non-targeting controls). GLM coefficient p-values were computed using a two-tailed z Wald test.
Considering DDX3X is a DEAD-box protein family member that has ATP-dependent RNA helicase activity37, we used enhanced crosslinking and immunoprecipitation (eCLIP) data from ENCODE project to examine whether DDX3X binding sites are enriched in differentially expressed genes.35,38 Given the strong positional enrichment of DDX3X peaks in 5’UTRs (Fig. 3b), we defined a set of DDX3X target genes, whose 5’UTRs overlap DDX3X binding sites. We compared these to a set of control genes, whose 5’UTRs overlap at least one binding site from a compendium of RNA binding proteins (RBPs), to account for potential biases associated with eCLIP experiments. In both cell lines and tumors, we observed enrichment of DDX3X targets in genes upregulated due to DDX3X knockdown or mutation compared to the control gene set (Fig. 3c, Extended Data Fig. 5d).
To identify pathways impacted by DDX3X mutations, we performed GSEA on DDX3X-associated gene expression differences in melanomas from TCGA. We identified 100 gene sets exhibiting differential regulation (FDR < 1%). Overall, 34 were concordantly differentially regulated in the HT144 melanoma line (p < 0.05) (Fig. 3d). Upregulated gene sets were related to metastatic processes, as well as RAS, PI3K, β-catenin and neuronal signaling pathways. Downregulated gene sets were involved in cell cycle processes and RNA metabolism. Altogether, this analysis suggests that DDX3X loss is associated with de-differentiation, invasiveness and reduced proliferation, consistent with a recent functional study.36
The DNA copy number landscape of cutaneous melanoma
The landmark melanoma TCGA study analyzed copy number data from 331 melanomas.4 To gain insight into additional genetic driver events targeted by copy number alterations, we obtained estimates of tumor purity, ploidy, and genome-wide copy number for the TCGA cohort using ABSOLUTE39 (Fig. 4). We confirmed that our copy number calls are positively correlated with mRNA expression of driver genes (Fig. 4b). Overall, the most frequent chromosome arm alterations included gain of 6p (40%), 7q (40%), 1q (35%), 7p (35%), and 8q (32%); and loss of 9p (63%), 10q (50%), 6q (45%), 10p (40%), 9q (38%), and 11q (32%) (Fig. 4c). None of the examined autosomal arms were completely lost (Fig. 4 e, f). Recurrent focal homozygous loss was observed for a few genes, including CDKN2A (25%), PTEN (5%), LINC00290 (3%), and SPRED1 (1%) (Fig. 4d). Most LOH events in samples that have undergone genome duplication were copy-neutral (i.e. at loci with a copy number of 2) (Fig. 4 e, f), supporting the notion they occur prior to genome duplication.39
Figure 4. The landscape of somatic DNA copy number alterations in cutaneous melanoma.
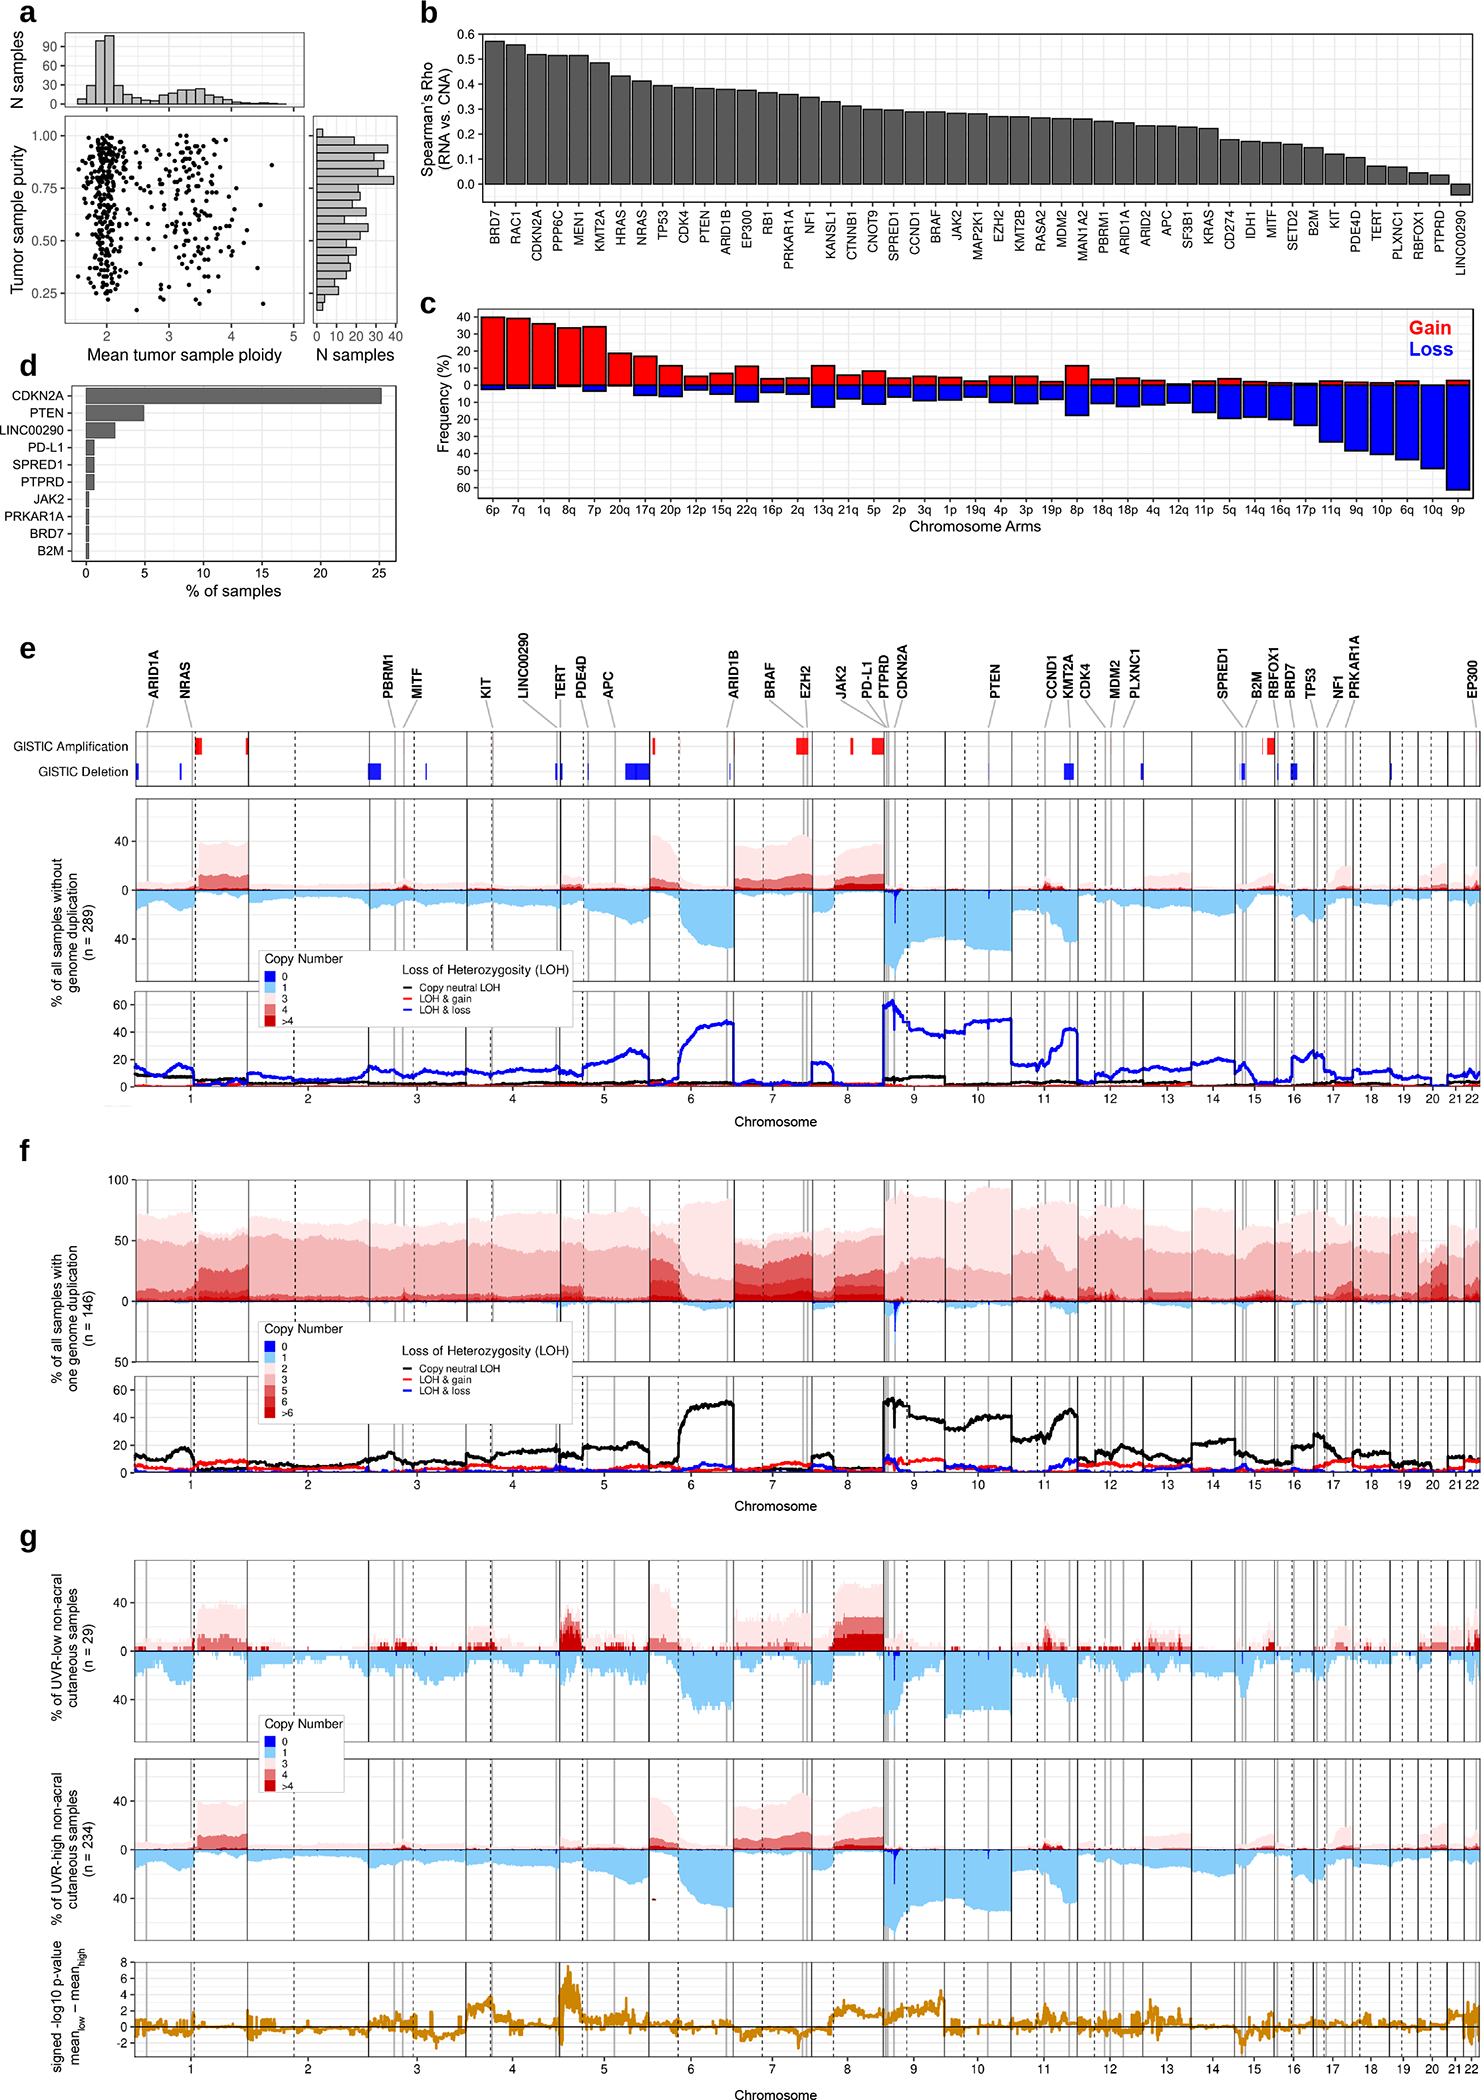
(a) Scatter plot with marginal histograms showing the distribution of mean tumor sample ploidy (x-axis) and purity (y-axis), inferred using ABSOLUTE (n = 449 tumors from the TCGA). (b) Bar plot showing the Spearman correlation between gene RNA expression (from Kallisto) and relative copy number (n = 448 tumors). The plot includes all 36 autosomal drivers considered in this study, and genes highlighted by the TCGA’s 2015 GISTIC analysis of DNA copy number alterations in melanoma (GISTIC-2015 genes). (c) Bar plot showing the gain and loss frequencies of autosomal chromosome arms, defined for each arm by the sign of the difference between its median copy number and the overall median copy number in a tumor (n = 449 tumors). (d) Bar plot showing the homozygous deletion (HD) frequencies of SMGs and GISTIC-2015 genes that have one or more HDs in 449 TCGA tumors. (e) Genome-wide frequencies (in 10kb bins) of copy number alterations in all TCGA melanomas without genome duplication (n = 289 tumors). From bottom to top: (1) Genome-wide frequencies of loss-of-heterozygosity (LOH) and (2) DNA copy number. (3) Significantly amplified or deleted genomic regions (q-value < 0.01), identified here using GISTIC version 2.0 (a right-tailed permutation test performed independently for gains and losses, with p-values adjusted for multiple testing using the Benjamini-Hochberg procedure). GISTIC was run on 470 TCGA tumors. (4) Genomic loci for a subset of the 36 autosomal driver genes considered in this study that overlapped significant GISTIC regions, exhibited homozygous deletion in one or more samples, or whose mutations co-occurred with LOH or copy gain. GISTIC-2015 genes are also shown. (f) Genome-wide frequencies (in 10kb bins) of copy number alterations in all TCGA melanomas that have undergone one genome duplication (n = 146 tumors). (g) Genome-wide frequencies (in 10kb bins) of copy number alterations in non-acral cutaneous TCGA melanomas without genome duplication. The top and middle panels contain UVR-low and UVR-high tumors, respectively (n = 29 UVR-low tumors, n = 234 UVR-high tumors). The bottom panel shows the unadjusted p-values from a two-tailed Fisher’s exact test comparing UVR-low and UVR-high distributions in each genomic bin, multiplied by the sign of the difference in mean copy number between the groups, such that a positive value indicates a higher copy number in the UVR-low group.
We compared the copy-number profiles of UVR-high and UVR-low non-acral cutaneous melanomas. We observed chromosome arms 4p, 5p, 8q, 11q, and 22q were more frequently amplified in UVR-low cases (Fig. 4g), while chromosome arm 9q was more frequently deleted in UVR-high cases. Finally, a region of 15q overlapping SPRED1 and B2M was preferentially deleted in UVR-low melanomas.
We observed statistically significant co-occurrence between segmental LOH and LoF mutations in several tumor suppressors including B2M, MEN1, CDKN2A, PTEN, TP53, APC, NF1, and RB1 (Fig. 5a, Supplementary Table 6). In addition, BRD7 (OR = 10.40, P = 2.57×10⁻³), PLXNC1 (OR = 7.36, P = 8.01×10⁻³), and PBRM1 (OR = 6.07, P = 1.89×10⁻²) also exhibited association between LOH and LoF mutations. All PRKAR1A LoF mutations were concurrent with LOH (P = 2.75×10−04). Similarly, we observed significant co-occurrence between DNA copy gain and recurrent amino acid substitutions in three activators of the MAPK signalling pathway: KIT, BRAF, and NRAS (Fig. 5b, Supplementary Table 6). Overall, the frequency of local copy loss of SMGs was positively correlated with their enrichment of LoF mutations (Fig. 5c, d). Finally, we used GISTIC40 to identify significantly recurrent copy number alterations (q-value < 0.01) (Supplementary Tables 7, 8). Three SMGs (CDK4, KIT, and BRAF), in addition to EZH2, overlapped significantly amplified regions, and four SMGs (BRD7, B2M, CDKN2A, and PTEN), in addition to SPRED1 and KMT2A, overlapped significantly deleted regions (Fig. 4e).
Figure 5. Co-occurrence of copy number alterations and mutations in driver genes.
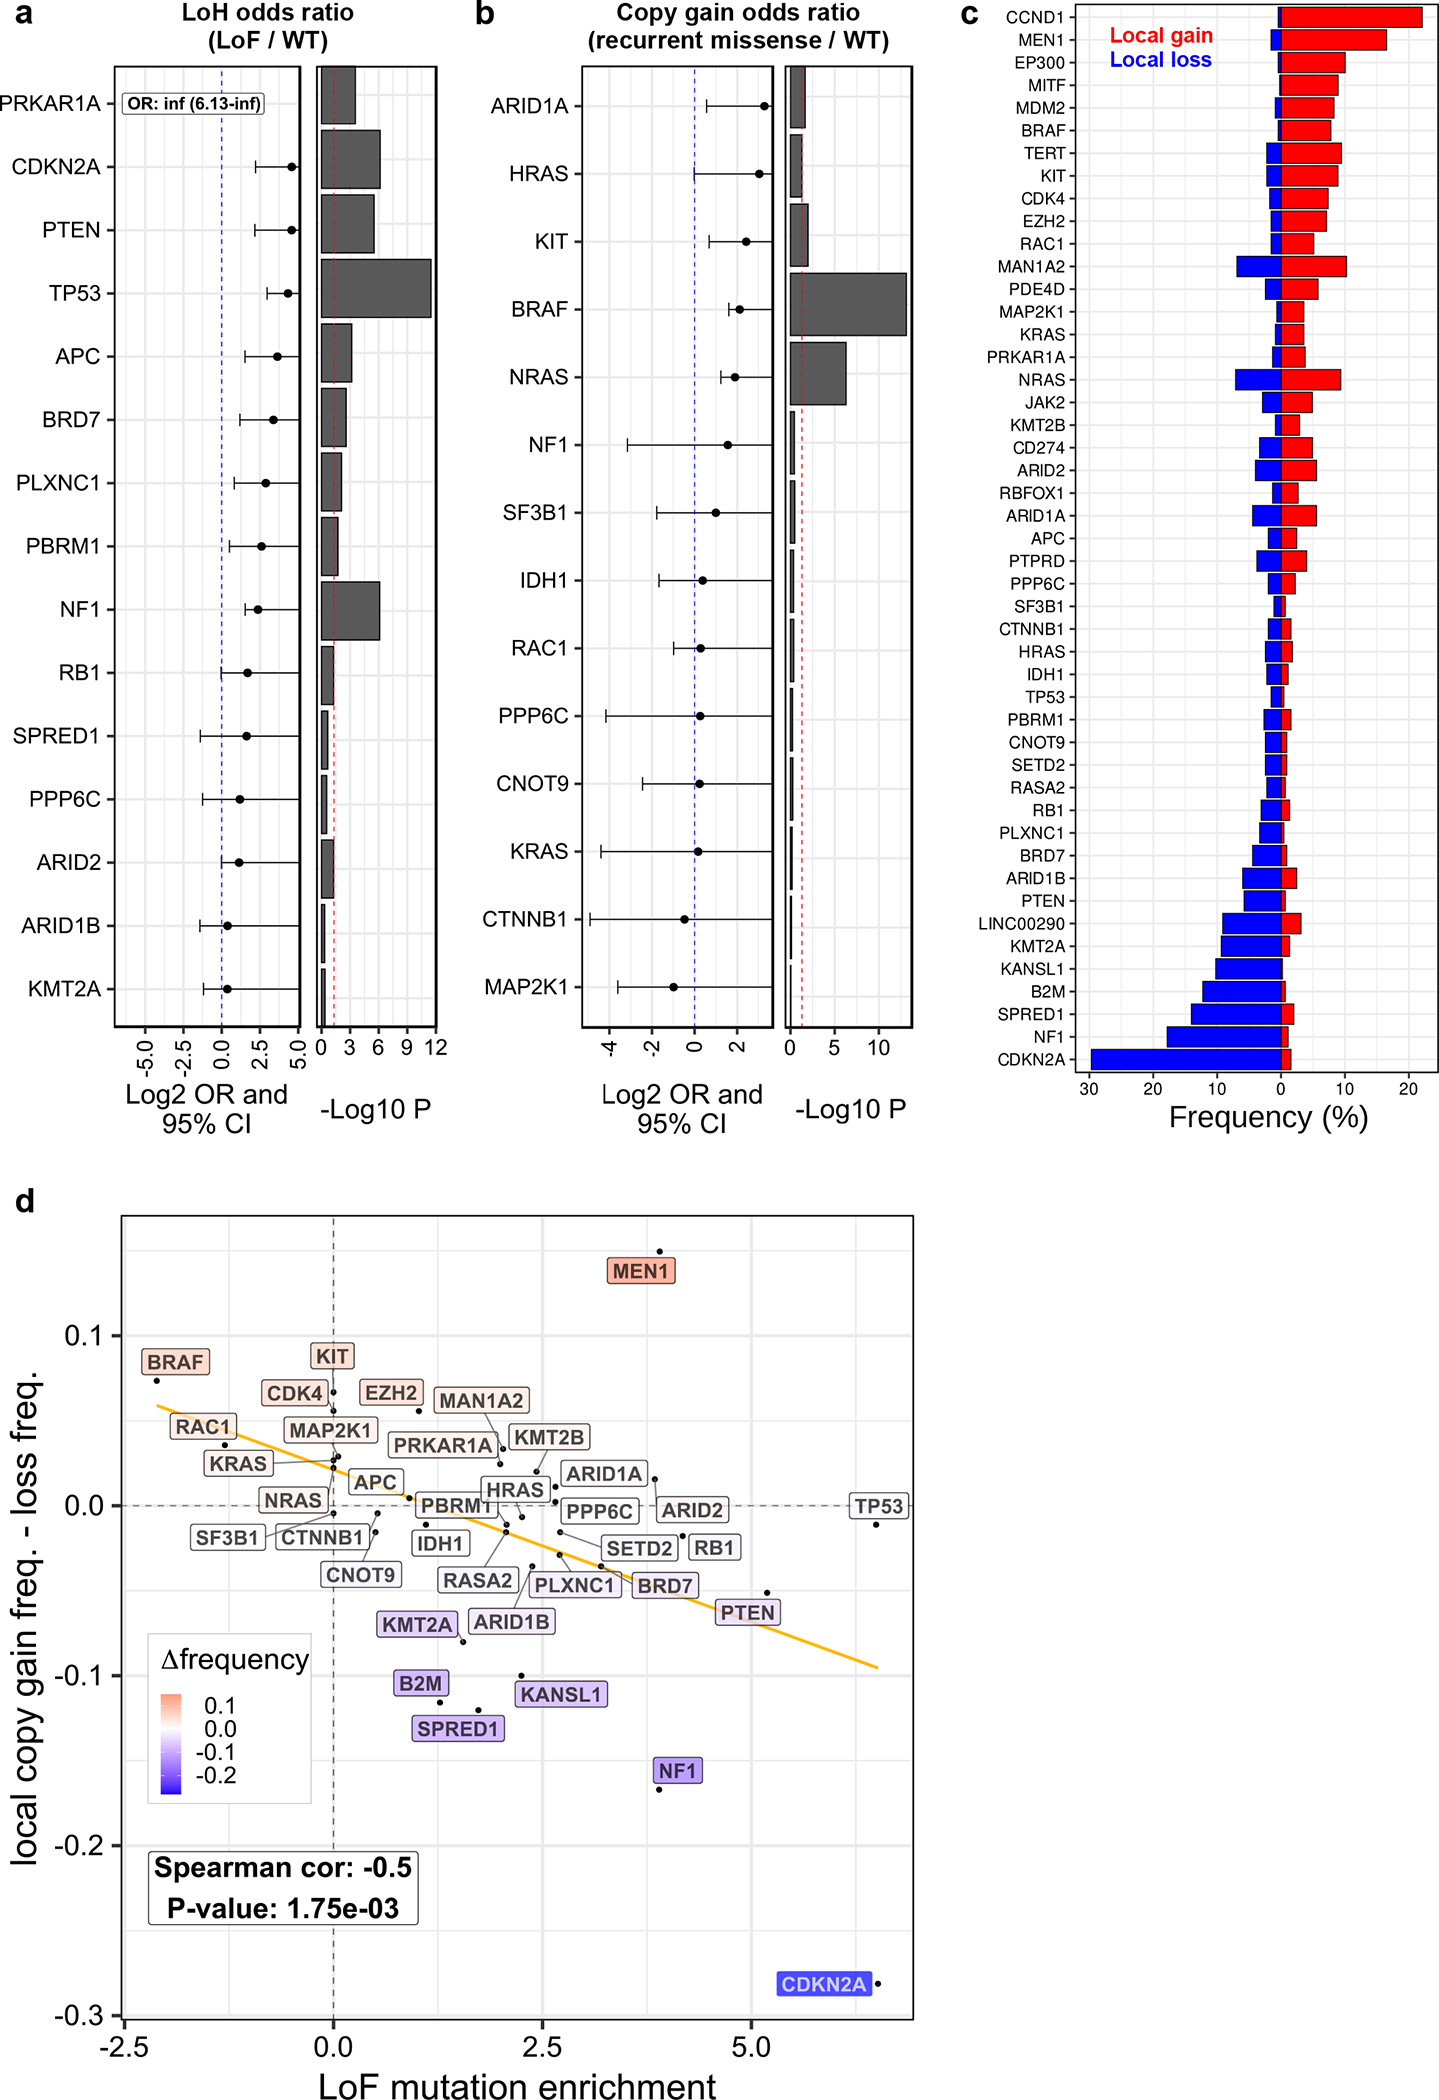
(a) Forest plot showing the odds-ratio of co-occurrence between loss-of-function (LoF) mutations and segmental loss-of-heterozygosity (LOH). The p-values are from a right-tailed Fisher’s exact test. A vertical red dotted line marks a p-value of 0.05. (b) Forest plot showing the odds-ratio of co-occurrence between recurrent missense mutations and segmental copy gain. The p-values are from a right-tailed Fisher’s exact test. A vertical red dotted line marks a p-value of 0.05. For panels (a) and (b), only a subset of the 36 autosomal driver genes with 3 or more mutations and 3 or more copy number alterations and a Fisher’s test p-value less than one are shown. Per gene sample sizes are provided in Supplementary Table 6. (c) Bar plot showing the frequency of local gain and loss in driver genes. Shown here are all 36 autosomal drivers considered in this study, and GISTIC-2015 genes. Local gain and loss were defined per sample for each gene by the sign of the difference between its absolute copy number and the median absolute copy number of its host arm (n = 449 tumors). (d) Scatter plot showing the relationship between the local deletion of genes (y-axis) and enrichment of LoF mutations (x-axis). Each point corresponds to one gene. The correlation p-value was computed using a two-sided Spearman’s test via the asymptotic t approximation (n = 36 genes).
Deconvolution of melanoma intrinsic and extrinsic expression profiles
To gain insight into the relationship between the mutational landscape and transcriptome, we screened for associations between driver gene alterations and cancer-cell intrinsic mRNA signatures. Previous studies used unsupervised clustering of mRNA profiles to group melanomas based on their dominant gene expression signatures.4,41 Four major signatures have been found in cutaneous melanoma: immune, keratin, MITF-Low, and MITF-high. Because some of these signatures can originate from stromal and immune cells, tumor purity can greatly impact transcriptomic grouping. Our analysis of tumor purity across TCGA samples revealed melanoma tumors vary widely in their stromal cell content (interquartile range of 15%−49%; Fig. 6a). Strong negative correlations were observed between tumor purity and expression for a large number of genes (Fig. 6b), implying a significant proportion of variance in expression reflects stromal cell content variations rather than differences in cancer cell gene expression.
Figure 6. Deconvolving melanoma and stromal mRNA expression in bulk tumor samples.
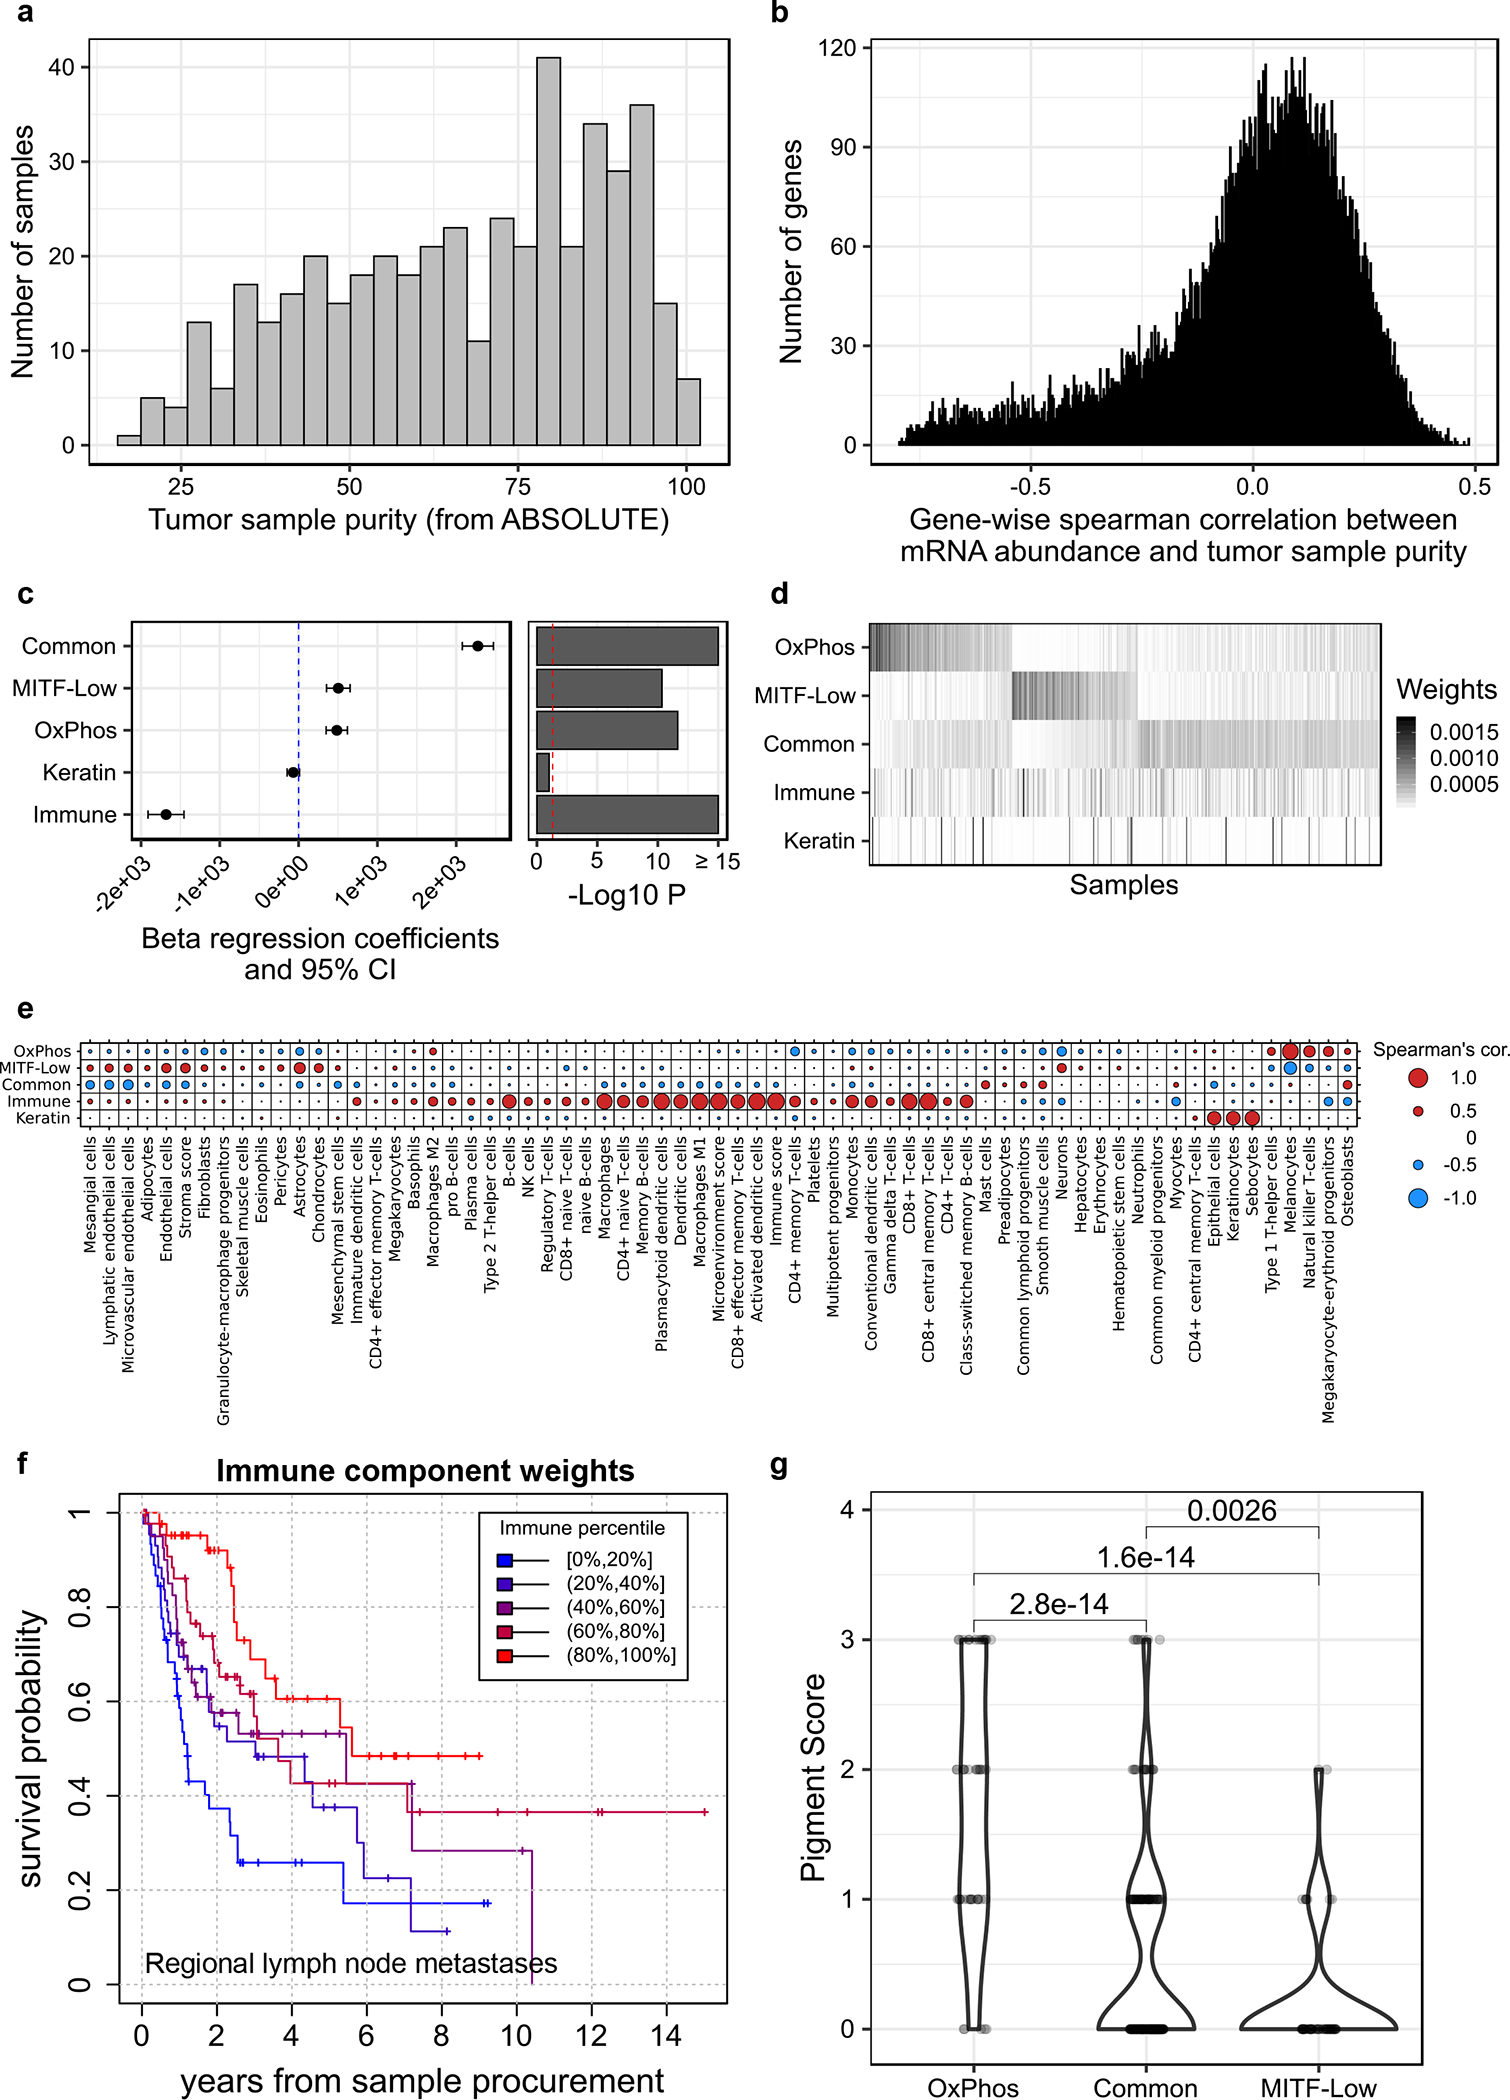
(a) Histogram of tumor purity (proportion of cancer cells) in TCGA melanomas, estimated using ABSOLUTE (n = 449 tumors). (b) Histogram of correlations between tumor purity and mRNA expression, per gene (n = 447 tumors, n = 17,481 genes). (c) Forest plot of the coefficients of a multivariable beta regression between all five NMF signature weights and tumor purity, with their associated 95% confidence intervals (CI) and unadjusted p-values (computed using a two-tailed z Wald test of coefficients) (n = 447 tumors). (d) Matrix of NMF signature weights across tumors. Each row corresponds to a signature, and each column to a tumor sample (n = 468 tumors). (e) Spearman’s correlation between the weights of each NMF signature across samples and each of 64 cell-type specific signature weights measured per sample using xCell (n = 468 tumors). (f) Kaplan-Meier survival curves for TCGA melanoma patients with a metastatic regional lymph node tumor sample, stratified according to immune signature weight (n = 216 patients). (g) Distribution of tumor pigmentation scores in three melanoma intrinsic mRNA subgroups. P-values are from a two-tailed Wilcoxon rank sum test (nOxPhos = 47, nCommon = 205, nMITF-low = 59 tumors). Violin widths correspond to the density of data points at a given pigmentation score.
To untangle cancer-cell-intrinsic and -extrinsic mRNA signatures, we applied NMF to gene expression data from 468 TCGA samples. In contrast to partitional clustering, NMF considers samples as a mix of k unknown signatures and proceeds to deconvolve each sample into its constitutive parts.42 An advantage of NMF is that it can be used to assign signature weights to samples when signatures are not discrete. This is highly relevant for immune related signatures, as the degree of infiltration is a continuous predictor of patient outcome (Extended Data Fig. 6a). The most stable NMF solution involved five signatures (Extended Data Fig. 6b–d), which we characterized using GSEA and the xCell tool.43–45
One signature showed a strong negative correlation with purity (Fig. 6c), consistent with a normal-cell origin. It was associated with an array of immune cell types (Fig. 6e) and predictive of patient survival (Fig. 6f).4,41 All samples exhibited some level of expression of this immune signature (Fig. 6d, Extended Data Fig. 6e). The second signature was characterized by high keratin expression and correlated with skin cells, such as keratinocytes and sebocytes (Fig. 6e, Extended Data Fig. 6f, g). This keratin signature was present almost exclusively in primary samples (Extended Data Fig. 6h) and likely explained by the presence of normal skin cells in those samples.
In contrast, the other three expression signatures had a positive correlation with tumor purity (Fig. 6c) and showed a pattern of mutual exclusivity (Fig. 6d, Extended Data Fig. 6e), suggesting they constitute well-defined cancer-cell intrinsic subgroups. This is further supported by the presence of highly concordant subgroups when performing classical clustering on purity-adjusted expression data (Extended Data Fig. 6i, j).
The first subgroup (n = 76) corresponded to the well-known melanoma mRNA subgroup characterized by low levels of the lineage-specific transcription factor, MITF (MITF-low) (Extended Data Fig. 7a–c).41 The second subgroup (n = 72) exhibited higher expression of genes that regulate oxidative phosphorylation (OxPhos) (Extended Data Fig. 7d, e), had the lowest expression of hypoxia-related genes, including HIF1A and VEGFA (Extended Data Fig. 7b, c), as well as the highest level of pigmentation (Fig. 6g). The third subgroup constituted the majority (n = 291) of melanoma samples (Common), characterized by higher expression of MITF, interferon signalling genes, and genes co-expressed with the SWI/SNF chromatin-remodelling subunit, SMARCA2 (Extended Data Fig. 7a, d, e). Whereas tumors within the OxPhos mRNA subgroup exhibited gene expression patterns resembling differentiated melanocytes, the Common and MITF-low signatures resembled other lineages of the neural crest origin as determined using xCell (Fig. 6e).41
We examined the relationship between our mRNA signatures and other genomic features, including TMB and UVR signature (expressed as the proportion of UVR-associated mutations) in non-acral cutaneous samples from TCGA. We observed no significant association between TMB or UVR and our intrinsic mRNA subgroups (Extended Data Fig. 7f, g). However, we observed a modest but robust correlation of our immune signature with TMB and the UVR signature (Extended Data Fig. 7h). We found 4 SMGs differentially mutated across our mRNA subgroups (FDR < 20%) (Figure 7a, Supplementary Table 9). CDKN2A and TP53 were preferentially mutated and had lower expression in MITF-Low and Common samples (Figure 7a, b), whereas PRKAR1A was preferentially mutated and had lower expression in the OxPhos samples. Finally, CTNNB1 and KIT had relatively more mutations and higher expression in OxPhos samples.
Figure 7. Alteration frequency of melanoma drivers differ across mRNA subgroups.
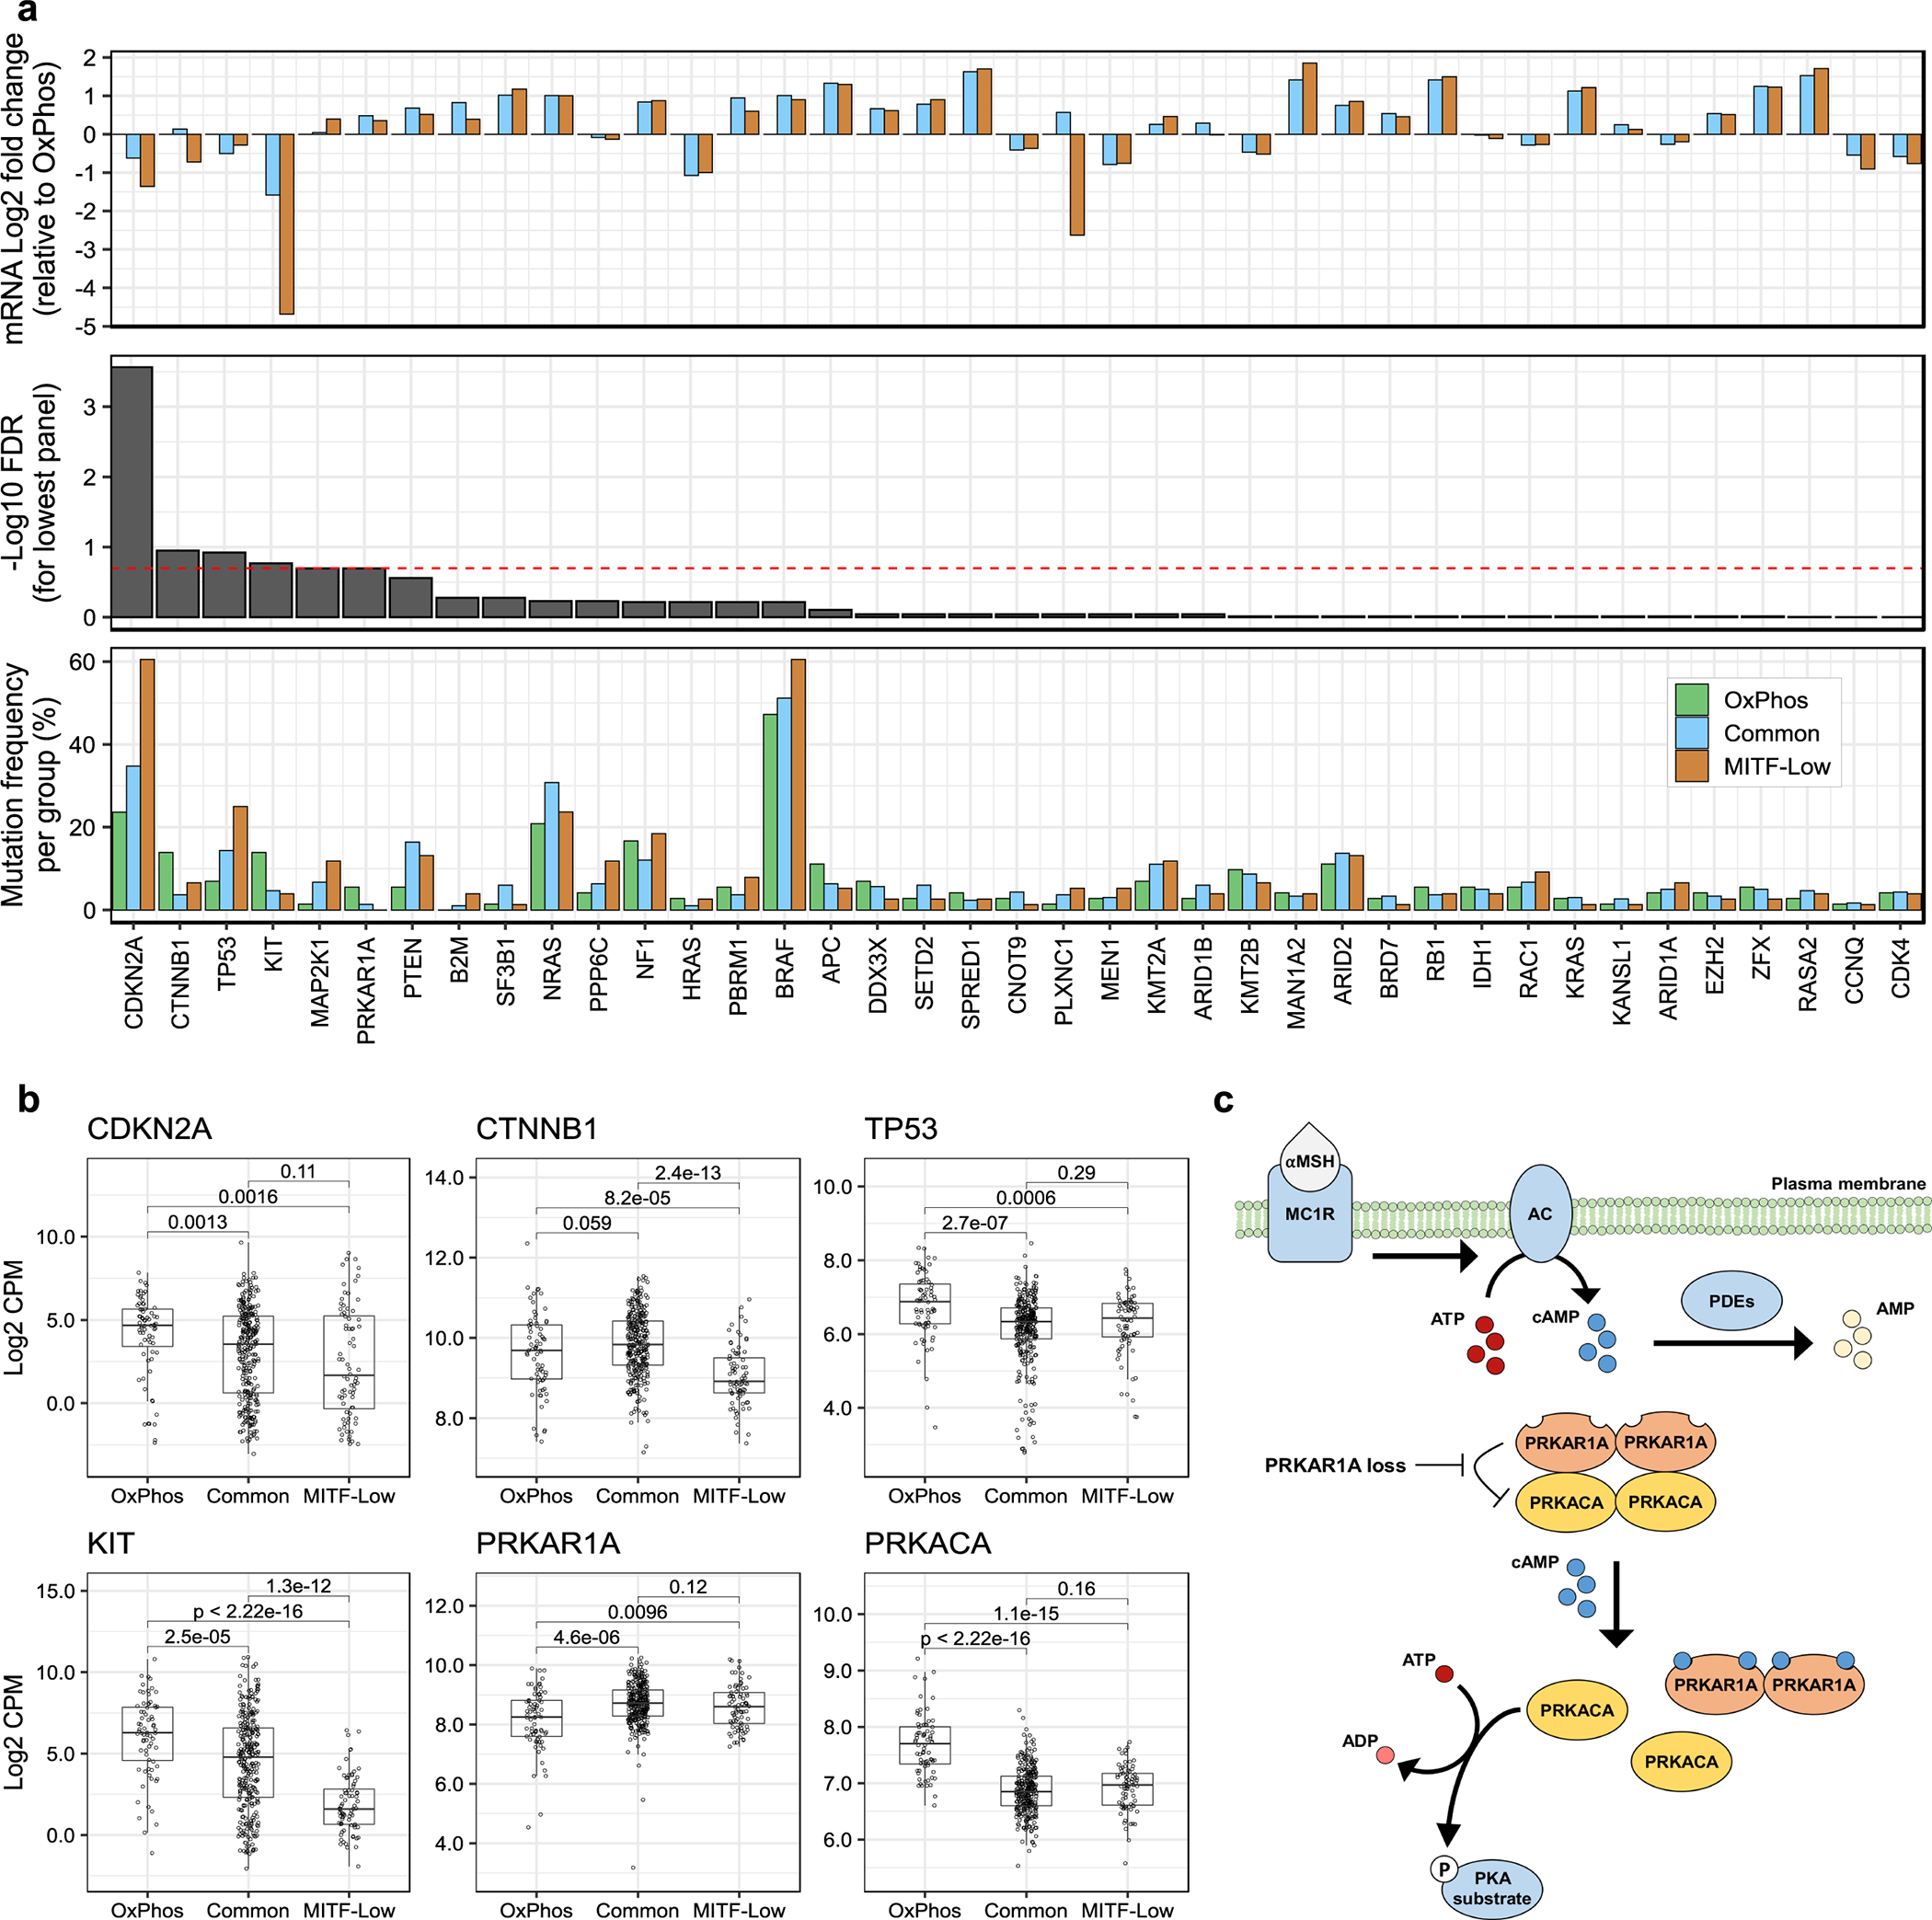
(a) Bottom to top: (1) Bar plot showing the frequency of coding mutations, homozygous deletions, and local amplifications in each mRNA subgroup for all 39 driver genes considered in this study (nOxPhos = 72, nCommon = 299, nMITF-low = 76 tumors). The number of altered tumors per subgroup per gene is reported in Supplementary Table 9. (2) FDR values from a two-tailed Fisher’s exact test for differential alteration frequency between subgroups (p-values were adjusted for multiple hypothesis testing using the Benjamini-Hochberg procedure). (3) Fold-difference in median gene expression per subgroup, relative to OxPhos, in samples not carrying the gene alterations listed in (1). (b) Box and whisker plots of mRNA expression for the four SMGs with the smallest p-values in panel (a), in addition to the catalytic protein kinase A (PKA) subunit, PRKACA, and its regulatory subunit PRKAR1A. Each point corresponds to one tumor. X-axes correspond to mRNA subgroup and Y-axes correspond to mRNA expression in log2 transformed counts per million (CPM). Boxes indicate first, second, and third quartiles. Whiskers extend to the minimum and maximum data points, no further than 1.5 times the inter-quartile range from the hinges. P-values are from a two-tailed Wilcoxon rank sum test (nOxPhos = 72, nCommon = 299, nMITF-low = 76 tumors). (c) Illustration of protein kinase A (PKA) regulation by PRKAR1A. Alpha-Melanocyte-stimulating hormone (αMSH) ligand binds to and activates melanocortin 1 receptor (MC1R), inducing adenylyl cyclase (AC). AC catalyzes the cyclization of adenosine triphosphate (ATP) into second messenger molecule, cyclic adenosine monophosphate (cAMP). Binding of cAMP to PRKAR1A relieves its inhibitory effect on PRKACA. Activated PRKACA is able to catalyze phosphorylation of target proteins by hydrolyzing ATP to adenosine diphosphate (ADP). cAMP dependent phosphodiesterases (PDEs) negatively regulate PKA signalling by hydrolyzing cAMP to adenosine monophosphate (AMP).
Correlates of immune infiltration and survival
We next asked whether mutations in individual SMGs were associated with our immune signature. Because infiltrated tumors have lower proportions of tumor originating sequencing reads, we controlled for purity and sequencing coverage using a partial correlation model. Only mutations in one SMG, PRKAR1A, showed a negative correlation with the immune signature following multiple hypothesis correction (FDR < 5%; Supplementary Table 10).
Previous studies observed that high TMB is associated with improved response to immune checkpoint inhibitors (ICIs)20,46 and longer survival in the cutaneous melanoma TCGA cohort.47 High TMB is thought to increase the likelihood that a tumor will express non-self antigens recognized by the immune system. More recently, UVR-induced DNA damage has been linked to improved survival21 and reported as a potential determinant in response to ICI.48,49 Here, we investigated the relationship of TMB, the UVR signature, and other clinical variables with melanoma post-accession survival (i.e. survival relative to time of tumor sample procurement) in patients with non-acral cutaneous melanoma in TCGA4. We first tested an initial set of clinical, pathological, and molecular features using univariate Cox proportional-hazards models and a p-value threshold of 0.05. Statistically significant predictors consisted of the immune signature, TMB, UVR signature, age, and tumor tissue site (Extended Data Fig. 8a). We then considered multivariable Cox proportional-hazards models for all possible subsets of predictors and compared the effect of TMB and UVR-signature inclusion on their quality, using the Akaike Information Criterion (AIC). The best models included the immune signature, tumor tissue site, age at sample procurement, and either UVR-signature or TMB (Extended Data Fig. 8b). We observed that the immune signature, UVR-signature and TMB were also amongst the best predictors of overall survival (i.e. survival relative to time of initial diagnosis) (Extended data Fig. 9). These results indicate wthat UVR-signature and TMB provide prognostic information complementary to immune infiltration (Fig. 8a, b). Including both UVR and TMB simultaneously did not significantly improve AIC or concordance index (Extended Data Fig. 8c, d), which is not surprising due to their substantial correlation (Spearman rho of 0.73) (Fig. 8d). Notably, when restricting our analysis solely to UVR-high samples, TMB, but not the proportion of UVR mutations, provided a significant improvement to the model (Fig. 8c, Extended Data Fig. 8e, f). This suggests that TMB provides information on melanoma patient survival not included in the UVR signature.
Figure 8. Correlates of immune infiltration, UV-signature, TMB and survival.
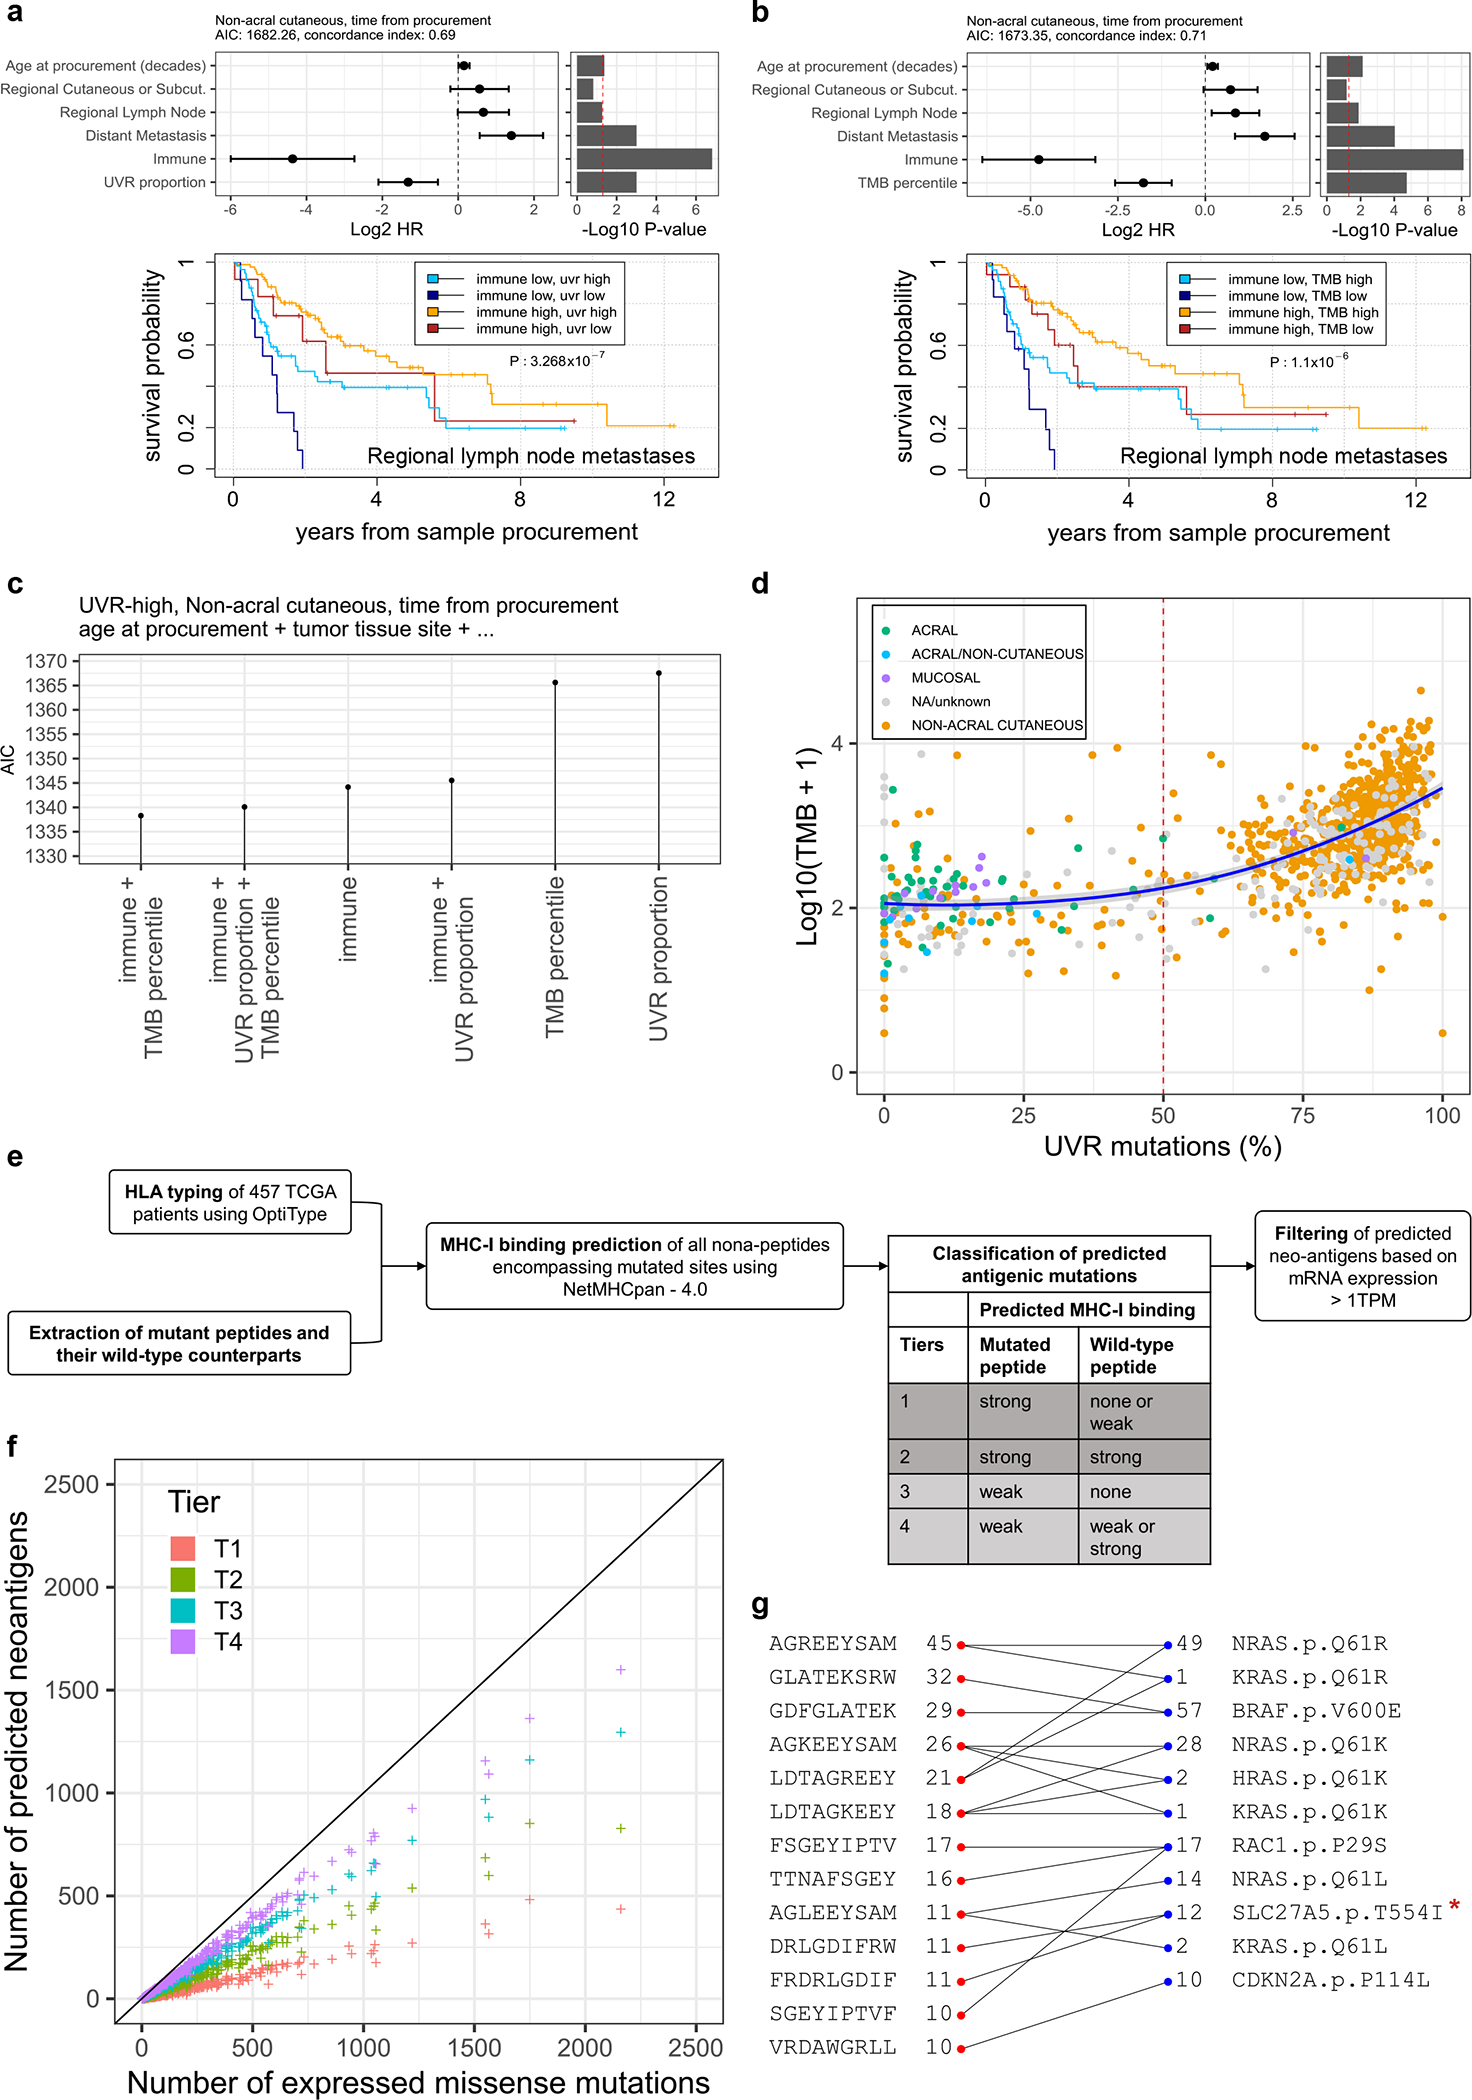
(a and b) Multivariable Cox regression models of post-accession survival times for patients with non-acral cutaneous melanoma (n = 347 patients). The model in (a) includes proportion of UVR mutations whereas (b) includes TMB. At the top of each panel are the model coefficients and their 95% confidence intervals, expressed in log2 hazard-ratios, with p-values on the right (two-tailed z Wald test of coefficients). At the bottom of each panel are Kaplan-Meier survival curves for post-accession survival time of patients with regional lymph node metastasis samples. The patients are stratified into four groups based on median dichotomized immune signature and UVR-group in (a) or TMB-group in (b). The UVR groups are defined using a 50% cut-off for the proportion of UVR mutations. The TMB groups are based on a 15th-percentile cut-off, in order to obtain similar UVR and TMB group sizes (23 UVR-low, 142 UVR-high, 29 TMB-low, 136 TMB-high patients). (c) Relative quality of different multivariable Cox regression models of post-accession survival in patients with non-acral cutaneous melanoma and a high UVR signature (n = 301 patients). All models include age at procurement and tumor tissue site, in addition to the predictors specified on the x-axis (symbolized using ellipses). The y-axis shows the Akaike information criteria (AIC). Lower AIC indicates better relative quality. (d) Proportion of UVR mutations versus TMB. Each data point represents one tumor (the number of tumors per group are: acral = 51, acral or non-cutaneous = 11, mucosal = 14, non-acral cutaneous = 772, unknown or unavailable = 166). (e) Schematic representation of the pipeline used to predict antigenic mutations. Note that each increment of neoantigen tier includes all previous tiers. (f) Scatter plot showing the number of predicted antigenic mutations per tumor sample (y-axis) versus the total number of expressed missense mutations (median TPM > 1, x-axis). For visualization purposes, one hypermutated sample is not shown in this plot. (g) Top recurrent predicted antigenic peptides (the left red dots) with associated mutations (right blue dots). Numbers indicate how many TCGA patients are expressing them. All 4 tiers were included. *Likely not expressed (see Filtering potential false positives in text and Extended Data Fig. 3)
We next explored if tumor neoantigen load is more informative than TMB regarding patient survival. The recent TCGA Pan-Cancer Atlas neoantigen study limited their analysis to primary tumors of ~100 melanomas.50 We implemented a pipeline to predict neo-peptide binding to MHC class I for the complete TCGA cohort (n = 457) (Fig. 8e). To maximize the sensitivity of our analysis, we considered different levels of stringency by grouping antigenic mutations into four tiers, based on the predicted binding affinities of the mutated and wild-type peptides. As expected, we observed extremely high correlation (Pearson > 0.99) between TMB and neoantigen load (Fig. 8f)48. Substituting TMB by neoantigen load did not improve our survival models (Extended Data Fig. 10).
We next sought for evidence of negative selection acting upon the accumulation of antigenic mutations by comparing the number of predicted HLA-mutation pairs to the distribution obtained with 1,000 random permutations of the HLA alleles across patients. We did not observe significant depletion for any tier. These results are consistent with a prior analysis that did not detect evidence of negative selection in 99 melanoma samples, and with a recent study that estimated ~99% of missense mutations are tolerated and escape negative selection.12
Despite the absence of a strong immunoediting signal in the melanoma TCGA cohort, studies have shown that specific neoantigens can be exploited therapeutically.51 We looked for recurrent antigenic peptides and their associated mutations in our extended cohort. In addition to known recurrent neoantigens in BRAF and H/K/NRAS, we highlight here less appreciated recurrent neoantigens predicted for RAC1 and CDKN2A (Fig. 8g). Whether these neoantigens are therapeutically relevant for the development of personalized tumor vaccines requires further investigation.
DISCUSSION
Male specific DDX3X loss-of-function mutations
Women have lower melanoma incidence and better prognosis than men. Epidemiological studies estimate on average, for a 20-year old individual, the risk of any mole transforming into a melanoma by the age of 80 is 3 times higher in males than females.52 This has been attributed to behavioral factors; however, sex has been shown to be an independent prognostic factor in cutaneous melanoma and evidence clearly points to either tumor-intrinsic or host-related biological sex differences.6,7 Here, we provided evidence that DDX3X escapes XCI and is preferentially mutated in male melanoma patients, potentially explaining some of the sex differences observed in this malignancy. We also performed an integrative analysis of multiple datasets that support dysregulation of RAS, PI3K, β-catenin pathways upon DDX3X loss.
Our findings raise many questions. First, it is unclear what role DDX3Y, the Y-linked paralog of DDX3X, plays in melanoma. We observed that males carrying DDX3X mutations had concurrent mRNA expression of DDX3Y and did not observe significant co-occurrence between DDX3X and DDX3Y mutations (Extended Data Fig. 5e, f). Although these paralogs share 92% amino acid identity, genetic studies have shown that DDX3Y does not compensate for loss of DDX3X.53 Specifically, germline mutations in DDX3X have been associated to intellectual disability (ID), and pedigree analysis of ID-affected families have reported cases of DDX3X mutations causing ID in males, but not in carrier females within the same family.53 This is consistent with reports indicating that although DDX3Y mRNA is found in many human tissues, DDX3Y protein is observed only in spermatocytes.54 Conversely, a CRISPR-Cas9 screening study observed that DDX3Y was essential in a DDX3X mutant cancer cell line of male origin55. Future studies characterizing DDX3X and DDX3Y expression and function in melanoma are required. Furthermore, trends are emerging in meta-analyses of sex differences in overall survival rates in ICI trials.56 Whether DDX3X plays a role in modulating response to ICI requires further examination.
The cAMP-PKA signaling pathway
Recently, LoF mutations in PRKAR1A were reported in 2 of 27 whole-exome sequencing cases of spitzoid melanoma; however, none were reported in conventional non-acral cutaneous melanoma.57 Spitzoid melanoma is an uncommon melanocytic neoplasm composed of large atypical epithelioid or spindled cells, more frequently presented in childhood or adolescence as an unpigmented nodule.1 Here, we identified PRKAR1A as a SMG in ~2% of cases. To determine whether these mutations were solely in spitzoid melanomas, two dermatopathologists examined the digitized tumor slides, pathology reports and clinical data for 4 primary and 3 metastatic cases harbouring a PRKAR1A LoF mutation in the TCGA dataset. Both dermatopathologists indicated none of these melanomas either displayed spitzoid morphology nor had clinical features associated with spitzoid melanoma. These results indicate that PRKAR1A loss is an infrequent but significant genetic event in conventional non-acral cutaneous melanoma.
PRKAR1A encodes for the regulatory type IA subunit for the cAMP-dependent PKA holoenzyme.29 The holoenzyme exists as an inactive tetramer, which consists of two pairs of regulatory and catalytic subunits (Fig. 7c). Loss of PRKAR1A function is known to activate PKA signalling, and germline LoF variants in PRKAR1A have been linked to the Carney Complex syndrome.30 By performing cross-platform integrative analysis, we observed that PRKAR1A LoF mutations are enriched in melanomas belonging to the OxPhos mRNA subgroup, which exhibits high expression of the PRKACA catalytic subunit (Fig. 7b). A similar OxPhos expression signature has been linked to BRAF inhibitor resistance.58 A genome-wide open-reading-frame screen identified PRKACA as the highest scoring serine/threonine kinase to promote BRAF inhibitor resistance.59 When examining published sequencing studies of BRAF inhibitor pre- and post-resistance melanoma samples, PRKAR1A mutations were found in 2 of 45 (4.4%) post-treatment resistant cases.60 Whether PRKAR1A loss is associated with BRAF inhibitor resistance requires further investigation.
UVR and TMB in melanoma patient survival
Studies have linked high TMB with improved ICI response and survival in patients with melanoma20,46. However, two recent reports have suggested that these results are confounded by different melanoma subtypes (acral, mucosal and uveal), which generally have lower ICI responses, but also lack a UVR mutation signature and have lower TMB.48,49 Here, we examined the relationship of UVR, TMB, the immune signature and other clinical variables with patient survival in non-acral cutaneous melanomas from TCGA that were predominantly procured prior to the widespread implementation of ICI therapies in the clinic. We observed TMB provides complementary information to immune infiltration on patient survival, even when restricting our analysis to non-acral cutaneous melanomas with a high UVR signature, although this effect was weaker in the latter case. These results support the notion that TMB is not simply distinguishing melanoma subtypes (non-acral versus acral, mucosal, and uveal), but is having an impact on patient survival. It will be interesting to see if the association between TMB and ICI response in melanoma re-emerges when analyzing larger cohorts of patients with a more comprehensive characterization of immune infiltration.
METHODS
Variant processing
Aggregated somatic mutation files from 470 TCGA-SKCM samples were downloaded from the GDC61 portal. To mitigate sequencing errors and alignment artefacts, we only considered TCGA variants that were reported by at least three callers in at least one sample. Variants from the 183 MELA-AU whole genomes18 were downloaded from the ICGC data portal62. Variants from the Hodis2, Krauthammer19 and VanAllen20 cohorts were retrieved from the associated publications. Variants from hg19-based datasets were mapped to the hg38 reference using the rtracklayer R package. We discarded any variants with ambiguous coordinates (non-bijective mapping between hg19 and hg38) or discordant reference allele. The hg19-based coordinates of TCGA variants were similarly determined. Adjacent SNVs within each sample were identified using the GenomicRanges R package63 and merged back into MNVs. The combined set of variants from all five studies was re-annotated with snpEFF v.4.3s (2017–10-25)64 using Ensembl GRCh38.86 gene models and dbSNP build 150. Common germline variants were excluded from downstream analysis.
Mutational signatures analysis
Mutational signatures were identified using non-negative matrix factorization (NMF) from the NNLM R package (version 0.4.2), considering a trinucleotide context model without strand specificity (96 mutation types). Thus, the mutation counts for the 1,014 melanoma samples were arranged in a 96-by-1014 matrix V, and NMF was applied to obtain a decomposition , where W is a 96-by-k matrix containing k mutational signatures, and H is a k-by-1014 matrix representing the signatures’ absolute contribution to each sample. NMF was run with the Kullback-Leibler divergence loss function and a maximum of 50,000 iterations. The optimal decomposition rank k (i.e. number of mutation signatures) was determined using three repetitions of five-fold cross-validation. For each fold, one-fifth of the input matrix V was randomly masked, and the mean squared error (MSE) between the predicted and original values of the masked entries was computed. The rank with the smallest mean MSE was selected. The final NMF decomposition is provided in Supplementary Tables 12 and 13 for matrices W and H, respectively.
To estimate the proportion of mutations attributed to a mutational signature k in each sample, we first multiplied the signature’s corresponding column in W by its row in H to produce a matrix, W*,kHk,*, that contains estimated sample-wise tri-nucleotide mutation counts for the signature. We then divided the column sums of W*,kHk,* by the column sums of WH. A similar procedure was used to estimate gene-wise signature contributions.
Significantly mutated genes
We used OncodriveFML 2.0.311 to identify genes under positive selection. Analyses were done separately for the UVR-high (n = 824) and UVR-low (n = 177) samples, defined as having ≤50% or >50% of their mutations originating from the UV-signature. Samples with >50% of their mutations originating from the alkylating signature (n = 13) were omitted from these analyses.
We ran OncodriveFML twice for each UVR group, using default CADD scores23 and custom LoF scores devised for the identification of tumor suppressor genes. LoF scores were obtained by generating all possible single nucleotide variants across the coding genome, followed by snpEff annotation (v.4.3s, Ensembl GRCh37.75 gene models). Variants with a loss-of-function consequence on any protein coding transcripts were given a score of 1 and all other variants were given a score of 0. These consequences were considered loss-of-functions: stop_gained, start_lost, splice_acceptor and splice_donor. Since frameshift variants are treated independently by OncodriveFML, they were not explicitly included in the LoF scores.
For each OncodriveFML run, genes with less than 10 mutations were discarded and p-values were adjusted for multiple hypothesis testing using the Benjamini-Hochberg procedure to control the false discovery rate (FDR). Genes that passed an FDR cut-off of <1% were labelled “significantly mutated”. Results of all OncodriveFML runs are provided in Supplementary Table 4.
To compute an LoF enrichment score (Fig. 5d), we estimated the expected (neutral) proportions of LoF and synonymous variants in each gene, according to a penta-nucleotide context12, and use the following formula:
The following variants were considered as LoF: stop_gained, start_lost, splice_acceptor and splice_donor. To prevent extreme values for genes with few mutations, we added three pseudo-counts to both the numerator and denominator of the plotted estimates.
Saturation analysis
To measure the influence of sample size on the number of identified SMGs, we ran OncodriveFML ten times using n = (100, 150, …, 800) tumors randomly chosen from the high-UV datasets. The number of genes that passed an FDR cut-off of <1% in each run was then plotted against the number of considered samples.
Identification of potential false positives
We considered three criteria to identify potential false positive SMGs: (1) high proportions of mutations in ETS transcription factor binding sites (>10% of all mutations in gene), (2) high neutral mutation rate (>3 × 10−05 mutations per nucleotide per sample), (3) lack of or low gene expression in melanoma cell lines (90th percentile of RPKM < 1).
ENCODE’s clustered ChIP-seq data for 161 transcription factors65 was downloaded from the UCSC Genome Browser66. We selected peaks with an ENCODE’s normalized score ≥500 from the following ETS factors: ETS1, GABPA, ELF1, ELK1 and ELK4. Overlapping variants were identified using the GenomicRanges package.
To estimate neutral mutation rates, we used the mutation data from the 183 melanoma whole genomes (MELA-AU). For each gene, we considered a centered window of at least 100kb spanning its complete set of transcripts. We then excluded any coding, evolutionary conserved or low mappability regions (Supplementary Table 19; neutral mutation rate estimation). The gene-level mutation rate was computed as the number of variants falling within the non-excluded regions, divided by their total size. This method was implemented in R with the rtracklayer and GenomicRanges packages.
Mutated genes pathway enrichment analysis
We tested if genes with an OFML FDR < 10% were enriched for biological pathways or complexes from the Reactome67 “ENSEMBL to pathways” databaseand EpiFactors database68. The enrichment of each pathway or complex was tested using a one-tailed Fisher’s exact test. For each test, the “gene universe” was defined as the set of genes tested for mutational significance in any of the four OFML runs (CADD-UVR-high, CADD-UVR-low, LoF-UVR-high and LoF-UVR-low). P-values were adjusted for multiple testing using the Benjamini-Hochberg procedure independently for Reactome and EpiFactors.
Copy number and purity analysis
ABSOLUTE
Haplotype phasing and copy-ratio segmentation was done with HAPSEG (version 1.1.1) 69 using Affymetrix SNP6 microarray data from 463 TCGA tumor-normal pairs acquired from the legacy GDC archive. Somatic tumor variants and HAPSEG segmentations were processed with ABSOLUTE39 (version 1.0.6) to obtain purity, ploidy and genome-wide allelic copy numbers (solution obtained for 449 samples). ABSOLUTE segmentation was intersected with gene coordinates (Ensembl GRCh37.75) to obtain gene level LOH and total copy numbers in each tumor sample. Genes overlapped by multiple segments were assigned the lowest total copy number and were considered to exhibit LOH if at least one segment supported it. The local gain or loss of a gene was determined using the ratio of its absolute copy number relative to the median copy number of the chromosome arm where it resides. When this ratio was greater than or equal to three, a gene was considered amplified.
Co-occurrence between mutations and copy gain or LOH
Co-occurrence enrichment between mutations and segmental LOH or copy gain in candidate driver genes was tested using a one-tailed Fisher’s exact test. For LOH, we considered LoF mutations only. For copy gain, we considered missense mutations at recurrently mutated amino acids (N > 1) only. To ensure sufficient power, only genes having mutations and segmental events in at least three samples were tested. For any given gene locus, samples with homozygous deletion (0 copy) were excluded from the tests.
Significantly amplified or deleted regions
We used GISTIC to identify significantly amplified or deleted regions. Segmented copy ratios (germline CNV masked) for 470 TCGA tumor samples were acquired from the GDC data portal. Segments that exceeded the telomeric- or centromeric-most array probes were truncated to be within covered genomic regions. To improve sensitivity, we applied in silico admixture removal70 to samples for which ABSOLUTE ploidy and purity estimates were available, using the following formula:
Non-positive copy ratios were capped to 1e-3. Adjusted ratios were log2 transformed, centered on their mode and passed to GISTIC. In Fig. 4e, GISTIC wide peak boundary coordinates were converted from hg38 to hg19 using liftOver to be visualized with ABSOLUTE copy number profiles.
Transcriptome analysis
RNA-seq processing
Raw RNA-Seq read counts were download from the GDC portal for the TCGA-SKCM cohort, and from the CCLE data portal for the melanoma cell lines. Counts of protein coding genes were converted to CPM after TMM normalization using the edgeR package. RPKM/FPKM values were calculated using the rpkm function.
Deconvolution of transcriptomic profiles by NMF
We used NMF (as implemented in the NMF71 R package) to deconvolve cancer and stromal transcriptomic profiles in the TCGA-SKCM cohort. The output of NMF consists of 2 matrices, W and H, whose product is the approximated matrix of observed CPM values. In this context, W is a gene-by-signature matrix containing the weights of each gene’s contribution to a signature and H is a signature-by-sample matrix containing the weight of each signature’s contribution to a sample. Here, signatures can be seen as cell-type specific gene expression modules. NMF was applied to a matrix of CPM values for 5000 genes and 470 samples, with the Brunet optimization algorithm. The genes were selected to have the largest mean absolute deviation (calculated using log-transformed CPM values) amongst autosomal protein coding genes with a mean RPKM > 1. The optimal number of signatures (i.e. decomposition rank) was determined using the proportion of ambiguous clustering (PAC).72 The final NMF decomposition is provided in Supplementary Tables 14 (matrix W) and 15 (matrix H).
Confirmation of intrinsic profiles using PCA and clustering
We recovered the three intrinsic NMF signatures using a classical clustering approach on purity adjusted gene expression. To mitigate the effect of stromal cell contamination, we restricted our analysis to genes with at least one read in all samples and whose expression (log-transformed CPM) positively correlated with tumor purity (Pearson correlation > 0.1) and not strongly positively correlated with NMF’s keratin signature (Pearson correlation < 0.2). The log-transformed CPM values of 5166 retained genes were regressed (linearly) on tumor purity. Genes were ranked by decreasing variance of the residuals, and the top 1500 were used for clustering of the tumor samples using the ConsensusClusterPlus73 R package, with 1000 resampling iterations of kmeans clustering with k = 3. The transcriptomic subgroup of each sample was assigned based on their membership to one of the 3 clusters.
Transcriptomic signatures and xCell analysis
A gene by sample matrix of mRNA RPKM expression values for 468 TCGA samples was passed to xCell to obtain cell-type enrichment scores for each sample. Spearman’s correlation between cell-type’s scores and NMF component weights was computed and plotted in Figure 6e.
Transcriptomic subgroup gene set enrichment analysis
Differential gene expression analysis was performed using DESeq274, comparing samples in each transcriptomic subgroup to all other samples. For each comparison, log2 fold-differences were supplied to the GSEA tool,44,45 using default parameters with the Hallmarks and Curated (C2) gene sets.
Differential gene alteration analysis across transcriptomic subgroups
Differential alteration frequencies (coding mutations, homozygous deletions, and local amplifications) of candidate driver genes across transcriptional subgroups was assessed using a two-tailed Fisher’s exact test. For each gene, the test was performed on a two-by-three contingency table of alteration counts (gain and loss) and mRNA subgroups. P-values were adjusted for multiple testing using the Benjamini-Hochberg procedure.
X-linked analysis
Sex-biased mutation frequency
A two-tailed Fisher’s exact test was used to determine if a given SMG is differentially mutated (missense, inframe-indel or LoF) between males and females. To control for the different neutral mutation burden observed in males and females (see Figure 2A), separate null hypotheses [i.e. expected odds ratio (ORs)] were considered for autosomal and X-linked genes. Specifically, we set the expected OR of the Fisher’s test (i.e. “or” parameter in R’s fisher.test() function) to the median OR observed across all non-SMGs (mutated in at least 10 samples to ensure reliable estimates), considering autosomal and X-linked genes separately. P-values were adjusted for multiple testing using the Benjamini-Hochberg procedure.
We complemented the Fisher’s test using a logistic regression approach, whereby the mutation probability of each gene is modeled as a function of sex and additional covariates specified in Extended Data Fig. 5a. We used the number of SNVs (log-transformed) on the autosomes (or X chromosome for X-linked genes) to account for differences in mutation burden across samples. We note that this approach cannot be used when the outcome variable completely separates one or more of the predictor variables, as is the case for DDX3X LoF mutations that were found exclusively in males.
Differential gene expression between sexes
Differential gene expression analysis of X-linked genes between males (n = 174) and females (n = 273) was performed using DESeq274. Specifically, gene expression was modeled as a function of gender, tumor purity, and tumor tissue site (i.e. primary, regional cutaneous or sub-cutaneous, regional lymph node, and distant metastasis). DESeq2 was initially run on all protein-encoding genes to ensure precise estimates of dispersion. Expression fold-differences between genders and their respective P-values for X-linked genes were subset and adjusted for multiple testing using the Benjamini-Hochberg procedure independently of other genes.
Promoter methylation
Promoter methylation was calculated by taking the mean Beta value of all methylation probes 2kb upstream of a gene’s most 5’ transcription start site, in each of 180 female samples.
Bi-allelic expression of DDX3X
RNA-seq BAM slices of the DDX3X locus were downloaded from GDC for all TCGA-SKCM samples, and nucleotide counts were determined at each genomic position using the Rsamtools package.75 We then looked for common SNPs (average heterozygosity >= 20%, dbSNP150) located within any DDX3X exon and covered by at least 10 reads in >50% of the samples. Only one SNP fulfilled these criteria, rs5963957 (A/C, hg38:chrX:41349057; avHet = 0.43), with a median coverage of 274 reads across samples. The distribution of nucleotide counts at this position confirmed bi-allelic expression in most female samples.
DDX3X functional analysis
Differential gene expression (DGE) analysis of mutant and WT DDX3X tumors
We applied a linear model framework for transformed RNA-seq read counts, implemented in the limma R package76, to RNA-seq data from the TCGA. Starting with a gene-by-sample matrix of read counts, we retained protein coding genes that in at least 50 samples had a counts-per-million (CPM) value ≥ a CPM corresponding to 10 reads in the sample with the smallest library (number of genes = 14,011). Then, sample-wise normalization factors were calculated using the TMM method implemented in edgeR77 and were subsequently provided along with the read counts to limma’s voom function to estimate observation weights. Linear models were fitted to the voom-weighted observations using limma’s lmFit function and differential expression estimates were moderated using limma’s eBayes function. P-values corresponding to the log2 fold-changes were adjusted for multiple testing using the Benjamini-Hochberg procedure.
We restricted our analysis to male samples, which harbored the vast majority of DDX3X mutations. We modeled gene expression as a function of (1) the mutation status of DDX3X (LoF, missense, or wildtype), (2) the intrinsic gene expression signatures from NMF, (3) the immune signature, (4) top three principal components corresponding to the gene expression (log2CPM + a prior count of 5) of “Keratinization” and “Formation of the cornified envelope” related genes listed in the Reactome database (downloaded October 6, 2019), as these captured more of the variance in Keratinocyte gene expression than NMF’s Keratin signature, and (5) the expression level of DDX3Y (high or low, based on a [log2CPM + a prior count of 5] > 5 cut-off determined based on the relation of DDX3Y expression and tumor purity). We computed the fold-change in gene expression between DDX3X mutant and wildtype samples that had high DDX3Y expression (22 and 167 samples respectively), as the majority of DDX3X mutations occurred in DDX3Y expressing tumors.
Differential gene expression analysis of DDX3X KD and control cell lines
For each cell line (melanoma HT144 cells36, hepatocellular carcinoma HepG2 cells, and chronic myelogenous leukemia K562 cells35), we quantified mRNA expression using Kallisto (default parameters and GENCODE v22 gene annotations). We used DESeq274 with default parameters to estimate differences in gene expression between DDX3X knockdown and control conditions. P-values were adjusted for multiple testing using the Benjamini-Hochberg procedure. SRA accessions for RNA-seq data are in Supplementary Tables 16 and 17.
Positional enrichment of DDX3X eCLIP peaks
Enhance crosslinking immunoprecipitation (eCLIP) peaks that passed an irreproducible discovery rate (IDR) cut-off <0.01 were acquired from ENCODE for 150 RNA binding proteins (RBPs) (103 for HepG2 and 120 for K562) including DDX3X. To determine the positional enrichment of these peaks in gene bodies, we first binned the genomic coordinates of each gene into 1000 tiles, with the first tile starting at the 5’end of the gene. Then, for each tile [1–1000], we computed the proportion of genes that overlap at least one peak for the RBP of interest at that tile as a fraction of all genes that overlap one or more peaks for that RBP at any tile. The ENCODE IDs of eCLIP data are in Supplementary Table 18.
Enrichment of DDX3X targets in differentially regulated genes
Genes were divided into two groups based on whether their 5’UTR(s) exclusively overlap at least one IDR eCLIP peak for DDX3X or another RNA binding protein (RBP). For each group, 2D kernel density estimates for differential gene expression in tumors (DDX3X mutant vs. WT) and cell lines (DDX3X knockdown vs. control) were estimated using the kde2d function from the MASS package in R. The bandwidth parameter of the function was set to 0.4. The difference in densities between the two groups of genes was computed and plotted in Fig. 3c and Extended data Fig. 5d.
Gene set enrichment analyses for DDX3X differential expression
We tested for enrichment of gene sets in differentially expressed genes using weighted logistic regression models. For each gene set in the Reactome database (downloaded October 6, 2019), we modeled the presence or absence of each gene in the set (i.e. number of ‘successes’), as a fraction of the total number of sets to which the gene is annotated (i.e. number of ‘trials’), using differential gene expression as an explanatory variable. In this model, each observation (fraction of successes) is weighted by the number of trials. We extracted the differential gene expression coefficients and their corresponding P-values from each model for plotting and further analysis. P-values were adjusted for multiple hypothesis testing using the Benjamini-Hochberg procedure.
Survival analysis
The majority of TCGA specimens analyzed were from metastases (363 of 465). For some patients, this was years after their primary melanoma diagnosis. Because the biology of a metastatic melanoma and its immune cell content may differ from that of its original primary melanoma, we focused on post-accession survival times as in the melanoma TCGA marker publication.4 In summary, patient vital status and the number of days from primary melanoma diagnosis to death or last follow-up were acquired from the GDC data portal (overall survival). We also obtained the number of days between primary diagnosis and sample procurement (sample procurement times) from the Broad Institute TCGA GDAC Firehose website:
(https://gdac.broadinstitute.org/). We subtracted these sample procurement times from the overall survival times to obtain “post-accession survival times”.
We modeled survival time using Cox proportional hazards regression in R. Kaplan-Meier estimator plots were generated using the survfit function from the survival package (version 2.43–3) in R. In all Kaplan-Meier plots, we limited our survival analysis to patients with molecularly profiled metastatic melanoma lymph node specimens only (n = 216). P-values associated with Kaplan-Meier plots are from a log-rank or Mantel-Haenszel test performed using the survdiff R function.
Neoantigen analysis
HLA typing of the TCGA-SKCM samples was performed with Optitype78 using the BAM files from the normal tissue samples. MHC-I binding predictions were obtained with netMHCpan479. Variant processing was performed as follow. We first extracted the mutated and wild-type sequences of a 17aa window centered on each missense mutation using the Biostrings and ensembldb R packages. These sequences were then processed with netMHCpan4 to predict their MHC-I binding affinity, using a 9aa window. We used the default percentile rank thresholds provided by netMHCpan4 to classify peptides into strong (<0.5%) or weak (<2%) binders. Predicted antigenic mutations were grouped into 4 tiers of decreasing specificity as follow: Tier 1 includes mutations creating at least one peptide with strong binding prediction but whose wild-type form is not predicted to be a strong binder. Tier 2 includes any mutation with a strong binding prediction, without regard to the binding predictions of the wild-type forms. Tier 3 includes mutations creating at least one peptide with weak binding prediction, but whose wild-type form is not predicted to bind. Tier 4 includes any mutation with weak binding prediction, without regard to the binding predictions of the wild-type forms. Finally, all tiers were updated to include mutations from less specific tiers (i.e. tier k includes any mutations in tier k-1). Only variants with median expression > 1 TPM (as estimated by Kallisto)80 were considered as potential neoantigens.
To test for evidence of negative selection, we compared the number of predicted antigenic mutations in the TCGA-SKCM cohort with the distribution obtained over 1000 random permutations of the HLA alleles across patients. Importantly, to remove bias that could results from population structure or the HLA-typing step, we considered the sum of predicted antigenic mutations over the six HLA alleles in each patient (i.e. antigenic mutations recognised by homozygous HLA loci are counted twice). We estimated the statistical power of this approach by applying the same procedure on randomized datasets in which varying proportions of antigenic mutations were specifically removed to simulate increasing levels of negative selection. For predicted MHC-I strong binding peptides (tiers 1 and 2), power reached 80% when 7.5% of antigenic mutations were removed.
Adjusting TMB for WES coverage and purity
For each TCGA sample, we determined the proportion of the coding genome that has sufficient read coverage to provide 80% power for mutation detection using ABSOLUTE estimates. We divided the observed TMB by this value to obtain the expected TMB if coverage was sufficient for 100% of the coding genome.
Statistics and reproducibility
In this study, we aimed to analyze the largest possible cohort of melanoma whole exomes. No statistical method was used to predetermine sample size, as this number was dictated by the availability of published datasets.
Four TCGA patients had multiple corresponding tumor samples. Prior to our analyses, we decided to exclude the following redundant samples, arbitrarily prioritizing primaries over metastases: TCGA-ER-A19T-06A, TCGA-ER-A2NF-06A, TCGA-D3-A1Q6–07A and TCGA-D3-AlQA-07A.
Statistical analyses were performed in R (v3.3.0-v3.5.3). These included one-sided and two-sided Fisher’s exact test, two-sided Mann–Whitney U test, one-sided Kolmogorov–Smirnov test and generalized linear models, as indicated. P-values were adjusted for multiple testing using the Benjamini-Hochberg procedure, as indicated. A detailed list of R packages and software programs used in this study is provided in Supplementary Table 20. The experiments were not randomized. The Investigators were not blinded to allocation during experiments and outcome assessment.
DATA AVAILABILITY
Previously published melanoma somatic variants that were reanalyzed in this study are available from the associated publications:
Hodis et al. 2012 (https://doi.org/10.1016/j.cell.2012.06.024, Supplementary Table S4A),
Krauthammer et al. 2015 (https://doi.org/10.1038/ng.3361, Supplementary Data 3) and
Van Allen at al. 2015 (https://doi.org/10.1126/science.aad0095, Supplementary Table S1).
The human melanoma data generated by the TCGA Research Network (http://cancergenome.nih.gov/) can be accessed from the GDC Data Portal (https://portal.gdc.cancer.gov/), after approval for dbGap Study Accession phs000178 (https://www.ncbi.nlm.nih.gov/projects/gap/cgi-bin/study.cgi?study_id=phs000178.v10.p8), due to the presence of personally identifiable information, such as a patient’s germline DNA variants.
The following MAFs were used:
TCGA.SKCM.muse.4cd49f89-d7e2–4333-9872–0bff5327c896.protected.maf
TCGA.SKCM.mutect.bd022199-d399–45db-8474–6dc1f3aad457.protected.maf
TCGA.SKCM.somaticsniper.4ff8ab0f-1a75–44f6-af48–2b30fc6d5a08.protected.maf
TCGA.SKCM.varscan.a83548c2-e6b2–45cf-a7c3-ec099daf30ce.protected.maf
The somatic variants from 183 human melanoma whole genomes (Hayward et al. 2017) can be accessed from the International Cancer Genome Consortium (ICGC) data portal (https://dcc.icgc.org/releases/release_23/Projects/MELA-AU), without restriction.
RNA-seq data from DDX3X knockdown in HT144 cell lines can be accessed from the Sequence Read Archive (https://www.ncbi.nlm.nih.gov/sra), using accession identifiers provided in Supplementary Table 14.
eCLIP data and expression data from DDX3X knockdown in K562 and HepG2 human cell lines can be downloaded from the ENCODE portal (https://www.encodeproject.org/), using accession identifiers provided in Supplementary Table 16 and 15, respectively.
Regions considered for neutral mutation rate estimation were defined using the following files available from Ensembl or the UCSC Genome Browser website:
http://hgdownload.cse.ucsc.edu/goldenpath/hg19/database/phastConsElements100way.txt.gz
http://hgdownload.cse.ucsc.edu/goldenpath/hg19/database/pseudoYale60.txt.gz
ftp://ftp.ensembl.org/pub/release-75/gtf/homo_sapiens/Homo_sapiens.GRCh37.75.gtf.gz
ENCODE’s ETS transcription factor binding sites were downloaded from the UCSC Genome Browser website:
CCLE cell lines gene expression data was obtained from:
https://portals.broadinstitute.org/ccle/data/CCLE_DepMap_18q3_RNAseq_reads_20180718.gct
Cell line annotations were obtained from DepMap:
https://depmap.org/portal/download/all/DepMap-2018q4-celllines.csv
Gene lengths used for RPKM calculations were obtained from:
ftp://ftp.ensembl.org/pub/release-86/gtf/homo_sapiens/Homo_sapiens.GRCh38.86.gtf.gz
The mutated genes pathway enrichment analysis was based on the
EpiFactors database
(downloaded on 2018–01-21, http://epifactors.autosome.ru/) and the
Reactome database
(downloaded on 2018–01-20, https://reactome.org/, ENSEMBL- to-pathways).
The mRNA subgroups pathway enrichment analysis was based on
MSigDB (v6.2): https://www.gsea-msigdb.org/gsea/msigdb/index.jsp
We obtained transcript level expression (in TPM) for TCGA-SKCM from: https://osf.io/gqrz9
Gene set enrichment analyses for DDX3X differential expression was based on the
Reactome database (downloaded on 2019–10-06): https://reactome.org/
For the GISTIC2 analysis of recurrent focal copy-number alteration, we used the following reference file provided by the GDC: snp6.na35.liftoverhg38.txt.zip
(https://gdc.cancer.gov/about-data/data-harmonization-and-generation/gdc-reference-files/)
The COSMIC Mutation Signature definitions were downloaded from the DeconstructSigs website:
https://github.com/raerose01/deconstructSigs/blob/master/data/signatures.exome.cosmic.v3.may2019.rda
The combined set of reannotated variants, excluding those protected by the TCGA, can be accessed at our GitHub repository:
https://github.com/ianwatsonlab/multiomic_melanoma_study_2019
CODE AVAILABILITY
Code related to the main findings of the study is available at GitHub at: https://github.com/ianwatsonlab/multiomic_melanoma_study_2019
Extended Data
Extended Data Figure 1. Identification of melanoma mutational signatures using NMF.
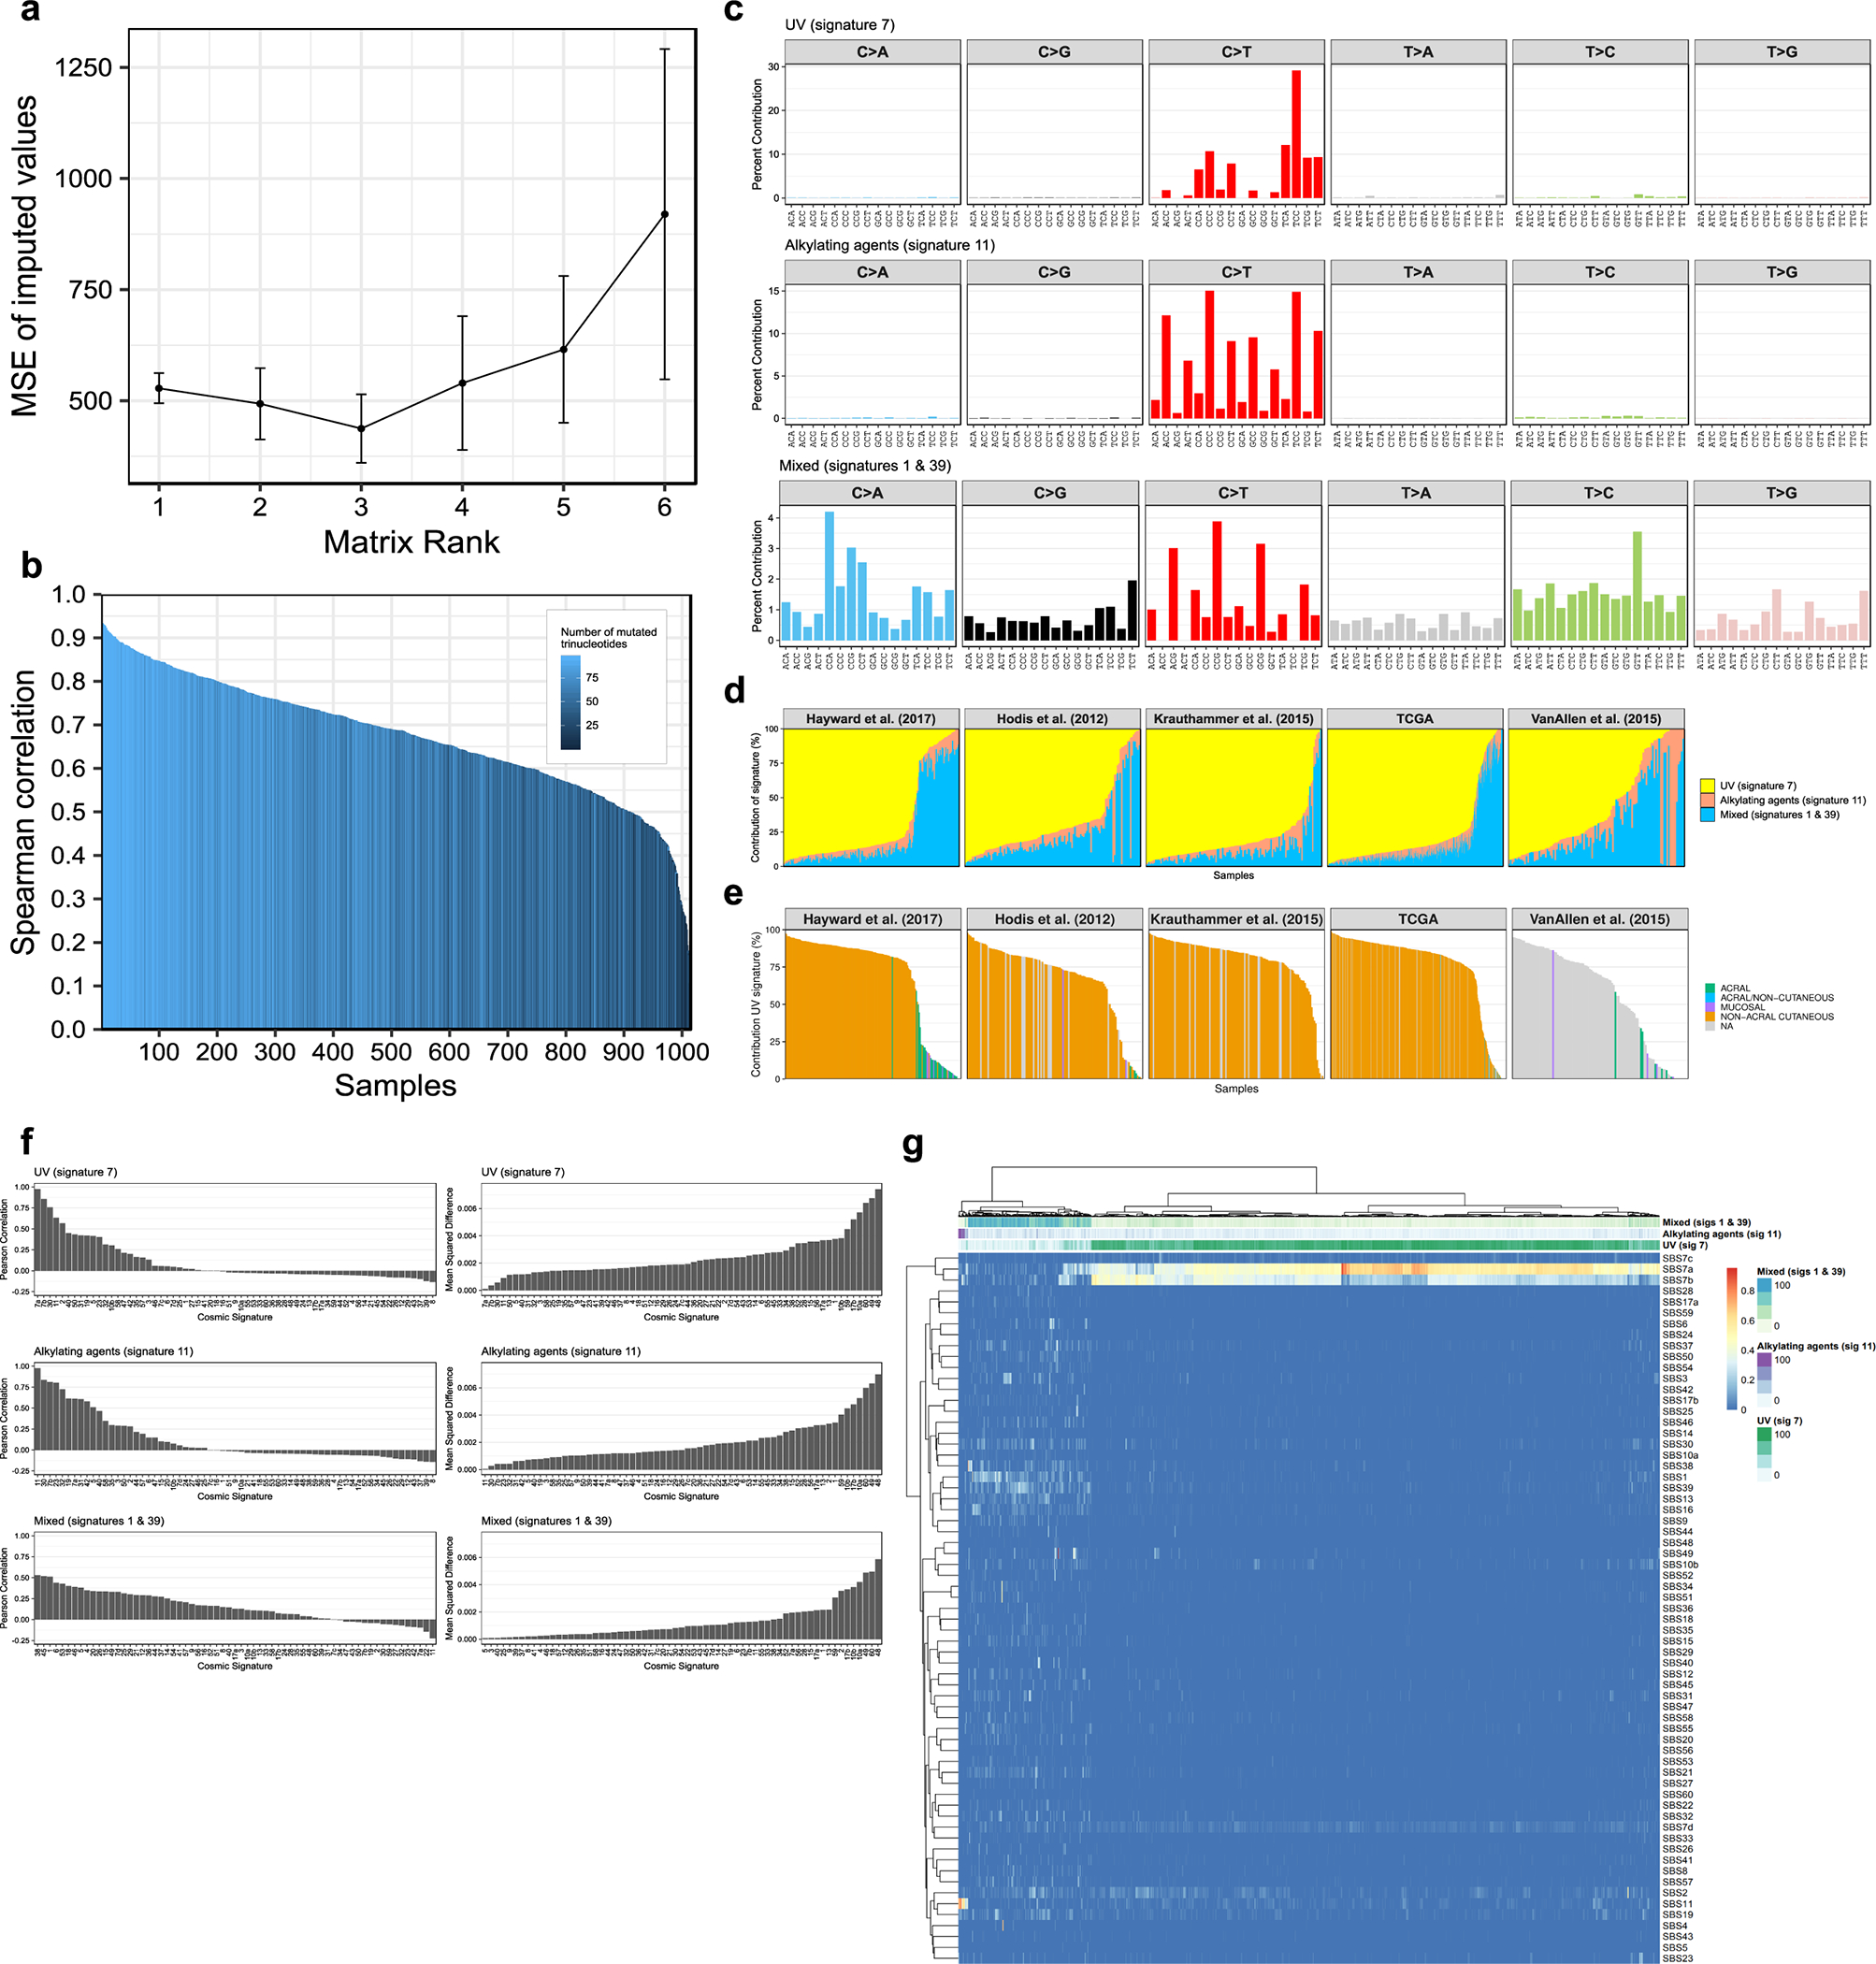
(a) Determination of the optimal NMF decomposition rank (k) based on the average of the mean squared error (MSE) between observed trinucleotide mutation counts and predictions of masked values (y-axis) imputed by NMF. The average, calculated across three repetitions of 5-fold cross validation, is plotted against the decomposition ranks (x-axis). Error bars represent the standard error of the mean (SEM). (b) Sample-wise Spearman’s correlation between the observed and NMF’s fitted trinucleotide mutation counts (n = 96 trinucleotide mutations, n = 1,014 tumors). The color gradient represents the number of mutated trinucleotides in each tumor sample and is meant to highlight that lower correlations result simply from the low sparsity of NMF’s fit. (c) Percentage contribution of trinucleotide mutations for each mutational signature. (d) Percent contribution of each mutational signature to the total number of mutations per tumor. (e) The proportion of UVR-signature mutations per tumor. Melanoma subtypes are distinguished by different colours. (f) Comparisons of our trinucleotide mutational signatures to the Catalogue of Somatic Mutations in Cancer (COSMIC) set of signatures. Left panels show the Person’s correlation (y-axis) between the percent contribution of trinucleotide mutations to our signatures (the values in c) and each of 65 signatures in COSMIC (x-axis) (n = 96 trinucleotide mutations). Right panels show the mean squared difference (y-axis) between the percent contributions (n = 96 trinucleotide mutations). (g) Heatmap showing the column-sum normalized weights of COSMIC mutational signature (rows) in our set of 1,014 tumor samples (columns), estimated using non-negative linear regression (via the nnlm() function implemented in the NNLM R package). Our unsupervised estimates of mutation signature contributions are shown at the top. There is strong agreement between our estimates and those based on the COSMIC signatures.
Extended Data Figure 2. Summary of OncodriveFML (OFML) results.
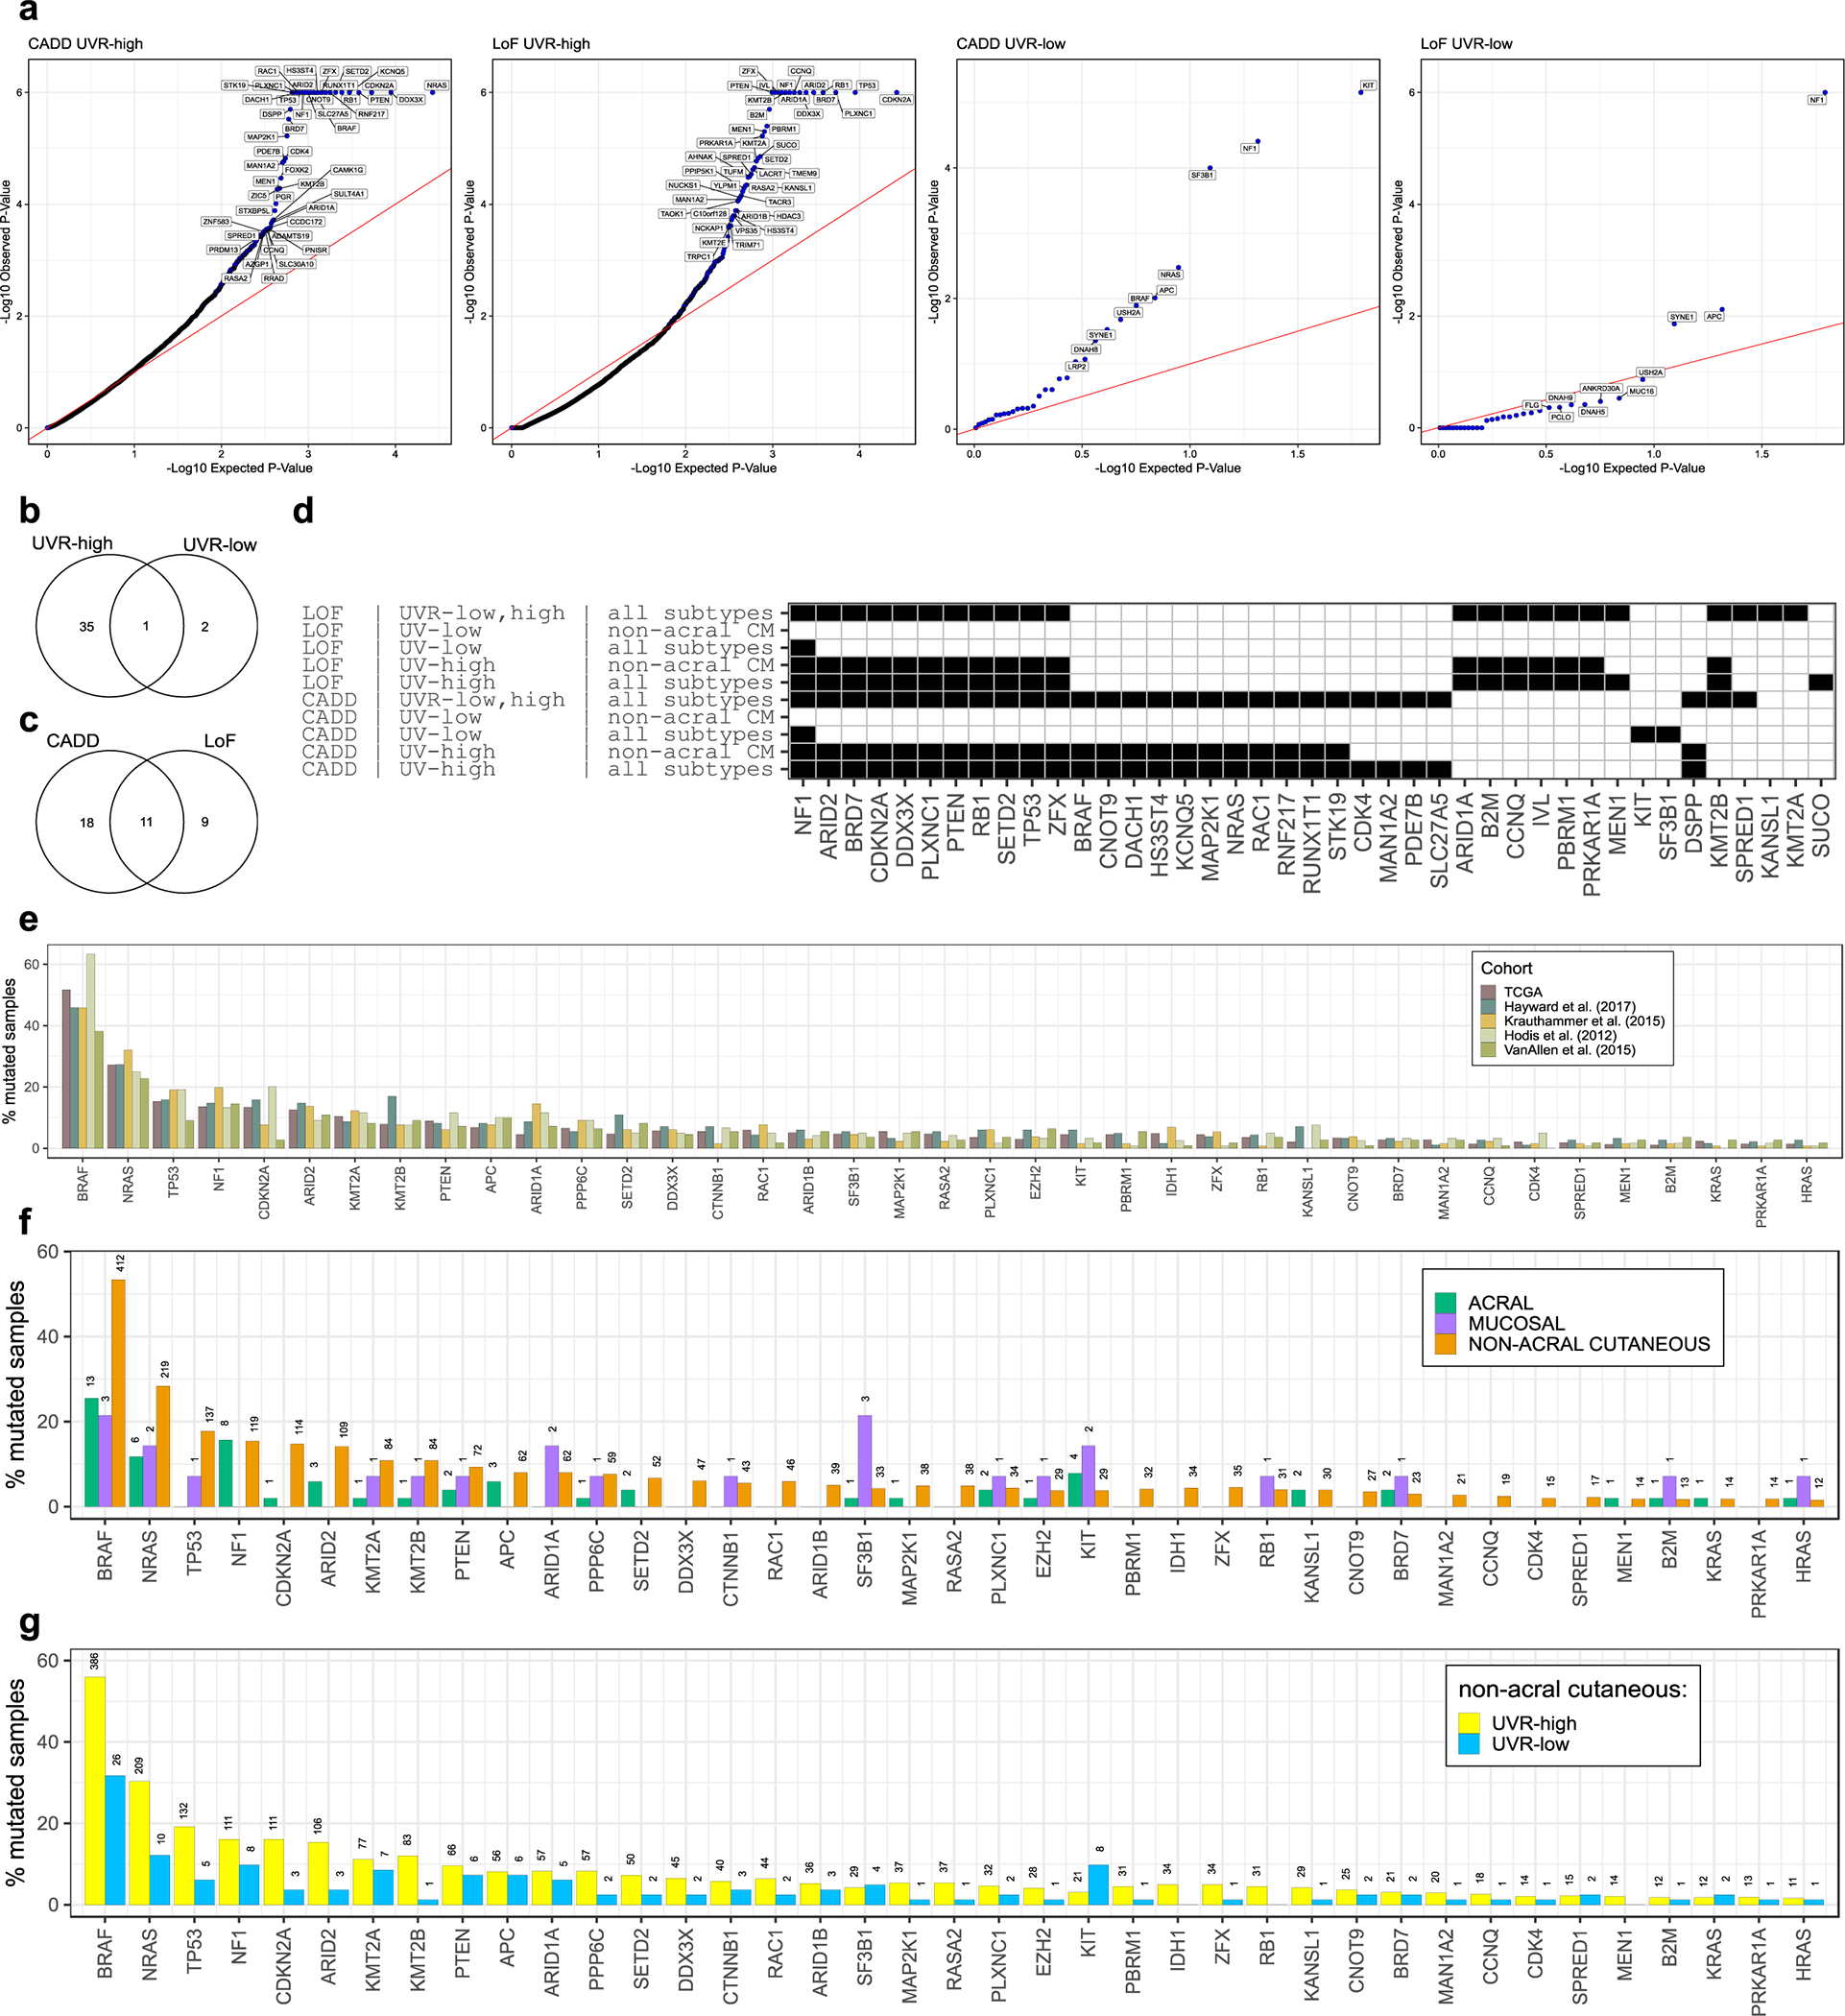
(a) Quantile-quantile (Q-Q) plots of OFML (right-tailed permutation test) p-values (y-axis) plotted against uniformly distributed p-values (x-axis) (n = 177 UVR-low tumor samples, n = 824 UVR-high tumors). Each point represents one gene. Genes with an FDR adjusted p-value of <10% are labelled. (b-c) Venn diagrams showing the overlap between genes identified in each UVR group (b) and using each scoring function (c). (d) Detailed breakdown of OFML subset analyses. Each row of the matrix contains the genes identified as significantly mutated (FDR < 1%) in an analysis using the labelled score (leftmost row label), the UVR group (centre) and melanoma subset (right). Sample sizes are as follows: (UVR-low, UVR-high, all subtypes n = 1,001 tumors); (UVR-low, non-acral cutaneous n = 77 tumors); (UVR-low, all subtypes n = 177 tumors); (UVR-high, non-acral cutaneous n = 690 tumors); (UVR-high, all subtypes n = 824 tumors). (e) Mutation frequency of SMGs stratified by cohort, (f) melanoma subtype and (g) UVR-group. The number of mutated tumors is indicated above each bar for panels (f) and (g). All FDR adjusted p-values were obtained using the Benjamini-Hochberg procedure.
Extended Data Figure 3. Summary of criteria used to flag potential false positive SMGs.
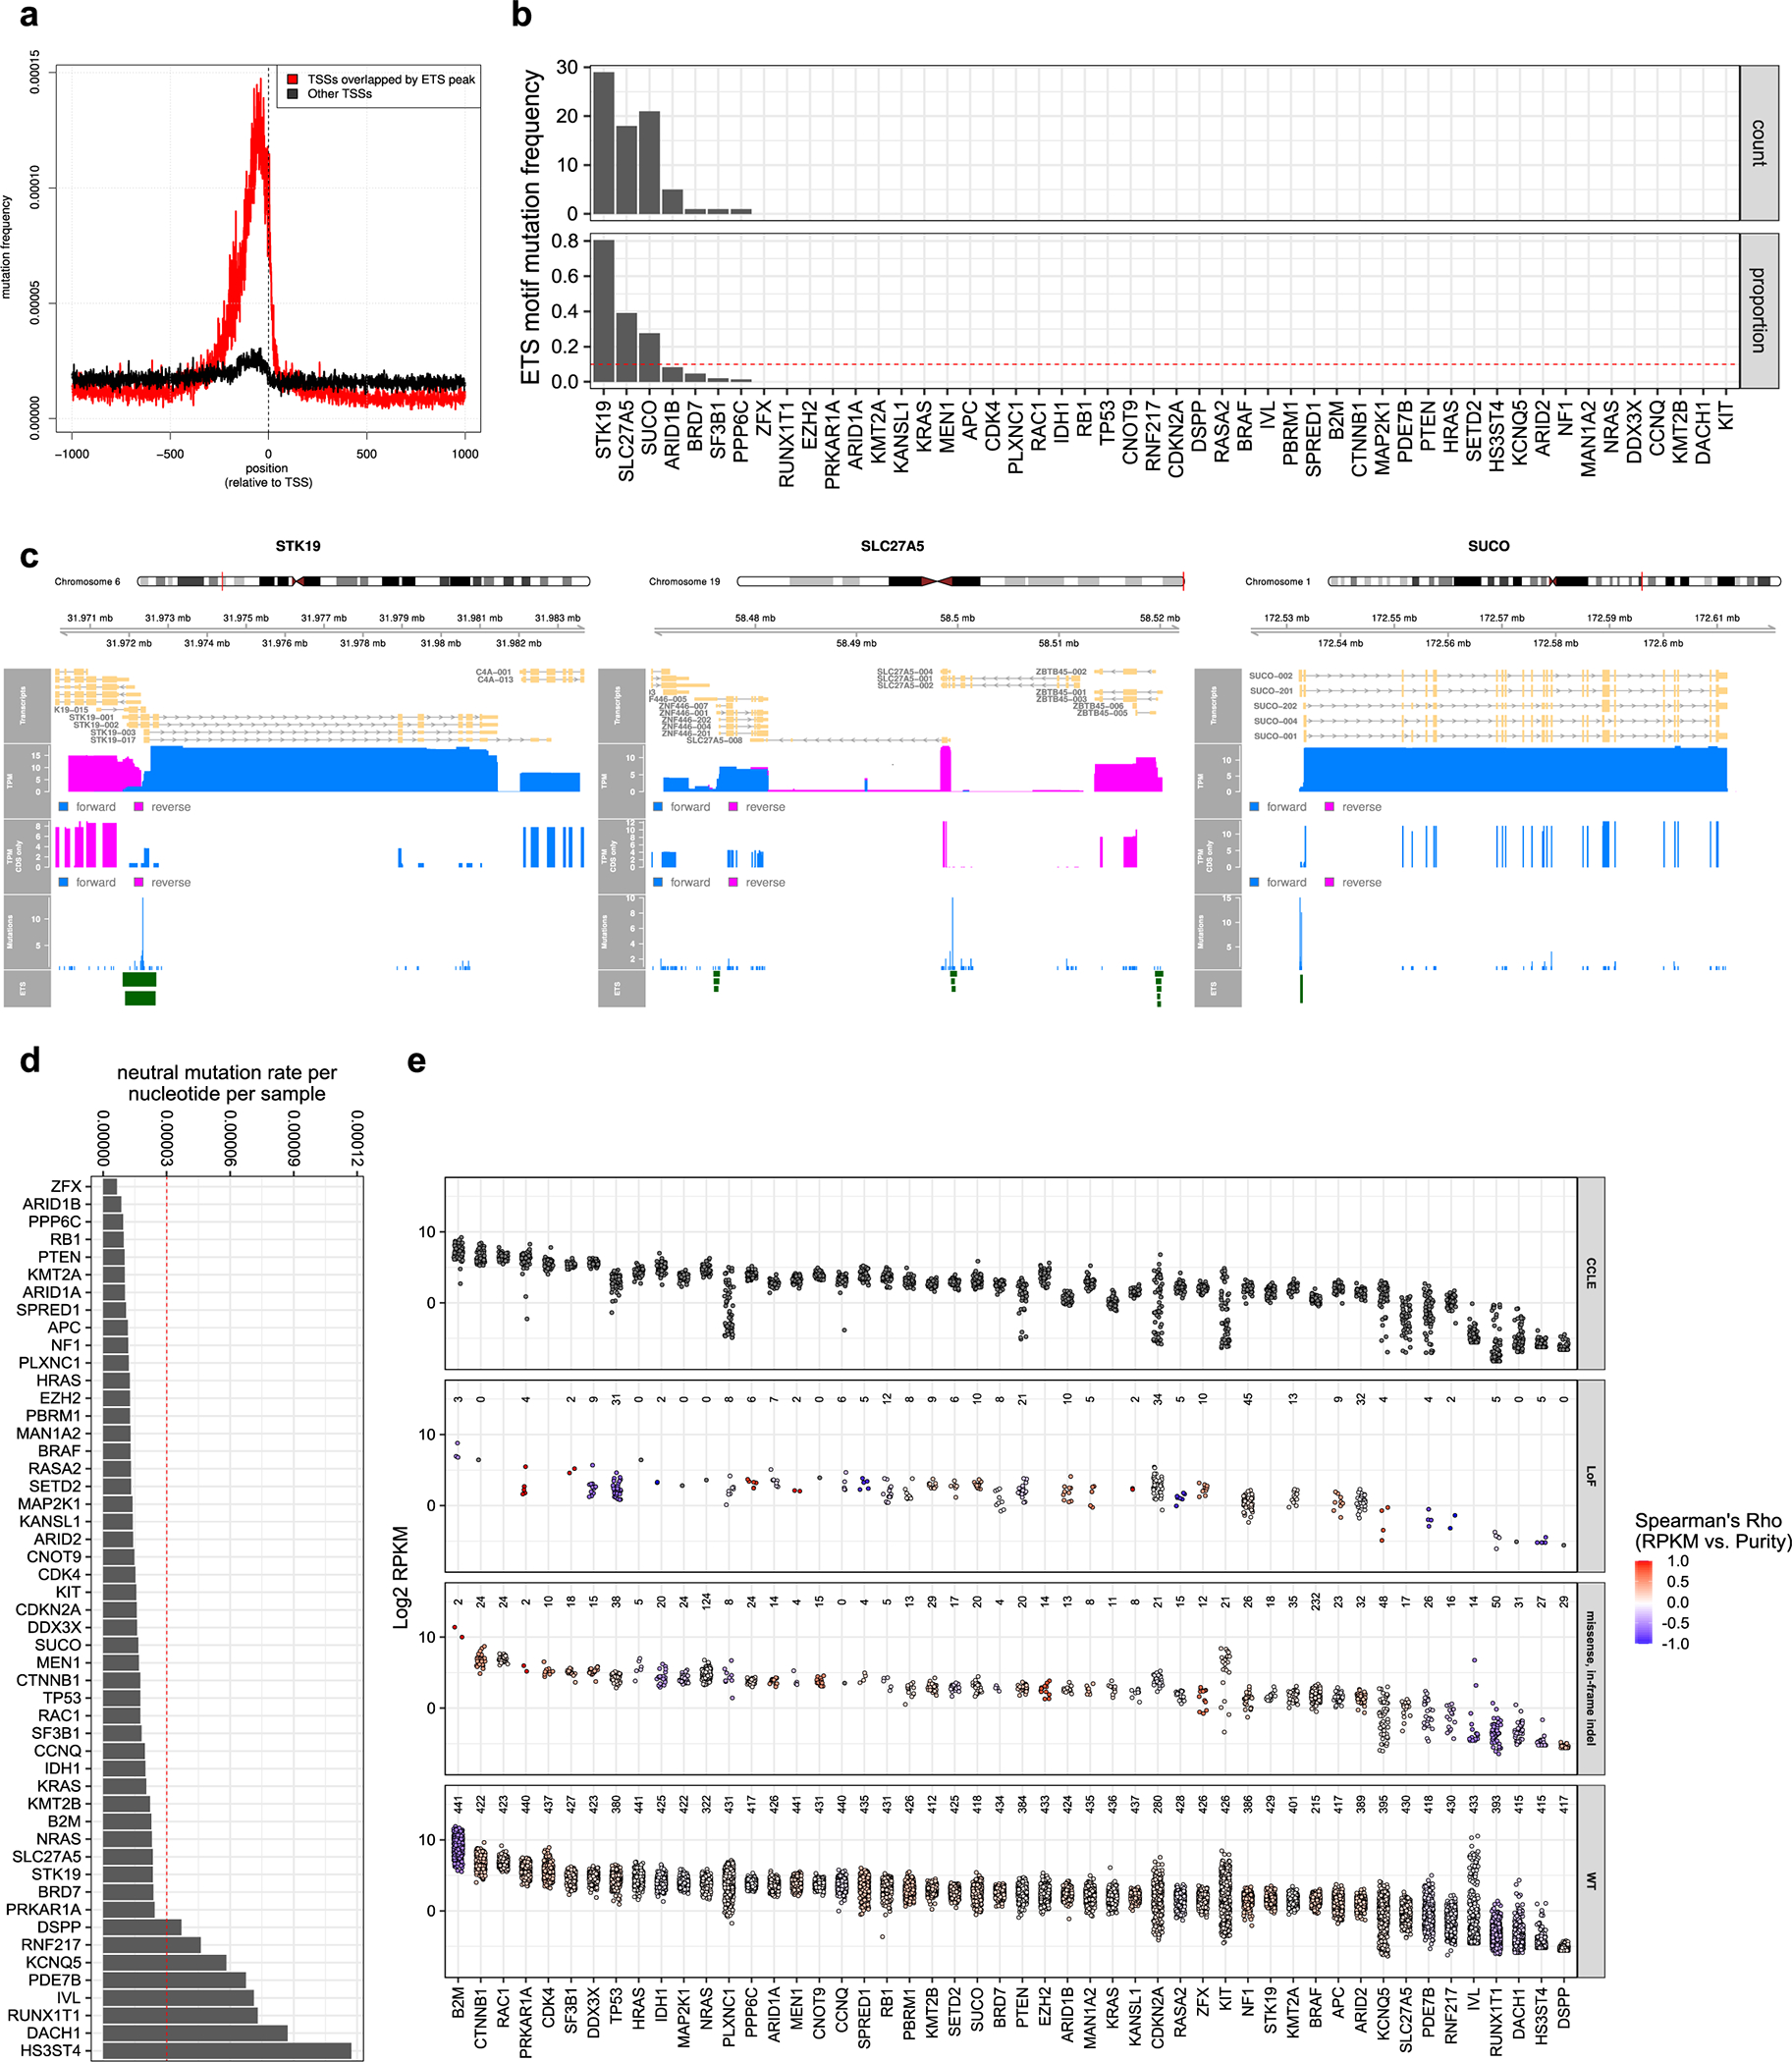
(a) Distribution of mutation frequency near transcription start sites (TSS) of expressed transcripts (> 1 TPM) that overlap (red) or do not overlap (black) ETS transcription factor peaks. (b) Number and proportion of gene mutations that fall within an ETS transcription factor peak. (c) Recurrent mutations at ETS binding sites overlapping SMGs (STK19, SLC27A5, SUCO). For each gene, the top to bottom panels show (1) the gene locus. (2) the various transcripts at that locus. (3) the cumulative median expression of all transcripts, per DNA strand, in units of transcripts per million (TPM). (4) the cumulative median expression of all transcripts, per DNA strand, restricted to their coding regions (CDS), in TPM. (5) the number of mutations at each position in the region. (6) the locations of ETS transcription factor ChIP-seq peaks. (d) Neutral mutation frequency, per tumor sample per nucleotide, for SMGs and other potential drivers (see methods). (e) mRNA expression of genes in melanoma cell lines from the cancer cell line encyclopedia (CCLE) (n = 55 cell lines) (top) and melanoma TCGA tumors (second to fourth panels). Each point on the plot represents one tumor or cancer cell line. Expression levels are in log transformed units of reads per kilobase per million (RPKM). For each gene, TCGA tumors were stratified by mutation status. The colour of TCGA data points corresponds to the Spearman’s correlation between gene mRNA expression and tumor purity. The number of tumors used to compute the correlation coefficient is denoted for each gene and mutation type at the top of each panel.
Extended Data Figure 4. Enrichment of biological processes and protein complexes in the top OncodriveFML (OFML) hits.
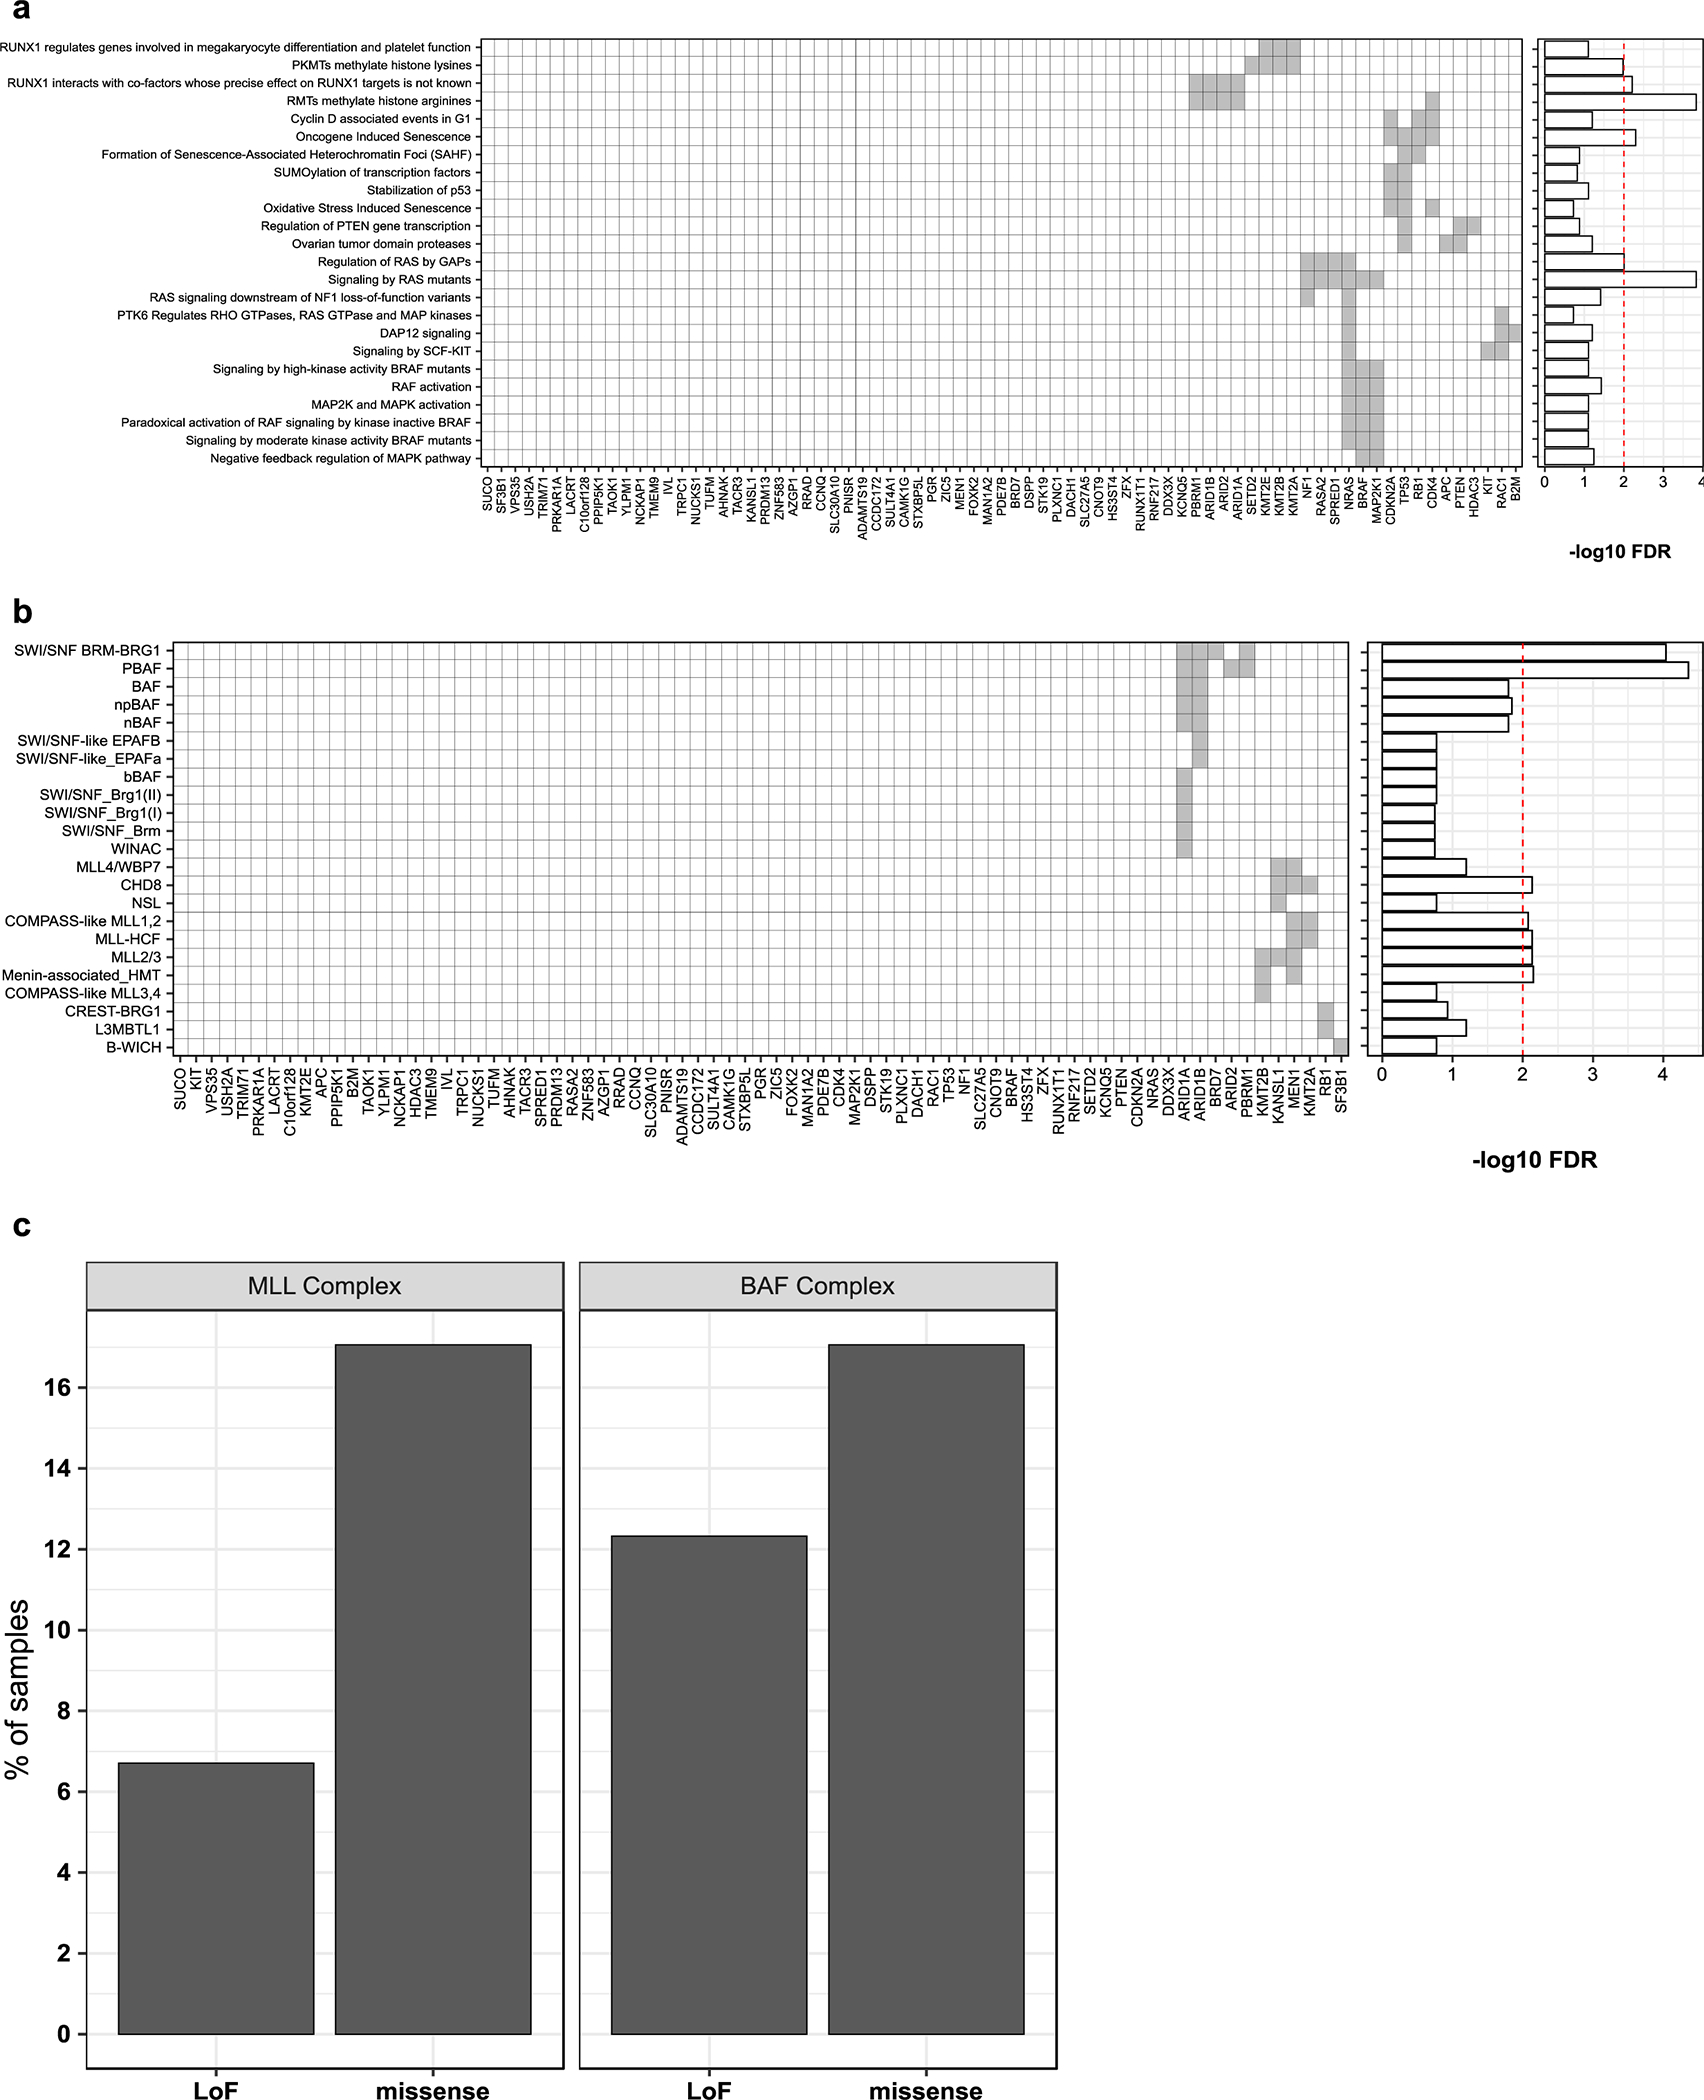
(a and b) Left panel: gene set membership for 66 genes which had an OFML FDR < 10%. Right panel: P-values from a one-tailed Fisher’s exact test of the overlap of Reactome (a) or EpiFactors (b) gene sets with genes that passed an OncodriveFML FDR of <10%. Only gene sets that passed an FDR threshold of <20% are shown. FDRs were computed form p-values using the Benjamini-Hochberg procedure. (c) Bar plot showing the frequency of somatic mutations in (SWI/SNF)/BAF complex subunits (ARID2, ARID1A, ARID1B, BRD7, and PBRM1) and MLL complex subunits (KMT2A, KMT2B, KANSL1, and MEN1) that passed an OncodriveFML FDR of <10%. Number of samples = 1,014 tumors.
Extended Data Figure 5. DDX3X functional analysis and DDX3Y expression and mutation profiles.
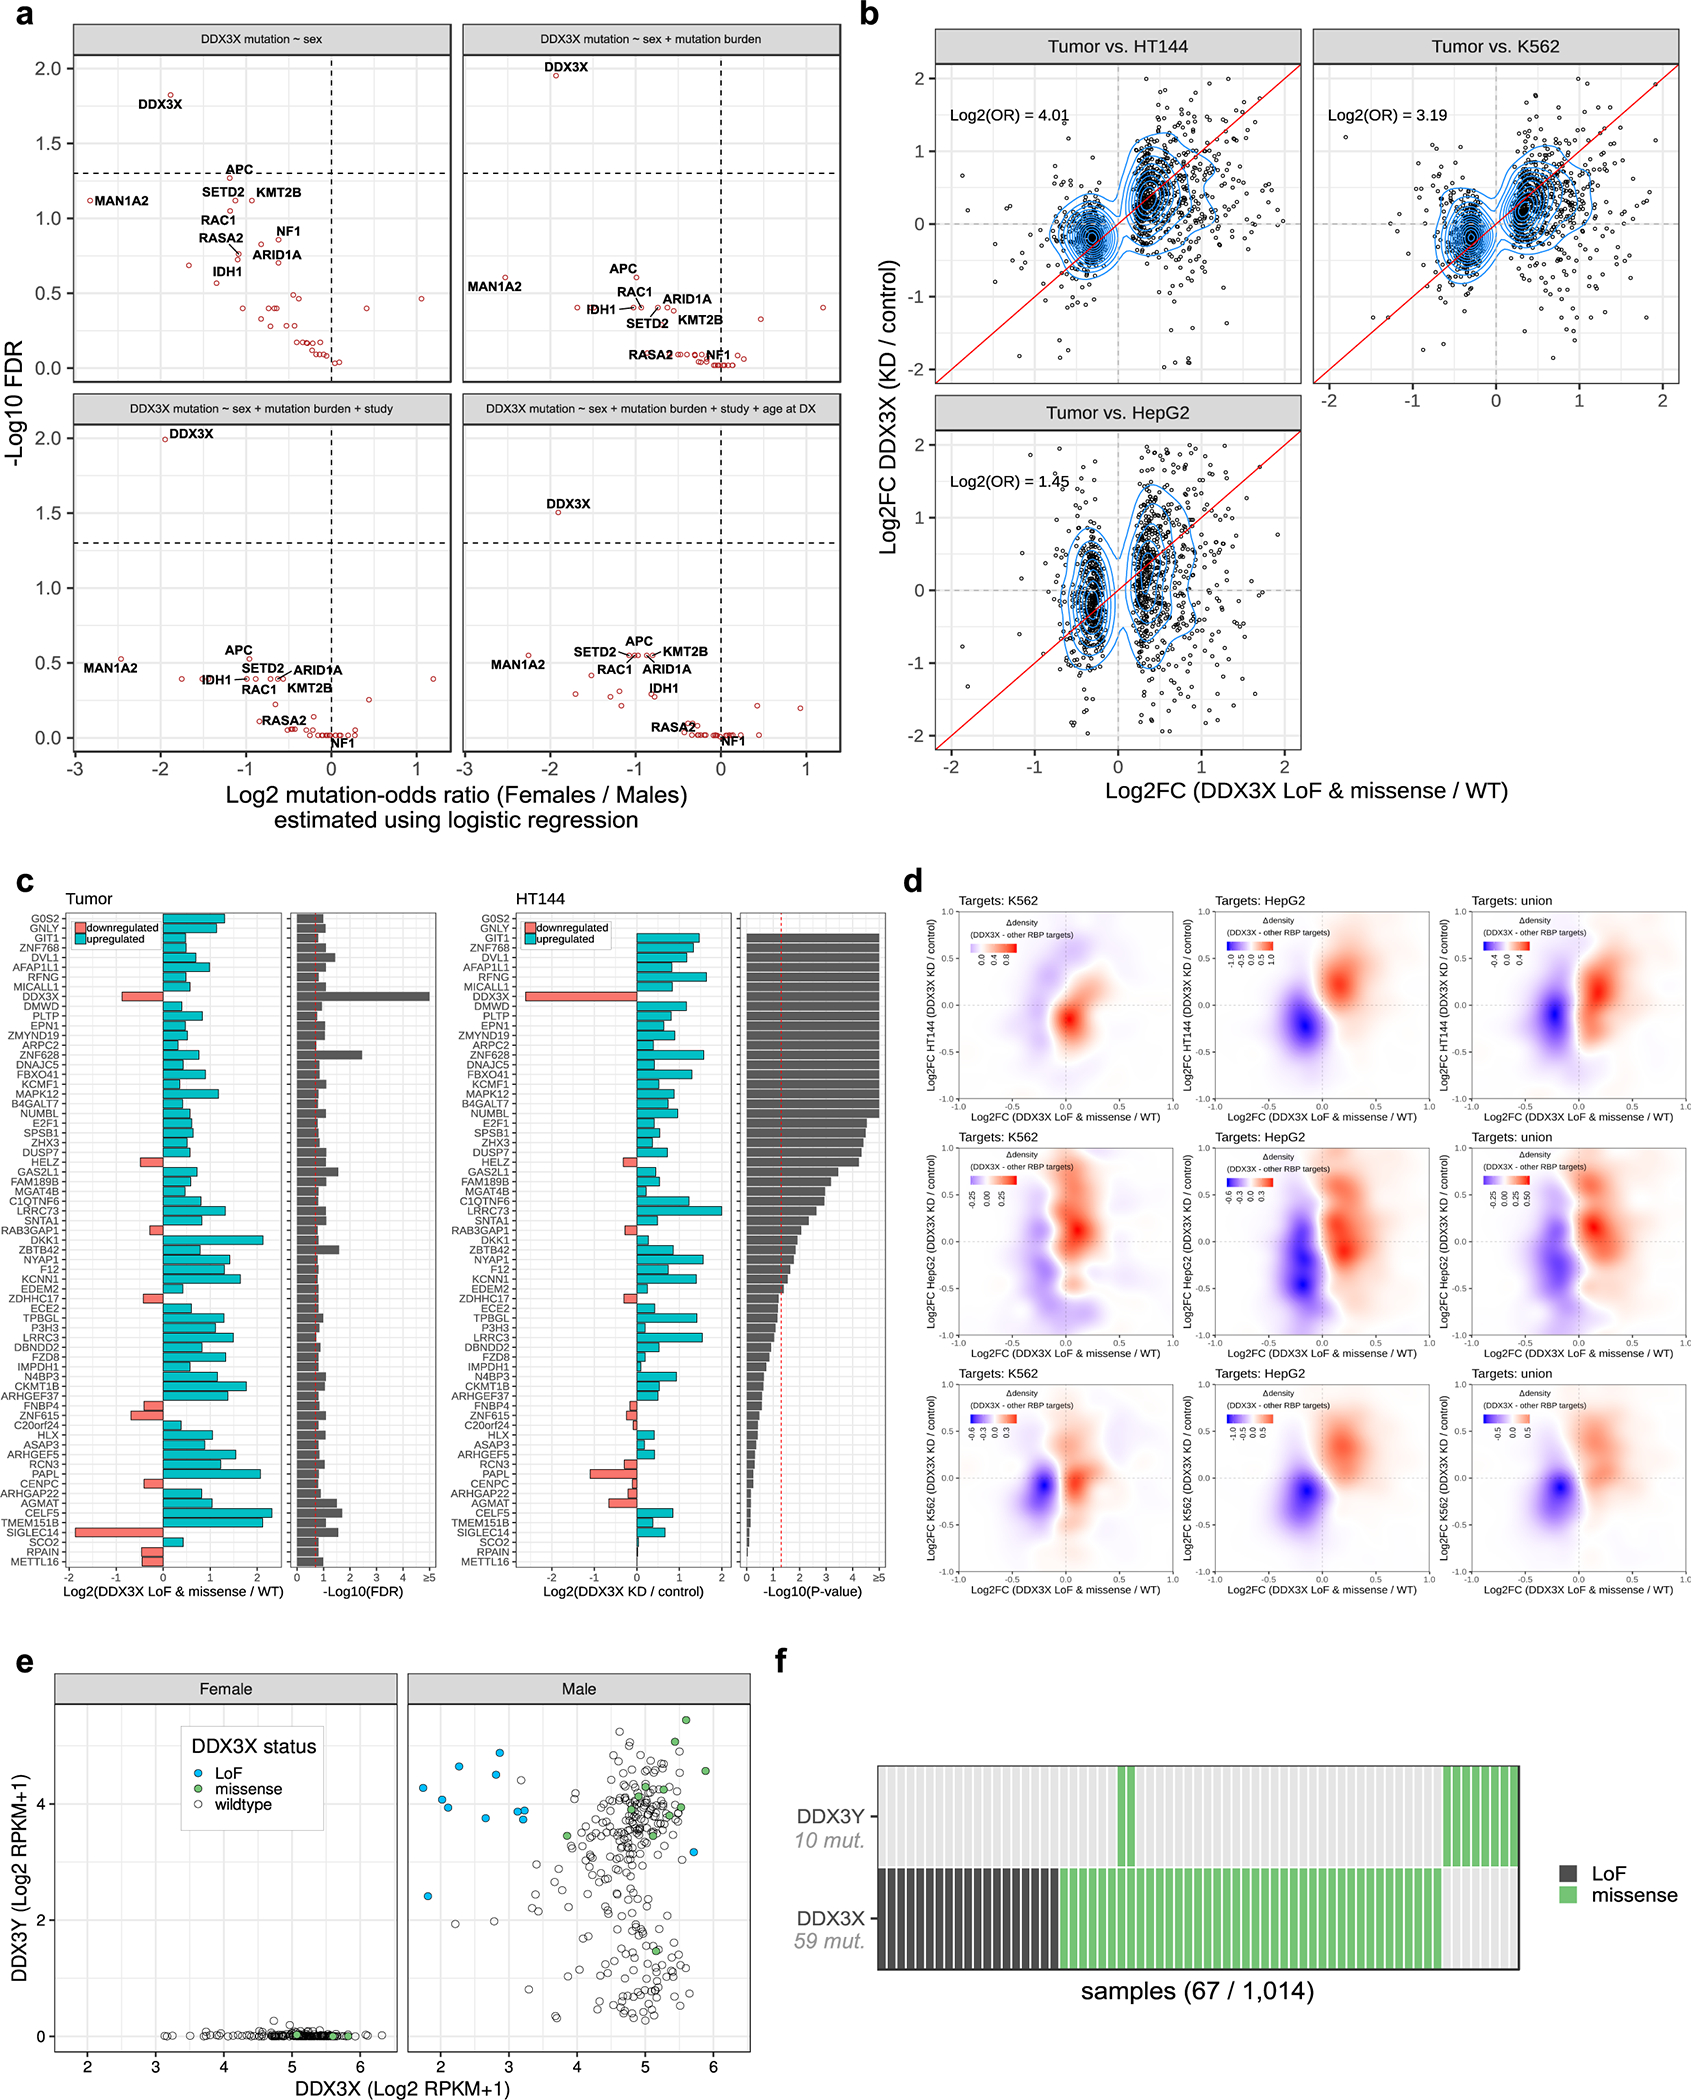
(a) Volcano plots showing the relationship between patient sex and mutation status of SMGs. Each panel corresponds to a logistic regression model, where the probability of mutations in each SMG is modeled as a function of sex and potential confounders such as tumor mutation burden (TMB) and age. Each point corresponds to one gene. The x-axis corresponds to the value of the sex coefficient in the model (log2), the y-axis corresponds to its associated FDR-adjusted p-value (derived from a two-tailed z Wald test and adjusted for the number of hypotheses tested using the Benjamini-Hochberg procedure). These models show that the imbalance of DDX3X mutations between sex are not confounded by factors such as tumor mutation burden and age. There were a limited number of samples for which age was available. Therefore, the FDR value corresponding to DDX3X increases when age is included to the model, as do the FDR values of other SMGs. Models not including age at diagnosis were fitted to 1,013 tumors (59 DDX3X mutant tumors). The model including age at diagnosis was fitted to 841 tumors (50 DDX3X mutant tumors). Data is only shown for genes with at least five mutations. (b) Scatter plots showing DDX3X associated differences in gene expression in tumors (x-axis; n = 22 mutant DDX3X tumors vs n = 167 wildtype tumors) compared against gene expression differences in cancer cell lines (y-axis; two biologically independent replicates of DDX3X knockdown per cell line vs two biologically independent controls per cell line). In each panel, the (log2) odds ratio (OR) between the sign of expression differences in the corresponding cell line vs the sign of expression differences in the tumors are shown. Only genes that had a differential expression p-value < 0.05 in tumors were considered in this analysis (p-values were estimated using the Limma R package; parameterized to perform a two-tailed t-test on linear model coefficients). (c) Expression differences of individual genes between DDX3X mutant and wildtype samples (TCGA, left panel) or DDX3X knockdown and control samples (HT144 cell line, right panel). See (b) for sample sizes and statistical test used with TCGA data. P-values for TCGA were adjusted for multiple testing using the Benjamini-Hochberg procedure. For HT144 data, a two-tailed z Wald test was performed on negative binomial model coefficients fitted using DESeq2. Genes are ordered according to differential expression p-values in HT144. (d) Heatmaps showing the difference in density of differentially expressed DDX3X targets relative to the targets of other RBPs. Each panel corresponds to a different combination of datasets used to determine differential expression (x and y-axis) and DDX3X or other RBP targets (indicated at top of panel). Target genes were identified based on the overlap of their 5’UTR with eCLIP peaks in K562 (left column), HepG2 (middle column) or the union of peaks in both cell lines (right column). (e) mRNA expression of DDX3X and DDX3Y in TCGA tumors from female (left) and male (right) patients (n = 289 male tumors, n = 179 female tumors). Each point represents one tumor, with the color representing DDX3X mutation status. Expression levels are in log transformed units of reads per kilobase per million (RPKM). (f) Mutation matrix of loss-of-function and missense mutations of DDX3X and DDX3Y across all samples analyzed in this study.
Extended Data Figure 6. Deconvolution of melanoma transcriptomes using NMF.
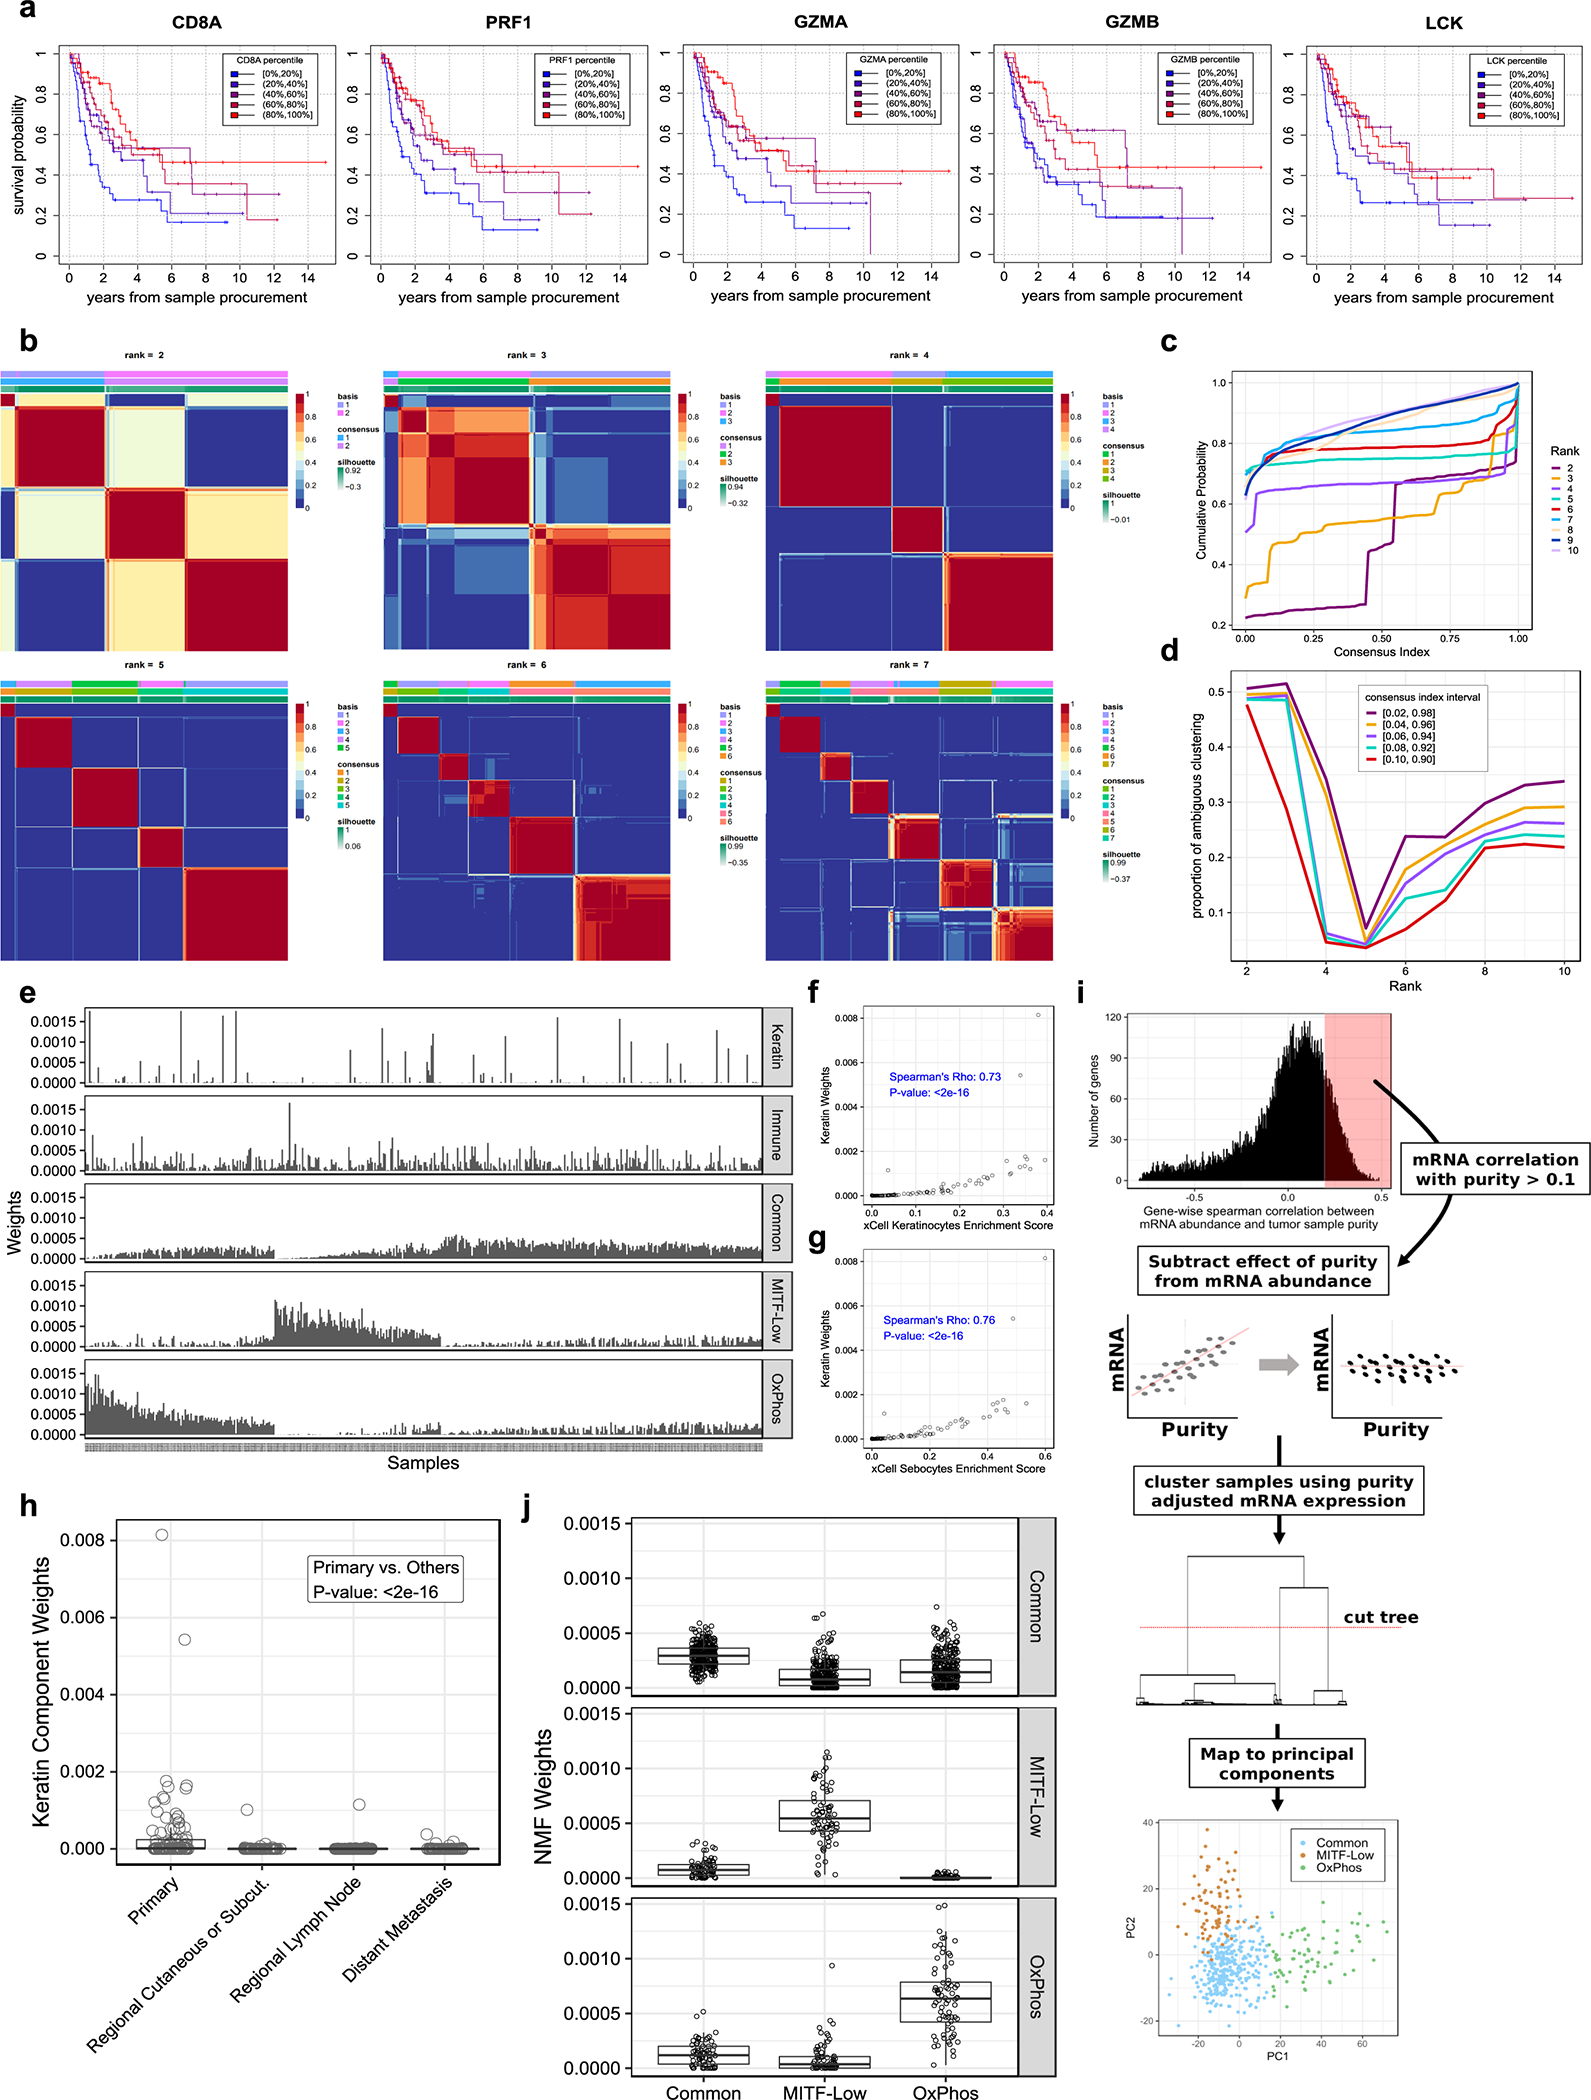
(a) Kaplan-Meier survival curves for 216 patients from TCGA with metastatic tumor samples from a regional lymph node, stratified by mRNA expression percentiles of lymphocytic markers. Each panel corresponds to one lymphocytic maker. (b-d) Determining the optimal NMF decomposition for RNA-seq data (n = 468 tumors). (b) Average of tumor sample connectivity matrices across 100 randomly initialized NMF runs. (c) Cumulative distribution function (CDF) of averaged tumor connectivity matrices. (d) Proportion of ambiguous clustering (PAC) by NMF – used to evaluate the stability of NMFs solution at each rank (k). PAC measurements using five different definitions of ambiguity are shown. (e-h) Distribution of NMF’s expression signatures and their relationship with non-melanocyte skin cells. (e) Distribution of NMF signature weights in TCGA tumors. (f and g) Scatter plots of each tumor’s NMF keratin weights (y-axis) and xCell keratinocyte and sebocyte signature scores (x-axis) (n = 468 tumors). Correlation p-value was computed using a two-sided Spearman’s test. (h) Distribution of keratin weights across TCGA tumor tissue sites (nprimary = 101 and nother = 362 tumor samples). Each point corresponds to one tumor sample. P-value is from a two-tailed Wilcoxon rank sum test. Boxes indicate first, second, and third quartiles. Whiskers extend to the minimum and maximum data points, no further than 1.5 times the inter-quartile range from the hinges. (i) Classical clustering recapitulates melanoma cell intrinsic expression signatures when the effect of varying tumor purity is subtracted from gene expression data. See methods for additional details. (j) Agreement between NMFs proposed cancer intrinsic signatures and the groups uncovered in (i). Each panel includes samples from a single mRNA subgroup identified in (i), indicated on the right side of the panel (nCommon = 299, nMITF-low = 76 and nOxPhos = 72 tumors). Shown on the y-axis are the NMF weights corresponding to each NMF signature indicated on the x-axis. Boxes indicate first, second, and third quartiles. Whiskers extend to the minimum and maximum data points, no further than 1.5 times the inter-quartile range from the hinges.
Extended Data Figure 7. Characterization of melanoma mRNA subgroups.
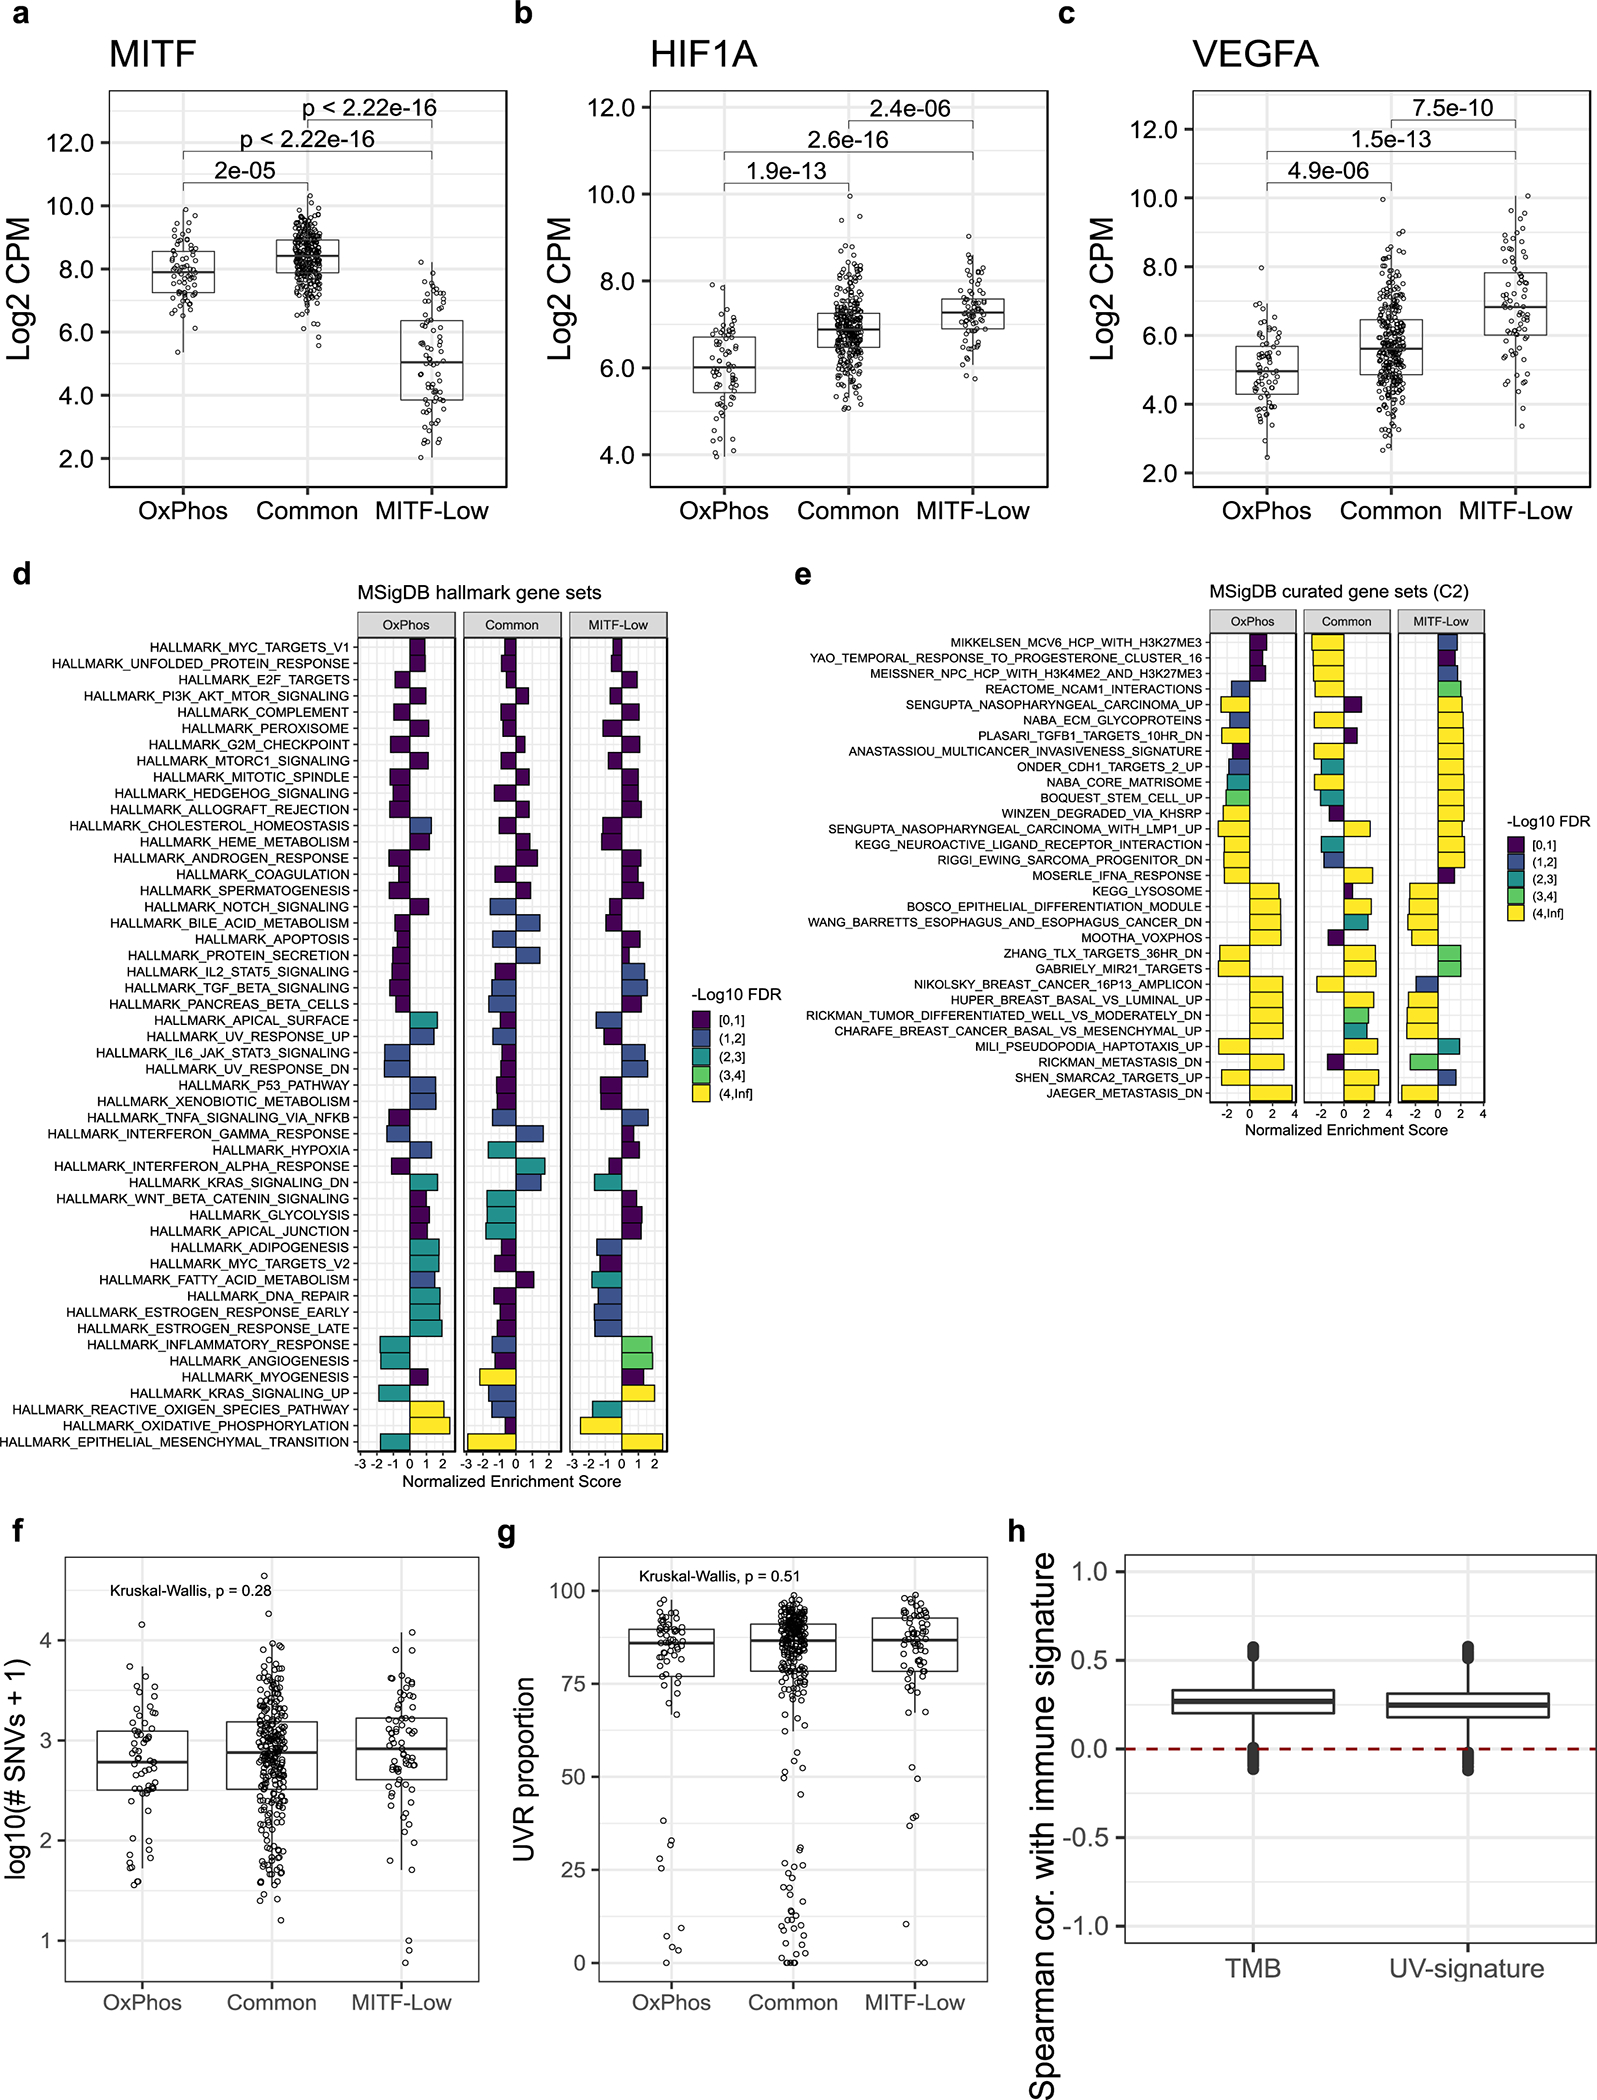
(a-c) mRNA expression of MITF and hypoxia markers HIF1A and VEGFA in melanoma mRNA subgroups (nCommon = 299, nMITF-low = 76 and nOxPhos = 72 tumors). The y-axis corresponds to mRNA expression in log transformed counts per million (CPM). P-values are from a two-tailed Wilcoxon rank sum test. Boxes indicate first, second, and third quartiles. Whiskers extend to the minimum and maximum data points, no further than 1.5 times the inter-quartile range from the hinges. (d-e) Gene set enrichment analysis (GSEA), performed on genes differentially expressed in each mRNA subgroup compared to all out-of-group samples. Genes were first ranked by fold-difference in RNA expression (estimated using DESeq2). The ranked log transformed fold-differences were provided to the Broad Institute’s GSEA tool, which performs a one-tailed permutation test of a Kolmogorov-Smirnov-like statistic (number of genes = 17,481). The MSigDB hallmarks (d) and curated gene sets (C2) (e) databases were used. For each gene set (y-axes) an enrichment score (x-axes) and a corresponding FDR value (colour gradient) are assigned. Positive and negative enrichment scores indicate that a gene set is enriched in upregulated and downregulated genes, respectively. The gene sets shown here are the top seven per group that passed an FDR cut-off <1%. GSEA computes FDR values using a permutation approach. (f) Distribution of TMB in non-acral cutaneous samples, stratified by their dominant intrinsic mRNA signature. See panel (a) legend for sample sizes. (g) Distribution of UVR-mutation proportions in non-acral cutaneous samples stratified by their dominant intrinsic mRNA signature. See panel (a) legend for sample sizes. P-values for (a) and (b) are based on a Kruskal-Wallis test. (h) Bootstrap estimates (10,000 iterations) of the Spearman correlation between immune signature and TMB (left) or proportion of UVR mutations (right) in each tumor (n = 394 non-acral cutaneous tumors). In panels (f-h), Boxes indicate first, second, and third quartiles. Whiskers extend to the minimum and maximum data points, no further than 1.5 times the inter-quartile range from the hinges.
Extended Data Figure 8. Single predictors evaluation and relative quality of multivariable post-accession survival models in non-acral cutaneous melanomas.
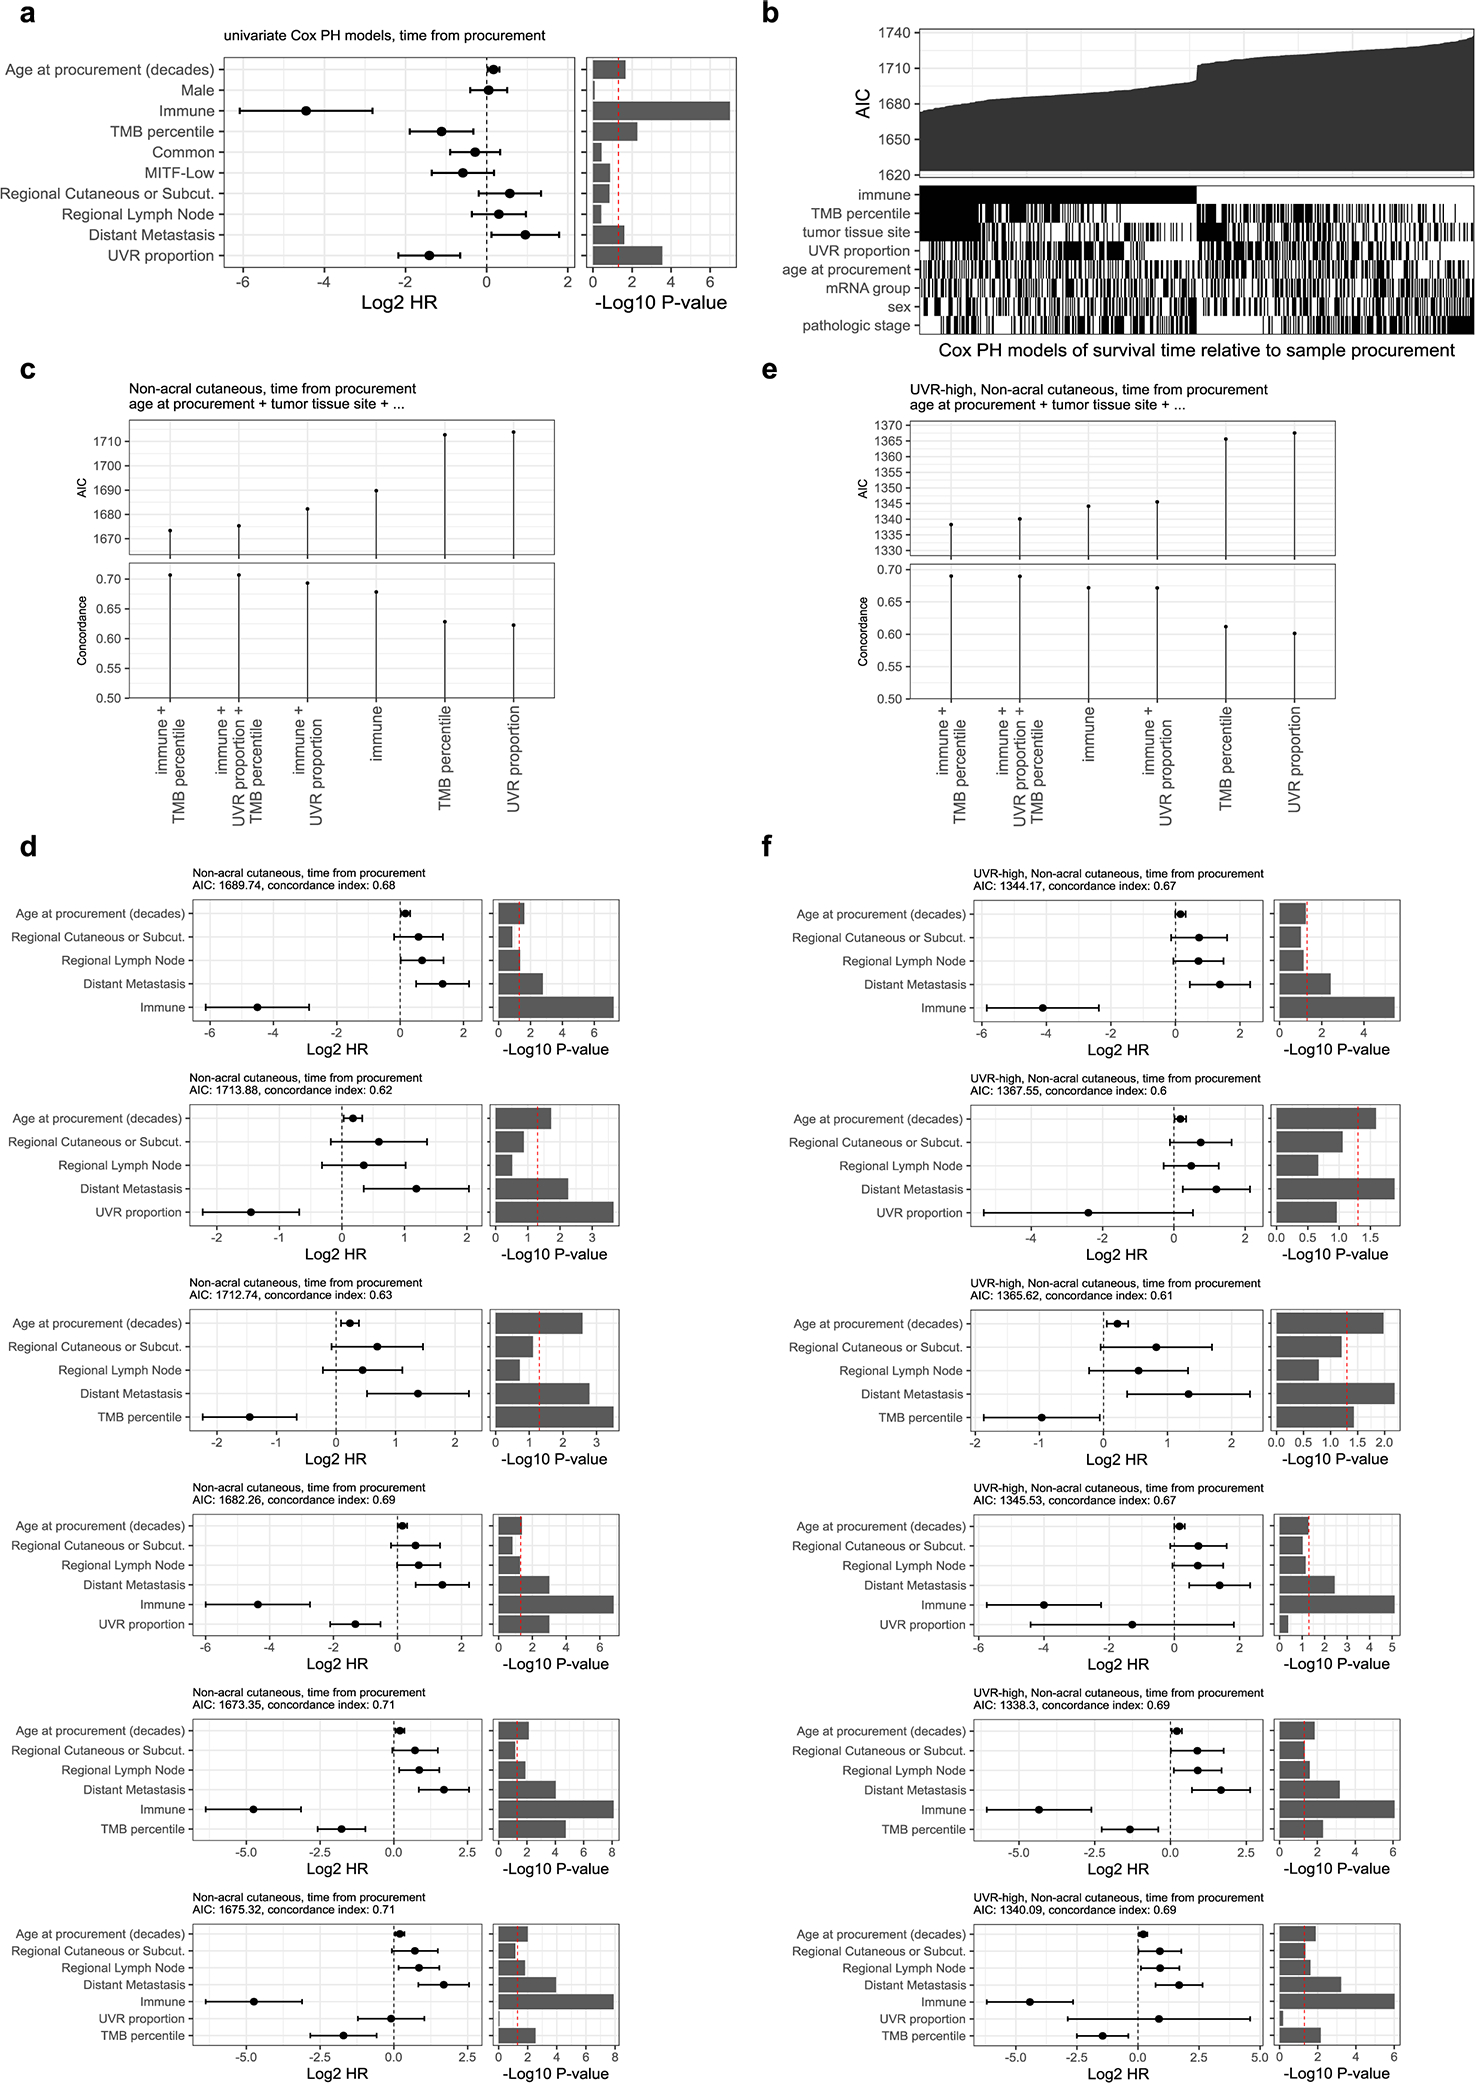
(a) Univariable Cox model Hazard ratio and unadjusted p-value of single predictors (n = 347 tumor samples). (b) Relative quality of univariable and multivariable Cox survival models including all subsets of predictors. Models are ordered from left to right by increasing Akaike Information Criteria (AIC, top). The bottom panel (binary matrix) indicates which predictors were included in each model (n = 347 tumor samples). (c and e) Relative quality of multivariable Cox regression models including different subsets of predictors for unstratified (n = 347) and UVR-high (n = 301) tumor samples. All models include age at procurement and tumor tissue site, in addition to the predictors specified on the x-axis (indicated by ellipses). The y-axis shows the Akaike information criteria (AIC, top subpanel) and concordance index (lower subpanel). (d and f) Coefficients of the multivariable Cox regression models shown in (c) and (e). For each subpanel, the left part shows the coefficients, expressed in log2 hazard-ratios with 95% confidence intervals, and the right part shows the coefficient p-values. Cox model coefficient p-values in all panels were computed using a two-tailed z Wald test.
Extended Data Figure 9. Single predictors evaluation and relative quality of multivariable overall survival models in non-acral cutaneous melanomas.
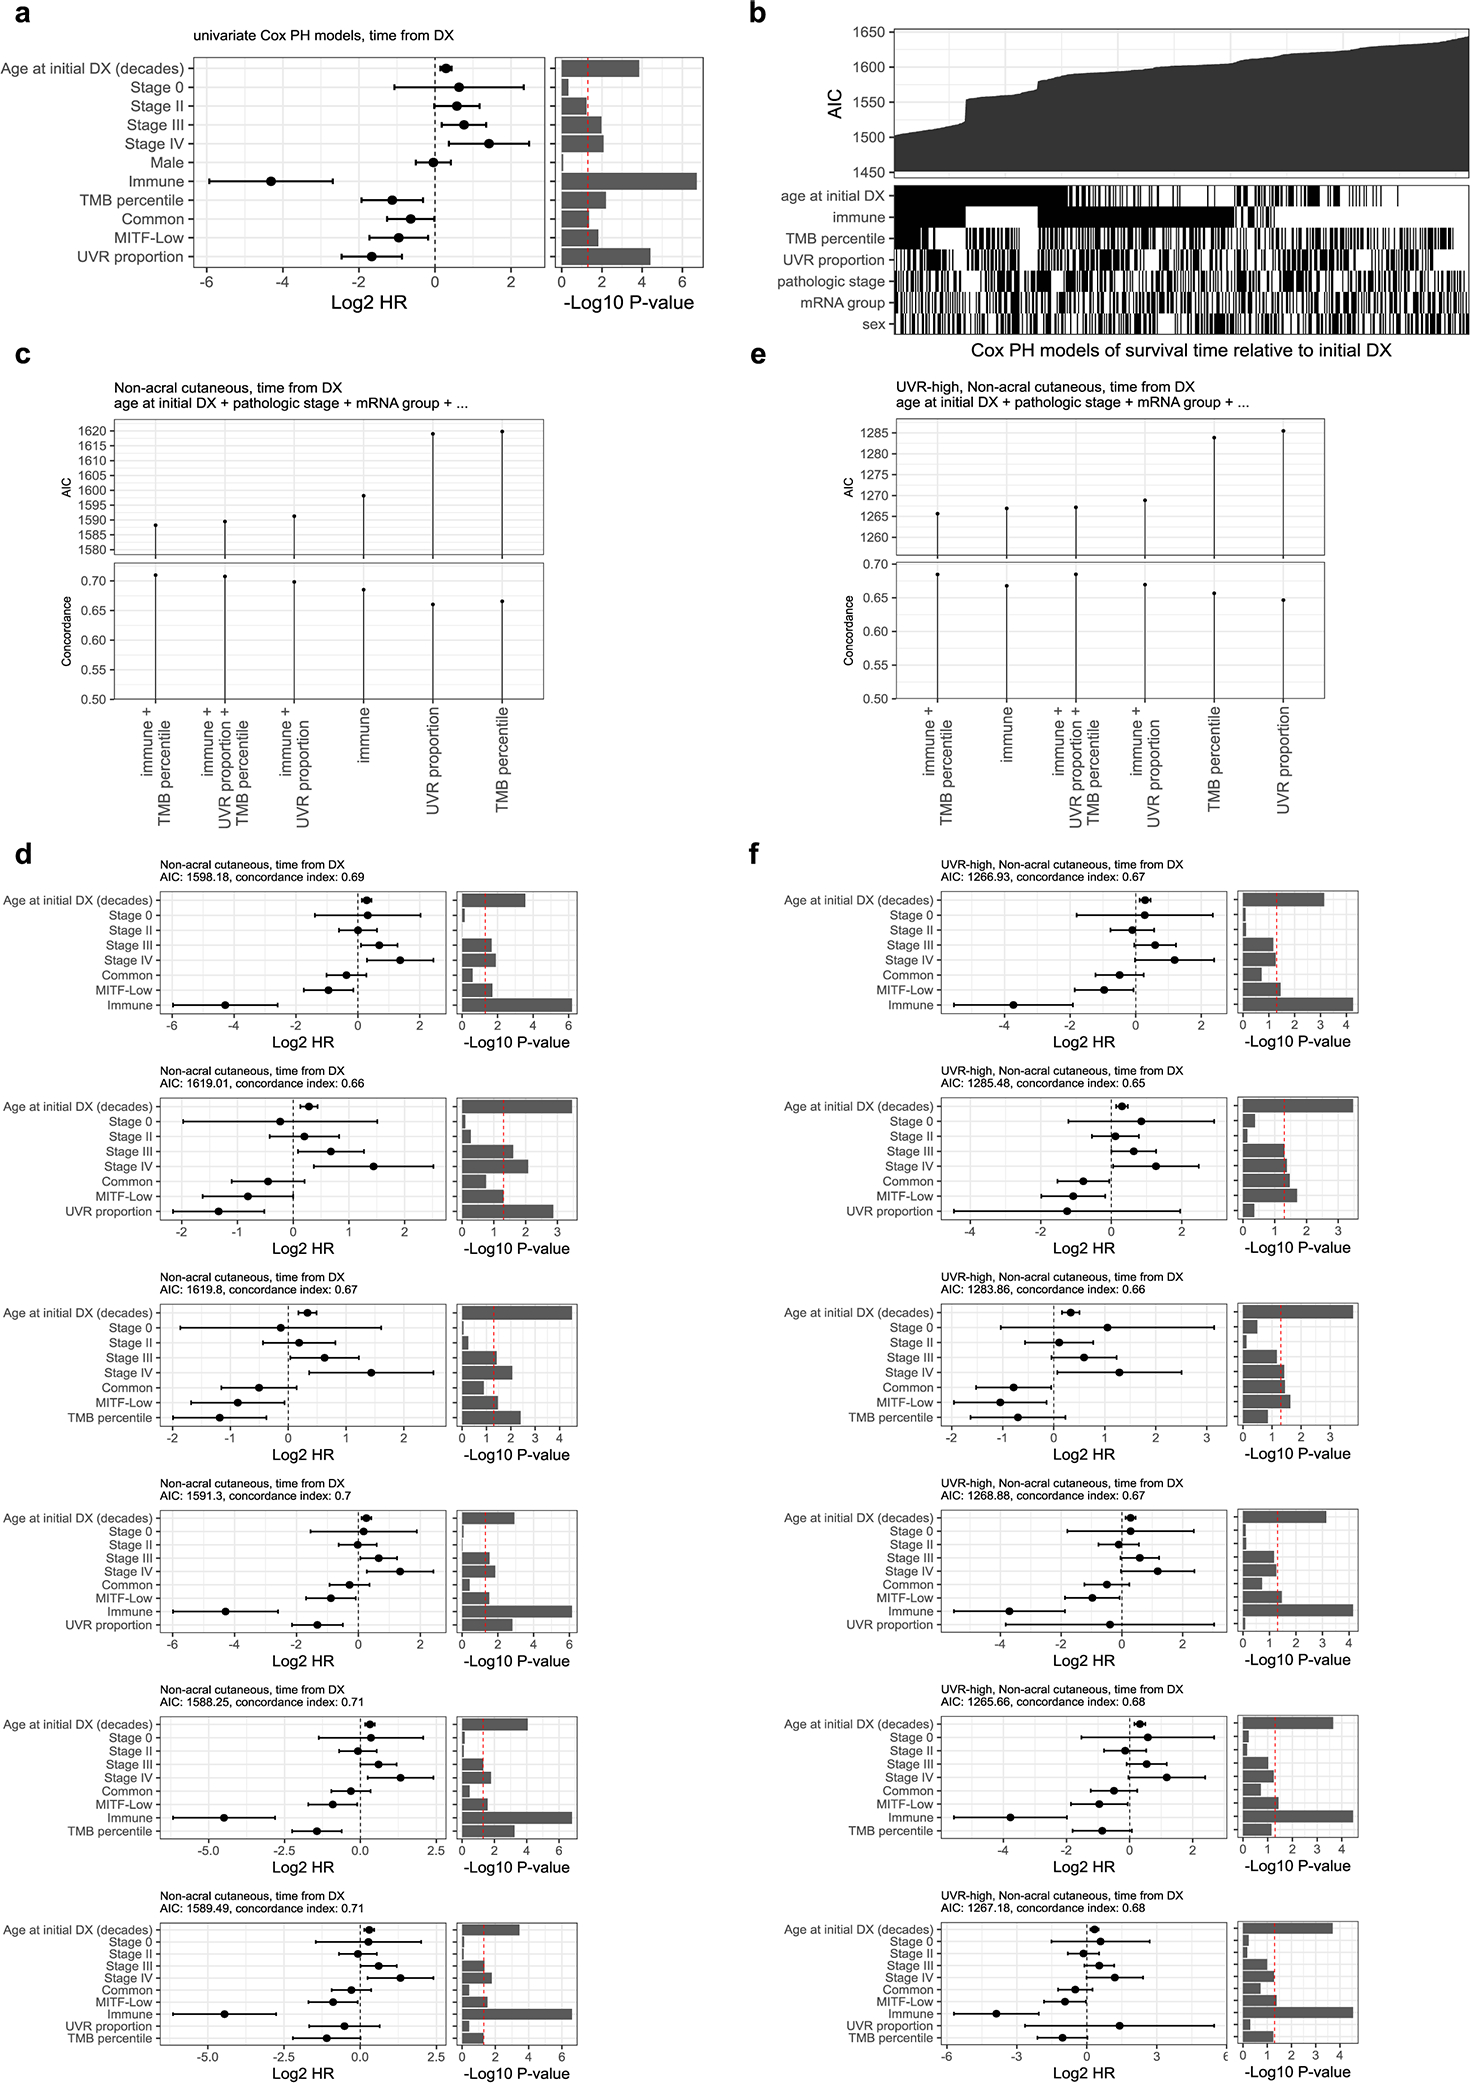
(a) Univariable Cox model Hazard ratio and unadjusted p-value of single predictors (n = 347 tumor samples). (b) Relative quality of univariable and multivariable Cox survival models including all subsets of predictors. Models are ordered from left to right by increasing Akaike Information Criteria (AIC, top). The bottom panel (binary matrix) indicates which predictors were included in each model (n = 347 tumor samples). (c and e) Relative quality of multivariable Cox regression models including different subsets of predictors for unstratified (n = 347) and UVR-high (n = 301) tumor samples. All models include age at initial diagnosis, pathologic stage, and mRNA subgroup in addition to the predictors specified on the x-axis (indicated by ellipses). The y-axis shows the Akaike information criteria (AIC, top subpanel) and concordance index (lower subpanel). (d and f) Coefficients of the multivariable Cox regression models shown in (c) and (e). For each subpanel, the left part shows the coefficients, expressed in log2 hazard-ratios with 95% confidence intervals, and the right part shows the coefficient p-values. Cox model coefficient p-values in all panels were computed using a two-tailed z Wald test.
Extended Data Figure 10. Relative quality of multivariable Cox regression models including TMB or neoantigen load.
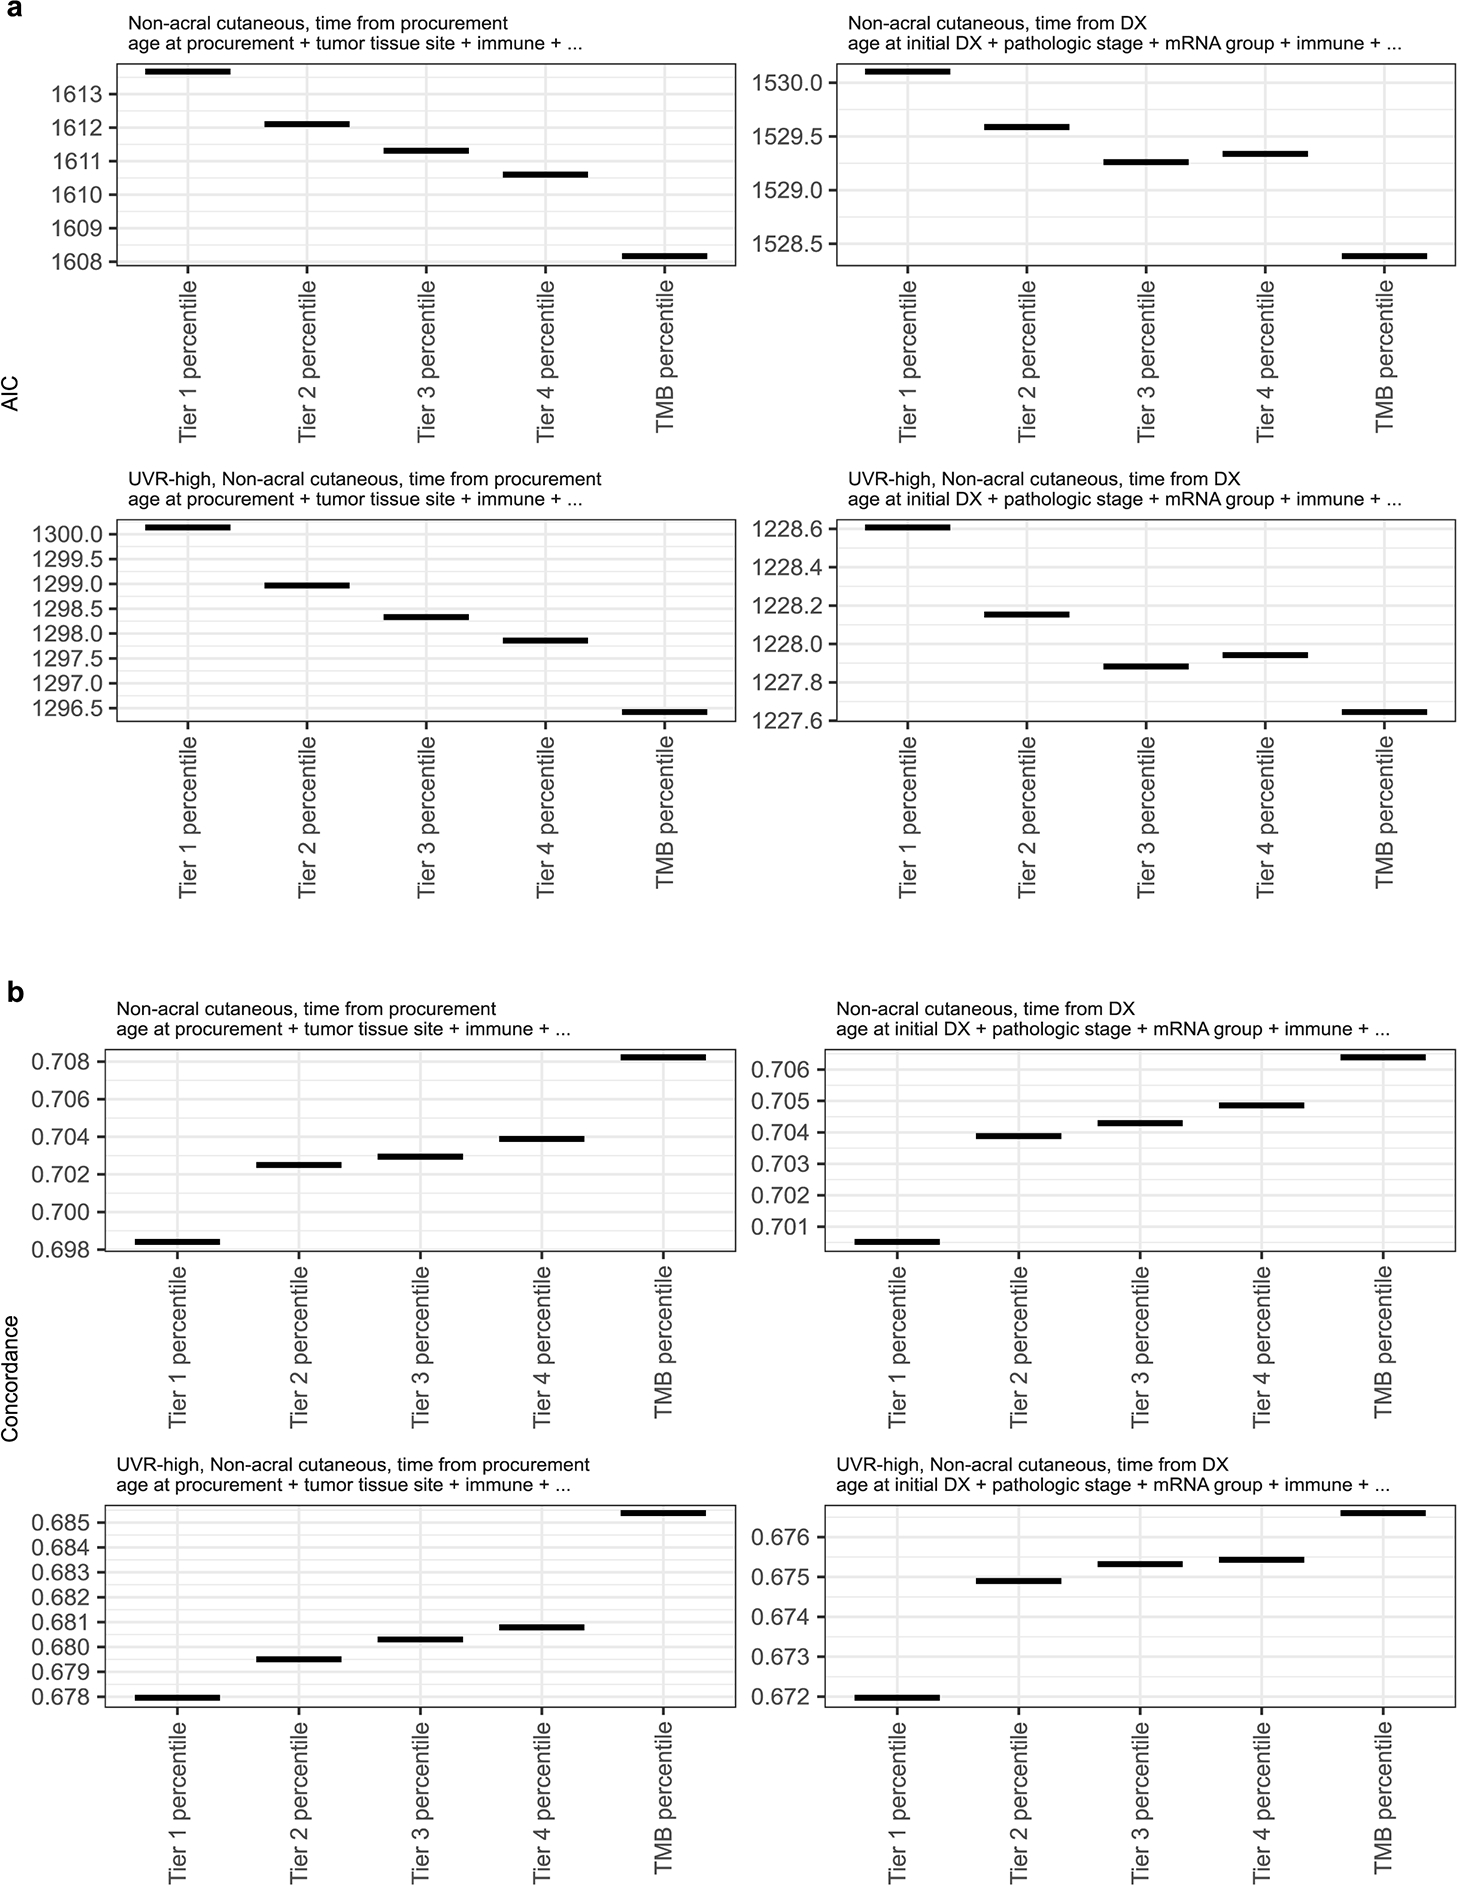
(a) Concordance index. (b) Akaike information criteria. Models were restricted to non-acral cutaneous melanomas with no missing data for all predictors (n = 336 tumors, of which 293 tumors were UVR-high).
Supplementary Material
ACKNOWLEDGEMENTS
We would like to thank J. Pelletier, N. Beauchemin, A. Lissouba, and the Watson lab for their critical comments on the manuscript. We thank and acknowledge the Analysis Working Group of the SKCM TCGA project and the authors of Hodis et al., 2012, Van Allen et al. 2015, Krauthammer et al. 2015, Hayward et al., 2017, whose past work enabled this study. We would like to especially thank N. Hayward, M. Krauthammer and R. Halaban for answering specific questions related to these studies, and R. Marais and P. Mundra for sharing their curated list of non-acral cutaneous melanoma cases from TCGA.21
This work was supported by the V Foundation (IRW V Scholar Grant ID #: V2016–023). IRW is a Canada Research Chair II and funded by grants from the Melanoma Research Alliance (MRA – Grant #412429), the Canadian Institute of Health Research (CIHR – Grant # PJT-152975) and the Terry Fox Research Institute and Genome Québec (TFRI – Grant #1084). RA is a recipient of the Canderel Graduate Studentship, the Fonds de recherche du Québec – Santé (FRQS) Doctoral Training Award and the CIHR Doctoral Award - Frederick Banting and Charles Best Canada Graduate Scholarships (CGS-D).
Footnotes
COMPETING INTERESTS
The authors declare no competing interests.
REFERENCES
- 1.Bastian BC The molecular pathology of melanoma: an integrated taxonomy of melanocytic neoplasia. Annu Rev Pathol 9, 239–71 (2014). [DOI] [PMC free article] [PubMed] [Google Scholar]
- 2.Hodis E et al. A landscape of driver mutations in melanoma. Cell 150, 251–63 (2012). [DOI] [PMC free article] [PubMed] [Google Scholar]
- 3.Krauthammer M et al. Exome sequencing identifies recurrent somatic RAC1 mutations in melanoma. Nat Genet 44, 1006–14 (2012). [DOI] [PMC free article] [PubMed] [Google Scholar]
- 4.Cancer Genome Atlas Network. Genomic Classification of Cutaneous Melanoma. Cell 161, 1681–96 (2015). [DOI] [PMC free article] [PubMed] [Google Scholar]
- 5.Brash DE UV signature mutations. Photochem Photobiol 91, 15–26 (2015). [DOI] [PMC free article] [PubMed] [Google Scholar]
- 6.Joosse A et al. Superior outcome of women with stage I/II cutaneous melanoma: pooled analysis of four European Organisation for Research and Treatment of Cancer phase III trials. J Clin Oncol 30, 2240–7 (2012). [DOI] [PubMed] [Google Scholar]
- 7.Joosse A et al. Sex is an independent prognostic indicator for survival and relapse/progression-free survival in metastasized stage III to IV melanoma: a pooled analysis of five European organisation for research and treatment of cancer randomized controlled trials. J Clin Oncol 31, 2337–46 (2013). [DOI] [PubMed] [Google Scholar]
- 8.van Kempen LC et al. The protein phosphatase 2A regulatory subunit PR70 is a gonosomal melanoma tumor suppressor gene. Sci Transl Med 8, 369ra177 (2016). [DOI] [PubMed] [Google Scholar]
- 9.Dees ND et al. MuSiC: identifying mutational significance in cancer genomes. Genome Res 22, 1589–98 (2012). [DOI] [PMC free article] [PubMed] [Google Scholar]
- 10.Lawrence MS et al. Mutational heterogeneity in cancer and the search for new cancer-associated genes. Nature 499, 214–218 (2013). [DOI] [PMC free article] [PubMed] [Google Scholar]
- 11.Mularoni L, Sabarinathan R, Deu-Pons J, Gonzalez-Perez A & Lopez-Bigas N OncodriveFML: a general framework to identify coding and non-coding regions with cancer driver mutations. Genome Biol 17, 128 (2016). [DOI] [PMC free article] [PubMed] [Google Scholar]
- 12.Martincorena I et al. Universal Patterns of Selection in Cancer and Somatic Tissues. Cell 171, 1029–1041 e21 (2017). [DOI] [PMC free article] [PubMed] [Google Scholar]
- 13.Fredriksson NJ et al. Recurrent promoter mutations in melanoma are defined by an extended context-specific mutational signature. PLoS Genet 13, e1006773 (2017). [DOI] [PMC free article] [PubMed] [Google Scholar]
- 14.Mao P et al. ETS transcription factors induce a unique UV damage signature that drives recurrent mutagenesis in melanoma. Nat Commun 9, 2626 (2018). [DOI] [PMC free article] [PubMed] [Google Scholar]
- 15.Perera D et al. Differential DNA repair underlies mutation hotspots at active promoters in cancer genomes. Nature 532, 259-+ (2016). [DOI] [PubMed] [Google Scholar]
- 16.Sabarinathan R, Mularoni L, Deu-Pons J, Gonzalez-Perez A & Lopez-Bigas N Nucleotide excision repair is impaired by binding of transcription factors to DNA. Nature 532, 264-+ (2016). [DOI] [PubMed] [Google Scholar]
- 17.Lawrence MS et al. Discovery and saturation analysis of cancer genes across 21 tumour types. Nature 505, 495–501 (2014). [DOI] [PMC free article] [PubMed] [Google Scholar]
- 18.Hayward NK et al. Whole-genome landscapes of major melanoma subtypes. Nature 545, 175–180 (2017). [DOI] [PubMed] [Google Scholar]
- 19.Krauthammer M et al. Exome sequencing identifies recurrent mutations in NF1 and RASopathy genes in sun-exposed melanomas. Nat Genet 47, 996–1002 (2015). [DOI] [PMC free article] [PubMed] [Google Scholar]
- 20.Van Allen EM et al. Genomic correlates of response to CTLA-4 blockade in metastatic melanoma. Science 350, 207–211 (2015). [DOI] [PMC free article] [PubMed] [Google Scholar]
- 21.Trucco LD et al. Ultraviolet radiation-induced DNA damage is prognostic for outcome in melanoma (vol 25, pg 221, 2018). Nature Medicine 25, 350–350 (2019). [DOI] [PubMed] [Google Scholar]
- 22.Alexandrov LB et al. The Repertoire of Mutational Signatures in Human Cancer. bioRxiv, 322859 (2019). [Google Scholar]
- 23.Kircher M et al. A general framework for estimating the relative pathogenicity of human genetic variants. Nat Genet 46, 310–5 (2014). [DOI] [PMC free article] [PubMed] [Google Scholar]
- 24.Pollard KS, Hubisz MJ, Rosenbloom KR & Siepel A Detection of nonneutral substitution rates on mammalian phylogenies. Genome Res 20, 110–21 (2010). [DOI] [PMC free article] [PubMed] [Google Scholar]
- 25.Ng PC & Henikoff S SIFT: Predicting amino acid changes that affect protein function. Nucleic Acids Res 31, 3812–4 (2003). [DOI] [PMC free article] [PubMed] [Google Scholar]
- 26.Curtin JA, Busam K, Pinkel D & Bastian BC Somatic activation of KIT in distinct subtypes of melanoma. J Clin Oncol 24, 4340–6 (2006). [DOI] [PubMed] [Google Scholar]
- 27.Newell F et al. Whole-genome landscape of mucosal melanoma reveals diverse drivers and therapeutic targets. Nat Commun 10, 3163 (2019). [DOI] [PMC free article] [PubMed] [Google Scholar]
- 28.Wong SQ et al. Whole exome sequencing identifies a recurrent RQCD1 P131L mutation in cutaneous melanoma. Oncotarget 6, 1115–27 (2015). [DOI] [PMC free article] [PubMed] [Google Scholar]
- 29.Rodriguez CI & Setaluri V Cyclic AMP (cAMP) signaling in melanocytes and melanoma. Arch Biochem Biophys 563, 22–7 (2014). [DOI] [PubMed] [Google Scholar]
- 30.Stratakis CA, Kirschner LS & Carney JA Clinical and molecular features of the Carney complex: diagnostic criteria and recommendations for patient evaluation. J Clin Endocrinol Metab 86, 4041–6 (2001). [DOI] [PubMed] [Google Scholar]
- 31.Arafeh R et al. Recurrent inactivating RASA2 mutations in melanoma. Nat Genet 47, 1408–10 (2015). [DOI] [PMC free article] [PubMed] [Google Scholar]
- 32.Dunford A et al. Tumor-suppressor genes that escape from X-inactivation contribute to cancer sex bias. Nat Genet 49, 10–16 (2017). [DOI] [PMC free article] [PubMed] [Google Scholar]
- 33.Gupta S, Artomov M, Goggins W, Daly M & Tsao H Gender Disparity and Mutation Burden in Metastatic Melanoma. J Natl Cancer Inst 107(2015). [DOI] [PMC free article] [PubMed] [Google Scholar]
- 34.Cruciat CM et al. RNA Helicase DDX3 Is a Regulatory Subunit of Casein Kinase 1 in Wnt-beta-Catenin Signaling. Science 339, 1436–1441 (2013). [DOI] [PubMed] [Google Scholar]
- 35.Consortium EP An integrated encyclopedia of DNA elements in the human genome. Nature 489, 57–74 (2012). [DOI] [PMC free article] [PubMed] [Google Scholar]
- 36.Phung B et al. The X-Linked DDX3X RNA Helicase Dictates Translation Reprogramming and Metastasis in Melanoma. Cell Rep 27, 3573–3586 e7 (2019). [DOI] [PubMed] [Google Scholar]
- 37.Soto-Rifo R & Ohlmann T The role of the DEAD-box RNA helicase DDX3 in mRNA metabolism. Wiley Interdiscip Rev RNA 4, 369–85 (2013). [DOI] [PubMed] [Google Scholar]
- 38.Van Nostrand EL et al. A Large-Scale Binding and Functional Map of Human RNA Binding Proteins. bioRxiv, 179648 (2018). [DOI] [PMC free article] [PubMed] [Google Scholar]
- 39.Carter SL et al. Absolute quantification of somatic DNA alterations in human cancer. Nat Biotechnol 30, 413–21 (2012). [DOI] [PMC free article] [PubMed] [Google Scholar]
- 40.Mermel CH et al. GISTIC2.0 facilitates sensitive and confident localization of the targets of focal somatic copy-number alteration in human cancers. Genome Biol 12, R41 (2011). [DOI] [PMC free article] [PubMed] [Google Scholar]
- 41.Lauss M, Nsengimana J, Staaf J, Newton-Bishop J & Jonsson G Consensus of Melanoma Gene Expression Subtypes Converges on Biological Entities. J Invest Dermatol 136, 2502–2505 (2016). [DOI] [PubMed] [Google Scholar]
- 42.Moffitt RA et al. Virtual microdissection identifies distinct tumor- and stroma-specific subtypes of pancreatic ductal adenocarcinoma. Nat Genet 47, 1168–78 (2015). [DOI] [PMC free article] [PubMed] [Google Scholar]
- 43.Aran D, Hu Z & Butte AJ xCell: digitally portraying the tissue cellular heterogeneity landscape. Genome Biol 18, 220 (2017). [DOI] [PMC free article] [PubMed] [Google Scholar]
- 44.Subramanian A et al. Gene set enrichment analysis: a knowledge-based approach for interpreting genome-wide expression profiles. Proc Natl Acad Sci U S A 102, 15545–50 (2005). [DOI] [PMC free article] [PubMed] [Google Scholar]
- 45.Mootha VK et al. PGC-1alpha-responsive genes involved in oxidative phosphorylation are coordinately downregulated in human diabetes. Nat Genet 34, 267–73 (2003). [DOI] [PubMed] [Google Scholar]
- 46.Snyder A et al. Genetic basis for clinical response to CTLA-4 blockade in melanoma. N Engl J Med 371, 2189–2199 (2014). [DOI] [PMC free article] [PubMed] [Google Scholar]
- 47.Klebanov N et al. Burden of unique and low prevalence somatic mutations correlates with cancer survival. Sci Rep 9, 4848 (2019). [DOI] [PMC free article] [PubMed] [Google Scholar]
- 48.Miao D et al. Genomic correlates of response to immune checkpoint blockade in microsatellite-stable solid tumors. Nat Genet 50, 1271–1281 (2018). [DOI] [PMC free article] [PubMed] [Google Scholar]
- 49.Liu D et al. Integrative molecular and clinical modeling of clinical outcomes to PD1 blockade in patients with metastatic melanoma. Nat Med 25, 1916–1927 (2019). [DOI] [PMC free article] [PubMed] [Google Scholar]
- 50.Thorsson V et al. The Immune Landscape of Cancer. Immunity 48, 812–830 e14 (2018). [DOI] [PMC free article] [PubMed] [Google Scholar]
- 51.Ott PA et al. An immunogenic personal neoantigen vaccine for patients with melanoma. Nature 547, 217–221 (2017). [DOI] [PMC free article] [PubMed] [Google Scholar]
- 52.Tsao H, Bevona C, Goggins W & Quinn T The transformation rate of moles (melanocytic nevi) into cutaneous melanoma - A population-based estimate. Archives of Dermatology 139, 282–288 (2003). [DOI] [PubMed] [Google Scholar]
- 53.Snijders Blok L et al. Mutations in DDX3X Are a Common Cause of Unexplained Intellectual Disability with Gender-Specific Effects on Wnt Signaling. Am J Hum Genet 97, 343–52 (2015). [DOI] [PMC free article] [PubMed] [Google Scholar]
- 54.Ditton HJ, Zimmer J, Kamp C, Rajpert-De Meyts E & Vogt PH The AZFa gene DBY (DDX3Y) is widely transcribed but the protein is limited to the male germ cells by translation control. Hum Mol Genet 13, 2333–41 (2004). [DOI] [PubMed] [Google Scholar]
- 55.Wang T et al. Identification and characterization of essential genes in the human genome. Science 350, 1096–1101 (2015). [DOI] [PMC free article] [PubMed] [Google Scholar]
- 56.Conforti F et al. Cancer immunotherapy efficacy and patients’ sex: a systematic review and meta-analysis. Lancet Oncol 19, 737–746 (2018). [DOI] [PubMed] [Google Scholar]
- 57.Lazova R et al. Spitz nevi and Spitzoid melanomas: exome sequencing and comparison with conventional melanocytic nevi and melanomas. Mod Pathol 30, 640–649 (2017). [DOI] [PMC free article] [PubMed] [Google Scholar]
- 58.Smith LK, Rao AD & McArthur GA Targeting metabolic reprogramming as a potential therapeutic strategy in melanoma. Pharmacol Res 107, 42–47 (2016). [DOI] [PubMed] [Google Scholar]
- 59.Johannessen CM et al. A melanocyte lineage program confers resistance to MAP kinase pathway inhibition. Nature 504, 138–42 (2013). [DOI] [PMC free article] [PubMed] [Google Scholar]
- 60.Van Allen EM et al. The genetic landscape of clinical resistance to RAF inhibition in metastatic melanoma. Cancer Discov 4, 94–109 (2014). [DOI] [PMC free article] [PubMed] [Google Scholar]
- 61.Grossman RL et al. Toward a Shared Vision for Cancer Genomic Data. N Engl J Med 375, 1109–12 (2016). [DOI] [PMC free article] [PubMed] [Google Scholar]
- 62.Zhang J et al. International Cancer Genome Consortium Data Portal--a one-stop shop for cancer genomics data. Database (Oxford) 2011, bar026 (2011). [DOI] [PMC free article] [PubMed] [Google Scholar]
- 63.Lawrence M et al. Software for computing and annotating genomic ranges. PLoS Comput Biol 9, e1003118 (2013). [DOI] [PMC free article] [PubMed] [Google Scholar]
- 64.Cingolani P et al. A program for annotating and predicting the effects of single nucleotide polymorphisms, SnpEff: SNPs in the genome of Drosophila melanogaster strain w1118; iso-2; iso-3. Fly (Austin) 6, 80–92 (2012). [DOI] [PMC free article] [PubMed] [Google Scholar]
- 65.Gerstein MB et al. Architecture of the human regulatory network derived from ENCODE data. Nature 489, 91–100 (2012). [DOI] [PMC free article] [PubMed] [Google Scholar]
- 66.Kent WJ et al. The human genome browser at UCSC. Genome Res 12, 996–1006 (2002). [DOI] [PMC free article] [PubMed] [Google Scholar]
- 67.Fabregat A et al. The Reactome Pathway Knowledgebase. Nucleic Acids Res 46, D649–D655 (2018). [DOI] [PMC free article] [PubMed] [Google Scholar]
- 68.Medvedeva YA et al. EpiFactors: a comprehensive database of human epigenetic factors and complexes. Database (Oxford) 2015, bav067 (2015). [DOI] [PMC free article] [PubMed] [Google Scholar]
- 69.Carter S, Meyerson M & Getz G Accurate estimation of homologue-specific DNA concentration-ratios in cancer samples allows long-range haplotyping. Nat. Preced, 59–87 (2011). [Google Scholar]
- 70.Zack TI et al. Pan-cancer patterns of somatic copy number alteration. Nat Genet 45, 1134–40 (2013). [DOI] [PMC free article] [PubMed] [Google Scholar]
- 71.Gaujoux R & Seoighe C A flexible R package for nonnegative matrix factorization. Bmc Bioinformatics 11(2010). [DOI] [PMC free article] [PubMed] [Google Scholar]
- 72.Senbabaoglu Y, Michailidis G & Li JZ Critical limitations of consensus clustering in class discovery. Sci Rep 4, 6207 (2014). [DOI] [PMC free article] [PubMed] [Google Scholar]
- 73.Wilkerson MD & Hayes DN ConsensusClusterPlus: a class discovery tool with confidence assessments and item tracking. Bioinformatics 26, 1572–3 (2010). [DOI] [PMC free article] [PubMed] [Google Scholar]
- 74.Love MI, Huber W & Anders S Moderated estimation of fold change and dispersion for RNA-seq data with DESeq2. Genome Biology 15(2014). [DOI] [PMC free article] [PubMed] [Google Scholar]
- 75.Morgan M, Pages H, Obenchain V & Hayden N Rsamtools: Binary alignment (BAM), FASTA, variant call (BCF), and tabix file import. R package version 1.28.0 edn (2017). [Google Scholar]
- 76.Ritchie ME et al. limma powers differential expression analyses for RNA-sequencing and microarray studies. Nucleic Acids Research 43(2015). [DOI] [PMC free article] [PubMed] [Google Scholar]
- 77.Robinson MD, McCarthy DJ & Smyth GK edgeR: a Bioconductor package for differential expression analysis of digital gene expression data. Bioinformatics 26, 139–140 (2010). [DOI] [PMC free article] [PubMed] [Google Scholar]
- 78.Szolek A et al. OptiType: precision HLA typing from next-generation sequencing data. Bioinformatics 30, 3310–6 (2014). [DOI] [PMC free article] [PubMed] [Google Scholar]
- 79.Jurtz V et al. NetMHCpan-4.0: Improved Peptide-MHC Class I Interaction Predictions Integrating Eluted Ligand and Peptide Binding Affinity Data. J Immunol 199, 3360–3368 (2017). [DOI] [PMC free article] [PubMed] [Google Scholar]
- 80.Tatlow PJ & Piccolo SR A cloud-based workflow to quantify transcript-expression levels in public cancer compendia. Sci Rep 6, 39259 (2016). [DOI] [PMC free article] [PubMed] [Google Scholar]
Associated Data
This section collects any data citations, data availability statements, or supplementary materials included in this article.
Supplementary Materials
Data Availability Statement
Previously published melanoma somatic variants that were reanalyzed in this study are available from the associated publications:
Hodis et al. 2012 (https://doi.org/10.1016/j.cell.2012.06.024, Supplementary Table S4A),
Krauthammer et al. 2015 (https://doi.org/10.1038/ng.3361, Supplementary Data 3) and
Van Allen at al. 2015 (https://doi.org/10.1126/science.aad0095, Supplementary Table S1).
The human melanoma data generated by the TCGA Research Network (http://cancergenome.nih.gov/) can be accessed from the GDC Data Portal (https://portal.gdc.cancer.gov/), after approval for dbGap Study Accession phs000178 (https://www.ncbi.nlm.nih.gov/projects/gap/cgi-bin/study.cgi?study_id=phs000178.v10.p8), due to the presence of personally identifiable information, such as a patient’s germline DNA variants.
The following MAFs were used:
TCGA.SKCM.muse.4cd49f89-d7e2–4333-9872–0bff5327c896.protected.maf
TCGA.SKCM.mutect.bd022199-d399–45db-8474–6dc1f3aad457.protected.maf
TCGA.SKCM.somaticsniper.4ff8ab0f-1a75–44f6-af48–2b30fc6d5a08.protected.maf
TCGA.SKCM.varscan.a83548c2-e6b2–45cf-a7c3-ec099daf30ce.protected.maf
The somatic variants from 183 human melanoma whole genomes (Hayward et al. 2017) can be accessed from the International Cancer Genome Consortium (ICGC) data portal (https://dcc.icgc.org/releases/release_23/Projects/MELA-AU), without restriction.
RNA-seq data from DDX3X knockdown in HT144 cell lines can be accessed from the Sequence Read Archive (https://www.ncbi.nlm.nih.gov/sra), using accession identifiers provided in Supplementary Table 14.
eCLIP data and expression data from DDX3X knockdown in K562 and HepG2 human cell lines can be downloaded from the ENCODE portal (https://www.encodeproject.org/), using accession identifiers provided in Supplementary Table 16 and 15, respectively.
Regions considered for neutral mutation rate estimation were defined using the following files available from Ensembl or the UCSC Genome Browser website:
http://hgdownload.cse.ucsc.edu/goldenpath/hg19/database/phastConsElements100way.txt.gz
http://hgdownload.cse.ucsc.edu/goldenpath/hg19/database/pseudoYale60.txt.gz
ftp://ftp.ensembl.org/pub/release-75/gtf/homo_sapiens/Homo_sapiens.GRCh37.75.gtf.gz
ENCODE’s ETS transcription factor binding sites were downloaded from the UCSC Genome Browser website:
CCLE cell lines gene expression data was obtained from:
https://portals.broadinstitute.org/ccle/data/CCLE_DepMap_18q3_RNAseq_reads_20180718.gct
Cell line annotations were obtained from DepMap:
https://depmap.org/portal/download/all/DepMap-2018q4-celllines.csv
Gene lengths used for RPKM calculations were obtained from:
ftp://ftp.ensembl.org/pub/release-86/gtf/homo_sapiens/Homo_sapiens.GRCh38.86.gtf.gz
The mutated genes pathway enrichment analysis was based on the
EpiFactors database
(downloaded on 2018–01-21, http://epifactors.autosome.ru/) and the
Reactome database
(downloaded on 2018–01-20, https://reactome.org/, ENSEMBL- to-pathways).
The mRNA subgroups pathway enrichment analysis was based on
MSigDB (v6.2): https://www.gsea-msigdb.org/gsea/msigdb/index.jsp
We obtained transcript level expression (in TPM) for TCGA-SKCM from: https://osf.io/gqrz9
Gene set enrichment analyses for DDX3X differential expression was based on the
Reactome database (downloaded on 2019–10-06): https://reactome.org/
For the GISTIC2 analysis of recurrent focal copy-number alteration, we used the following reference file provided by the GDC: snp6.na35.liftoverhg38.txt.zip
(https://gdc.cancer.gov/about-data/data-harmonization-and-generation/gdc-reference-files/)
The COSMIC Mutation Signature definitions were downloaded from the DeconstructSigs website:
https://github.com/raerose01/deconstructSigs/blob/master/data/signatures.exome.cosmic.v3.may2019.rda
The combined set of reannotated variants, excluding those protected by the TCGA, can be accessed at our GitHub repository:
https://github.com/ianwatsonlab/multiomic_melanoma_study_2019


