Abstract
A main advantage of PET is that it provides quantitative measures of the radiotracer concentration, but its accuracy is confounded by factors including attenuation, subject motion, and limited spatial resolution. Using the information from one simultaneously acquired morphologic MR sequence with embedded navigators for MR motion correction (MC), we propose an efficient method, MR-assisted PET data optimization (MaPET), for attenuation correction (AC), PET MC, and anatomy-aided reconstruction. Methods: For AC, voxelwise linear attenuation coefficient maps were generated using an SPM8-based method on the MR volume. The embedded navigators were used to derive head motion estimates for event-based PET MC. The anatomy provided by the MR volume was incorporated into the PET image reconstruction using a kernel-based method. Region-based analyses were performed to assess the quality of images generated through various stages of PET data optimization. Results: The optimized PET images reconstructed with MaPET were superior in image quality to images reconstructed using only AC, with high signal-to-noise ratio and low coefficient of variation (5.08 and 0.229 in a composite cortical region compared with 3.12 and 0.570, P < 10−4 for both comparisons). The optimized images were also shown using the Cohen’s d metric to achieve a greater effect size in distinguishing cortical regions with hypometabolism from regions of preserved metabolism. Conclusion: We have shown that the spatiotemporally correlated data acquired using a single MR sequence can be used for PET attenuation, motion, and partial-volume effects corrections and that the MaPET method may enable more accurate assessment of pathologic changes in dementia and other brain disorders.
Keywords: PET/MRI, motion correction, anatomy-aided reconstruction, simultaneous imaging
Interest in simultaneous PET and MRI (PET/MRI) has been growing because of its ability to provide complementary, and concurrent, information about morphologic, functional, metabolic, and neurochemical changes in many neurologic disorders (1,2), including dementia (1–4), and whole-body applications (3). Importantly, in addition to providing a simultaneous look at these features through the strengths of each modality individually, the combined tool allows us to leverage the MR information to improve the quantification of PET data (1). Although PET has the potential to provide highly quantitative measures of the radiotracer concentration over time, its accuracy is confounded by several factors. First, the attenuation of the 511-keV annihilation photons needs to be accounted for in both qualitative and quantitative studies. Second, subject motion is difficult to avoid, particularly in patients with disorders of the central nervous system, and leads to degradation of the images when it has large amplitude (5). Third, the limited spatial resolution leads in PET to under- or overestimation in tissue activity concentrations (i.e., partial-volume effects [PVEs]) that depend on the activity distribution and the size and shape of the structures from which the measurement is being made (6). These subject-dependent effects are especially apparent in dementia subjects, who are more prone to motion (7) and may have brain atrophy with regional variability (8).
Since the transmission or CT-based methods traditionally used to produce attenuation maps (μ-maps) that describe tissue attenuation are not available in integrated PET/MRI scanners, MR-based methods had to be developed for attenuation correction (AC) (9). There are 2 main approaches for MR-based AC: atlas-based and segmentation-based techniques. In the former, an atlas that provides the linear attenuation coefficients is warped and coregistered to each new subject (10,11); in the latter, discrete coefficients are assigned to classes of voxels segmented through image processing or machine learning (12–14). In addition, methods that combine the strengths of both methods have been proposed (15–17); one of these methods has been shown to produce accurate μ-maps from one T1-weighted MR morphologic image alone (16).
To minimize the effect of head motion, other than methods using restraints in an attempt to eliminate movement (18), motion correction (MC) can be done through motion tracking with an external system, such as an optical system with cameras or markers (19), or with image-based systems. This tracking information can be used to compensate for subject motion before, after, or during image reconstruction. In the postreconstruction methods, the PET data are divided into smaller frames, and the images reconstructed from these frames are coregistered (20,21). The obvious limitation of this class of methods is that the intraframe motion cannot be fully accounted for (22). In contrast, event-based methods reposition the raw list-mode PET data to compensate for subject motion during the scan (23). When combined PET/MR systems for simultaneous data collection are used, however, the MR volumes acquired using echo planar imaging–based sequences can be exploited to implement an image-based system for motion tracking (24).
Finally, PVE correction (PVEC) can also use the MR data to improve PET quantification. One group of methods take a postprocessing route, such as solving the inverse of a matrix that relates the spill in–spill out relations of all brain regions of interest (the geometric transfer matrix method (25)) or the application of a voxelwise map of recovery factors obtained through convolving the brain regions with the point-spread function (the Müller-Gärtner method (26)). Another approach introduces modifications during image reconstruction by performing resolution modeling (27) or incorporating morphologic information (28,29). One such method uses a combination of MR morphology–based kernel functions to model the image to be reconstructed; this was shown to be superior in quantifying PET activity in static images with similar contrast levels compared with the traditional maximum-likelihood expectation-maximization method or the Bowsher method (30).
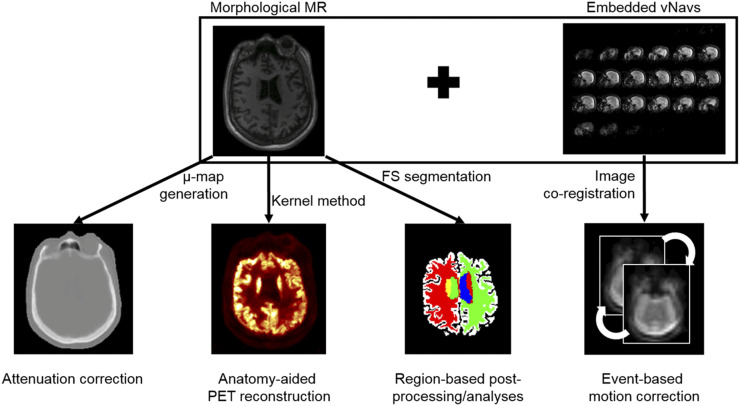
In this work, we combine each of these broad capabilities (AC, MC, and anatomy-aided reconstruction [AAR]) into a single workflow. We proposed using the magnetization-prepared rapid gradient echo (MPRAGE) sequence with embedded short 3-dimensional echo planar imaging volumetric navigators (“vNav-MPRAGE”) (31), originally used for within-sequence motion tracking and prospective MC of the MR data, to perform PET AC (16), MC (24), and AAR (30), a combined data processing approach we call MR-assisted PET data optimization (MaPET). In addition, for postprocessing and analysis, the vNav-MPRAGE sequence was also used for segmenting the regions of interest (Fig. 1). MaPET was applied to the PET data acquired simultaneously with the MPRAGE data to generate static PET images in dementia and mild cognitively impaired (MCI) subjects. The incremental and overall effects of these component corrections, with a focus on MC and AAR (AC is a standard part of established algorithms), on the resulting PET images were assessed qualitatively and quantitatively at a group level.
FIGURE 1.
A diagram of how MR information could be used to assist PET reconstruction, postprocessing, and analysis.
MATERIALS AND METHODS
Data Acquisition and PET Reconstruction
Twenty patients (19 dementia, 1 MCI; Table 1) were recruited to undergo 1 PET/MR examination. The study was approved by the local Institutional Review Board. Written informed consent was obtained from all participants or an authorized surrogate decision-maker. The PET data were acquired with a prototype MR-compatible brain PET scanner (“BrainPET”; Siemens Healthcare Inc.). Approximately 180 MBq of 18F-FDG were administered shortly after initiation of the MR acquisition, and dynamic PET data were acquired for 70 min. For each subject, a static 7-min frame (8 min for 3 subjects) consisting of PET data acquired simultaneously with the vNav-MPRAGE sequence (parameters provided in the following section) was reconstructed using the standard ordered-subsets expectation maximization (OSEM) algorithm (32), with 16 subsets and 4 iterations, accounting for random coincidences (33), detector sensitivity, attenuation, and scatter (34), and resolution modeling with the point-spread function defined in Bowen et al. (35).
TABLE 1.
Subjects Scanned in This Study
| Characteristic | Total number |
| Patients | 20 |
| Male | 11 |
| Female | 9 |
| AD | 11 |
| Typical AD | 6 |
| Posterior cortical atrophy | 1 |
| Logopenic primary progressive aphasia | 4 |
| FTD | 8 |
| Behavioral variant FTD | 4 |
| Semantic dementia | 3 |
| Progressive nonfluent aphasia | 1 |
| Amnestic mild cognitive impairment | 1 |
For each subject, 4 PET volumes were reconstructed: PETorig (reconstructed with the standard algorithm), PETMC (reconstructed with the standard algorithm using motion-compensated data), PETAAR (reconstructed with the AAR algorithm), and PETMaPET (reconstructed with AAR using motion-compensated data). MR-based AC was performed in all PET reconstructions. The PET volumes were reconstructed in a 2-pass fashion to eliminate potential residual attenuation-emission mismatch: the MPRAGE image was coregistered to the first-pass PETMC volume (using SPM8, 6 degrees of freedom rigid-body transformation), and the transformation parameters were used to generate the updated μ-maps used for the second-pass reconstruction for all PET images.
The final reconstructed PET volumes consisted of 153 slices with 256 × 256 voxels, 1.25 × 1.25 × 1.25 mm3 isotropic; this native PET space was the reference for all analyses. Region-based analyses were performed with the FreeSurfer-derived anatomic labels segmented from the coregistered MPRAGE image. For the PETorig and PETAAR, the inverse of the transformation parameters obtained by coregistering the PETorig volume to PETMC were used to move the labels into the PET space (SPM8).
MR Motion Estimation and Compensation
The T1-weighted vNav-MPRAGE sequence was acquired with the following parameters: echo time (TE), 1.66 ms; repetition time (TR), 2,530 ms; inversion time (TI), 1,100 ms; reconstruction matrix size, 280 × 280 × 256 voxels with voxel size, 1 × 1 × 1 mm3; 4 averages; total acquisition time, 7 min 23 s. In 3 cases, the following parameters were used: TE, 1.52 ms; TR, 2,200 ms; reconstruction matrix size, 256 × 256 × 256; total acquisition time, 8 min 24 s. The vNavs are embedded within the MPRAGE sequence with 8-mm isotropic voxels in a 256 × 256 × 256 mm field of view and acquisition parameters as described in Tisdall et al. (31): TE, 5 ms; TR, 11 ms; bandwidth, 4,596 Hz/px. The vNav and registration step (total acquisition and processing time, 355–475 ms) were inserted between the inversion pulse and readout train during each TR.
During the vNav-MPRAGE sequence acquisition, the vNav-based head motion estimates are used to update the MR field of view to reflect the subject’s movement every repetition time and to reconstruct the motion-corrected MPRAGE images.
MR-Based AC
MR-based AC was performed as previously described (16). Voxelwise linear attenuation coefficient maps (“μ-maps”) were generated using an SPM8-based approach method. Briefly, the MPRAGE volume was segmented into 6 tissue classes and independently warped nonrigidly to a CT-based template. The inverse transformations were applied to warp the template back into the subject space to generate a pseudo-CT image that was scaled to PET linear attenuation coefficients. The μ-map of the MR radiofrequency coils, also serving as the head holder and stationary in the PET space, was added to the head μ-map. The final μ-map was blurred with a 4-mm full width at half maximum gaussian kernel, forward projected, and exponentiated to yield the final AC factors.
MR-Based PET Motion Compensation
The vNav-based motion estimates were also used to correct the PET data before image reconstruction (24). Briefly, the motion parameters (3 translations along and 3 extrinsic rotations about the x, y, and z [axial] axes; saved on the MR console) were converted to the PET coordinate system and median-filtered separately with a 10-s temporal window; these estimates were used to adjust (per 10-s time interval) the PET lines of response raw data for MC. The transformed prompt and random coincidence lines of response data were binned into sinograms. The sensitivity data were transformed similarly before generating the normalization sinogram. The radiofrequency coil was transformed as part of the hardware for sensitivity and AC, whereas a time-weighted average of the coil attenuation sinograms was added to the μ-maps for scatter estimation and for the final reconstruction. The head μ-map was generated only in the MPRAGE position.
AAR
AAR of the PET data was performed as previously described (30). Briefly, the anatomic information was incorporated into the image reconstruction by formulating the image to be reconstructed as a combination of kernel functions with anatomic features derived from the structural T1-weighted MPRAGE data. In particular, the voxels xj of the image X to be reconstructed were modeled as a linear combination of kernel functions ,
where fj and fk are anatomic feature vectors for pixels j and k, respectively; the features were derived from pixel intensity values in the MPRAGE image. This combination of kernel functions can then be substituted into the likelihood function, and the coefficients can be estimated using a maximum-likelihood formulation for image reconstruction. A patch size of 3 × 3 × 3 voxels, a neighborhood search window of size 7 × 7 × 7 voxels, and 27 neighboring voxels included per search were used for the implementation of the kernel method. Resolution modeling was not included for this AAR implementation.
Assessment of MR-Assisted Data Optimization on PET Images
To assess the subjects’ overall motion relative to each other, a 21 × 21 × 21 voxel (26.25 mm per edge) cube centered at (50,50,50) voxels in left–anterior–superior coordinates, or (−97.5, −97.5, −33.75) mm measured from the center of the PET image field of view, was transformed according to the estimated 6 transformation parameters at every second. The Euclidean distances of the vertices before and after transformation were averaged to provide a motion magnitude metric. The motion magnitude was summed over time to obtain the aggregate motion magnitude for each subject during the static frame acquisition.
Gray matter (GM) labels were obtained from aggregating the FreeSurfer-derived cortical parcellations. To minimize the influence of biologic variability (especially given our heterogeneous group of patients), the cortical regions with preserved metabolism in this population (the postcentral, precentral, and pericalcarine regions (36,37)) were combined into a composite region as a representative GM label. The white matter (WM) labels were obtained by subtracting the FreeSurfer-derived WM labels by a FreeSurfer-derived GM label that was dilated by 3 voxels.
The changes in signal-to-noise ratio (SNR, defined as the ratio of the mean GM uptake to the SD of the WM uptake) and GM coefficient of variation (CV, defined as the ratio of the SD to the mean) were used to assess the improvement in image quality for static PET images with and without AAR.
In addition, the contrast between affected hypometabolic regions and regions with preserved metabolism in the patients (precuneus and pericalcarine, respectively, for Alzheimer disease [AD]; caudal anterior cingulate and precentral, respectively, for frontotemporal lobar degeneration [FTD]) were assessed. The Cohen’s d effect size (38), defined as
was used as a metric to indicate the interregion contrast. In the above equation, and denote the voxelwise means, and spooled denotes the pooled SD, defined as
with npreserved and naffected denoting the number of voxels in each region and and denoting the voxelwise variance. This metric provides a means to assess the effect size of PET activity differences; that is, a larger d indicates a larger effect size and potentially a higher confidence in discerning the activity differences between regions. Left-tailed paired t tests were used to assess the significance of the difference of the mean effect sizes with successive image processing across subjects at the P = 0.05 level.
RESULTS
Qualitative Assessment of Motion and Image Quality
All human subjects moved during the scans but to varying degrees. The maximum amplitude of motion was 6.1 mm and 10.2°. The displacement curves of 2 representative subjects as well as the motion magnitude and summed aggregate motion for all subjects can be found in Supplemental Figures 1–3 (supplemental materials are available at http://jnm.snmjournals.org).
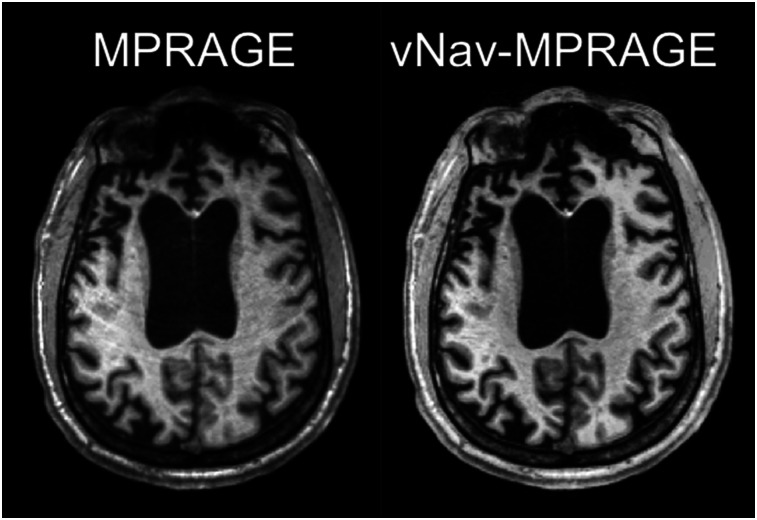
An example of the images obtained with the standard and vNav-MPRAGE sequences is shown in Figure 2. On visual inspection, the morphologic MR images obtained with the vNav-MPRAGE sequence were of excellent quality without motion artifacts, whereas ring artifacts can be observed in the other case. The μ-maps and FreeSurfer segmentations and parcellations generated from the vNav-MPRAGE data were generally accurate.
FIGURE 2.
Transverse sections of representative subject acquired using MPRAGE sequence (left) and vNav-MPRAGE sequence (right).
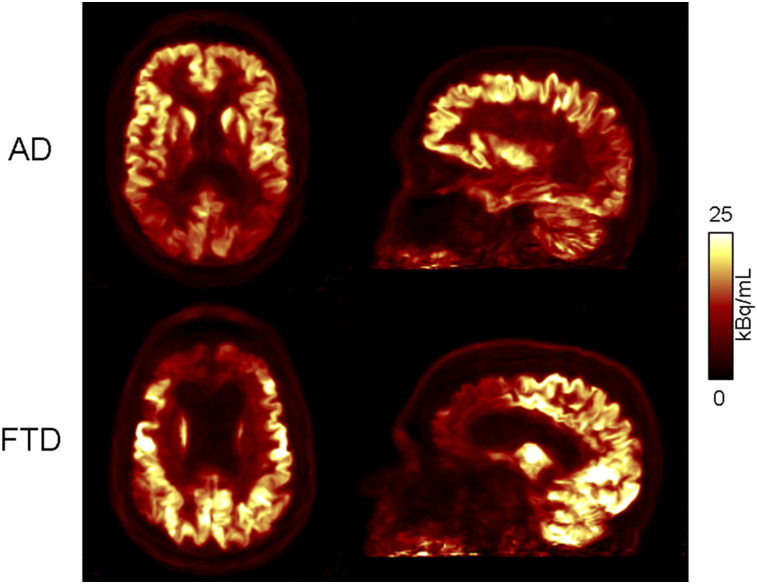
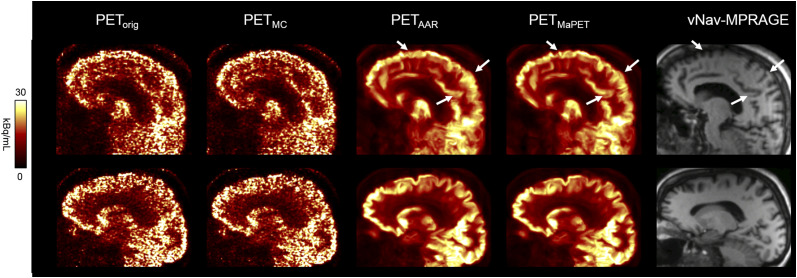
In all PET reconstructions, qualitatively, the cortical regions with hypometabolism matched those expected based on clinical phenotype and prior reports in literature, with hypometabolism observed in the parietal cortical regions for AD subjects, and in the frontal and temporal cortical regions for FTD subjects (Fig. 3). After MC, the images of the subject who moved the most showed an apparent improvement in quality, with reduced motion-induced blurring and better discrimination of the cortical activity. As expected, the changes between the images before and after MC were less apparent in the subjects who moved less (Fig. 4). Visually, the PET image quality substantially improved after AAR.
FIGURE 3.
PETMaPET reconstructions of AD (top) and FTD (bottom) subject, with signature hypometabolism patterns of each dementia type.
FIGURE 4.
PETorig, PETMC, PETAAR, and PETMaPET images of 2 representative subjects (subject who moved the most, top; subject without much motion, bottom). Arrows point to most apparent areas in which PETMaPET image is best at resolving anatomical structures observed in high-resolution MR image.
Assessment of MR-Assisted Data Optimization on PET Images
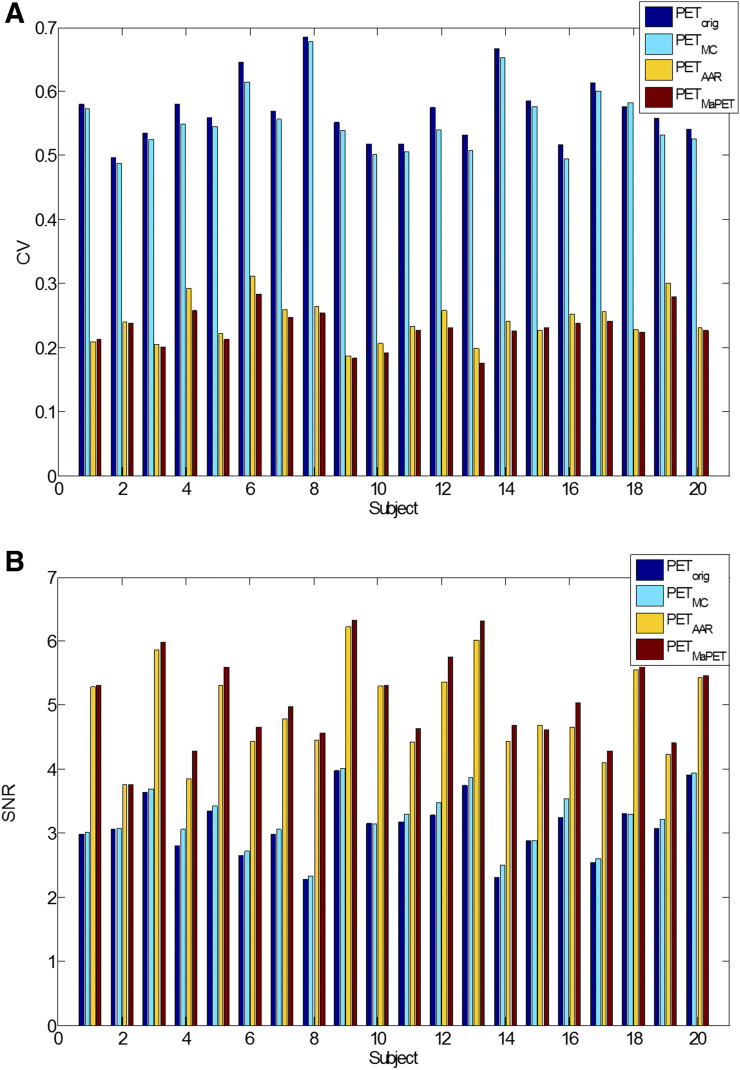
In the composite region, the mean CVs across the 20 subjects decreased from PETorig, PETMC, PETAAR, to PETMaPET: 0.570, 0.554, 0.241, and 0.229 whereas the SNR increased in the same order: 3.12, 3.21, 4.91, and 5.08. The differences were all significant at the P = 0.05 level. The CV decrease and SNR increase with successive image processing generally held for each individual subject in the composite region (Fig. 5); averaged across subjects, the mean CV decrease and mean SNR increase also held for all GM regions and the WM label (Supplemental Fig. 4). AAR generally produced images with lower mean GM (−2.19% ± 0.94% relative change) and higher WM (9.00% ± 2.15% relative change) uptake (likely because resolution modeling was used only for the OSEM reconstruction and the slower convergence of AAR).
FIGURE 5.
CV (A) and SNR (B) values of PETorig, PETMC, PETAAR, and PETMaPET images for all subjects in composite cortical region.
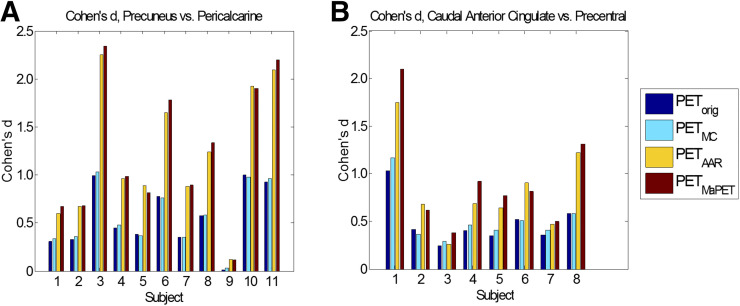
For the differentiation between affected and preserved cortical regions in dementia subgroups, the Cohen’s d metric indicates increasing effect size as MR-assisted PVEC and MC methods are applied in succession. When comparing the 18F-FDG uptake between the precuneus (affected) and pericalcarine (preserved) regions in the AD subjects (nAD = 11) between PETorig, PETMC, PETAAR, and PETMaPET, the mean effect size increased from 0.555, 0.568, 1.21, to 1.25 (Fig. 6A). When comparing the 18F-FDG uptake between the caudal anterior cingulate (affected) and precentral (preserved) regions in the FTD subjects (nFTD = 8) for the 4 reconstruction methods PETorig, PETMC, PETAAR, and PETMaPET, the mean effect size increased from 0.487, 0.524, 0.827, to 0.925 (Fig. 6B). The differences between these means were all significant at the P = 0.05 level except for the FTD PETorig and PETMC comparisons (P = 0.051).
FIGURE 6.
Cohen’s d values between affected region and preserved region in PETorig, PETMC, PETAAR, and PETMaPET images for AD subjects (A) and FTD subjects (B).
DISCUSSION
This work aimed to demonstrate that optimized morphologic MR and metabolic PET data could be acquired efficiently using an integrated PET/MRI scanner even in the case of the patients exhibiting large head movements during the scan. For this purpose, information from the vNav-MPRAGE sequence was used in the MaPET workflow for PET AC, MC, and AAR.
We have not specifically investigated the impact of MR-AC in MaPET because the method used in this work (16) has already been evaluated in a multicenter setting using data acquired in dementia patients (39).
Qualitatively, the vNav-MPRAGE MR images had fewer artifacts than those without the vNavs. Minimal head motion was observed during the 7- to 8-min acquisitions for most of the patients enrolled in this study, which made the assessment of the impact of MC on the reconstructed static PET frames difficult. In general, this task is also complicated by the variability in subject motion. Examining the PETAAR and PETMaPET images for the first subject shown in Figure 4 showed that enforcing the anatomy on the PET reconstruction alone is not sufficient for compensating the motion-induced emission–anatomy mismatch; blurring is still present in the PETAAR image compared with PETMaPET. This demonstrated the need to apply MC before PVEC. We expect MC will have greater impact for longer dynamic PET studies (40).
Although previous AAR studies focused on simulated PET data and a single subject as a proof of principle, to our knowledge this is the first study examining the image quality improvement in a group of mainly dementia patients. Qualitatively, the PET images reconstructed with AAR were less noisy than those reconstructed with OSEM. The Cohen’s d metric used to quantitatively evaluate the improvement in image quality suggests that the images are indeed of higher quality after AAR. As noisy images make the human visual object recognition task more challenging (41), evaluating the AAR images with reduced noise could potentially improve clinicians’ diagnostic confidence.
Our study had several limitations. First, the relatively small number of patients and the group heterogeneity have not allowed us to assess the impact of MaPET on patient group differences. Similarly, the impact of MaPET on the clinical diagnosis at an individual level was not assessed, as that would have required a blinded study design and a larger group of patients with overlapping pathology. Second, the relatively low-amplitude motion observed in the relatively short time interval analyzed prevented us from thoroughly studying the impact of MC at subject and group levels. Third, whereas AAR achieves PET noise reduction with emission–anatomy mismatch (as we previously showed by simulating an artificial hot lesion that was reconstructed with kernels based on a lesion-less MR anatomic image (30)), further work is needed to assess the effect of residual motion-induced emission–anatomy mismatches. Finally, the effects of other PVEC methods (such as postprocessing and resolution modeling) in combination with AAR on PET image quality should also be investigated.
CONCLUSION
In this work, we proposed an efficient approach for MR-assisted PET data optimization (MaPET) to be used in an integrated PET/MRI scanner. Specifically, the spatiotemporally correlated data from a single MR sequence can be used for PET attenuation, motion, and PVECs. From preliminary analyses of the data acquired in dementia patients, we demonstrated that high-quality metabolic and morphologic data can be efficiently obtained even in more heavily moving patients. Optimized MR-based PET data quantification may enable a more accurate assessment of pathologic changes in dementia and other brain disorders.
DISCLOSURE
This work was funded by NIH grants 5R01EB014894 and R21AG056958 and by the U.S. Department of Defense through the National Defense Science & Engineering Graduate Fellowship. Alexander Drzezga has received funding, research support as well as speaker and/or consulting fees from Piramal, GE Healthcare, Siemens, Eli Lilly, and AVID. No other potential conflict of interest relevant to this article was reported.
Acknowledgments
We thank Drs. Paul Wighton, F. Isik Karahanoglu, and Stefano Pedemonte of the Martinos Center for their help with the vNav-MPRAGE sequence.
REFERENCES
- 1.Catana C, Drzezga A, Heiss WD, Rosen BR. PET/MRI for neurologic applications. J Nucl Med. 2012;53:1916–1925. [DOI] [PMC free article] [PubMed] [Google Scholar]
- 2.Herzog H, Pietrzyk U, Shah NJ, Ziemons K. The current state, challenges and perspectives of MR-PET. Neuroimage. 2010;49:2072–2082. [DOI] [PubMed] [Google Scholar]
- 3.Catana C, Guimaraes AR, Rosen BR. PET and MR imaging: the odd couple or a match made in heaven? J Nucl Med. 2013;54:815–824. [DOI] [PMC free article] [PubMed] [Google Scholar]
- 4.Drzezga A, Barthel H, Minoshima S, Sabri O. Potential clinical applications of PET/MR imaging in neurodegenerative diseases. J Nucl Med. 2014;55(suppl 2):47S–55S. [DOI] [PubMed] [Google Scholar]
- 5.Herzog H, Tellmann L, Fulton R, et al. Motion artifact reduction on parametric PET images of neuroreceptor binding. J Nucl Med. 2005;46:1059–1065. [PubMed] [Google Scholar]
- 6.Erlandsson K, Buvat I, Pretorius PH, Thomas BA, Hutton BF. A review of partial volume correction techniques for emission tomography and their applications in neurology, cardiology and oncology. Phys Med Biol. 2012;57:R119–R159. [DOI] [PubMed] [Google Scholar]
- 7.Ikari Y, Nishio T, Makishi Y, et al. Head motion evaluation and correction for PET scans with 18F-FDG in the Japanese Alzheimer’s disease neuroimaging initiative (J-ADNI) multi-center study. Ann Nucl Med. 2012;26:535–544. [DOI] [PubMed] [Google Scholar]
- 8.Dickerson BC, Bakkour A, Salat DH, et al. The cortical signature of Alzheimer’s disease: regionally specific cortical thinning relates to symptom severity in very mild to mild AD dementia and is detectable in asymptomatic amyloid-positive individuals. Cereb Cortex. 2009;19:497–510. [DOI] [PMC free article] [PubMed] [Google Scholar]
- 9.Izquierdo-Garcia D, Catana CMR. Imaging-guided attenuation correction of PET data in PET/MR imaging. PET Clin. 2016;11:129–149. [DOI] [PMC free article] [PubMed] [Google Scholar]
- 10.Hofmann M, Steinke F, Scheel V, et al. MRI-based attenuation correction for PET/MRI: a novel approach combining pattern recognition and atlas registration. J Nucl Med. 2008;49:1875–1883. [DOI] [PubMed] [Google Scholar]
- 11.Montandon ML, Zaidi H. Atlas-guided non-uniform attenuation correction in cerebral 3D PET imaging. Neuroimage. 2005;25:278–286. [DOI] [PubMed] [Google Scholar]
- 12.Berker Y, Franke J, Salomon A, et al. MRI-based attenuation correction for hybrid PET/MRI systems: a 4-class tissue segmentation technique using a combined ultrashort-echo-time/Dixon MRI sequence. J Nucl Med. 2012;53:796–804. [DOI] [PubMed] [Google Scholar]
- 13.Catana C, van der Kouwe A, Benner T, et al. Toward implementing an MRI-based PET attenuation-correction method for neurologic studies on the MR-PET brain prototype. J Nucl Med. 2010;51:1431–1438. [DOI] [PMC free article] [PubMed] [Google Scholar]
- 14.Keereman V, Fierens Y, Broux T, De Deene Y, Lonneux M, Vandenberghe S. MRI-based attenuation correction for PET/MRI using ultrashort echo time sequences. J Nucl Med. 2010;51:812–818. [DOI] [PubMed] [Google Scholar]
- 15.Chen KT, Izquierdo-Garcia D, Poynton CB, Chonde DB, Catana C. On the accuracy and reproducibility of a novel probabilistic atlas-based generation for calculation of head attenuation maps on integrated PET/MR scanners. Eur J Nucl Med Mol Imaging. 2017;44:398–407. [DOI] [PMC free article] [PubMed] [Google Scholar]
- 16.Izquierdo-Garcia D, Hansen AE, Forster S, et al. An SPM8-based approach for attenuation correction combining segmentation and nonrigid template formation: application to simultaneous PET/MR brain imaging. J Nucl Med. 2014;55:1825–1830. [DOI] [PMC free article] [PubMed] [Google Scholar]
- 17.Poynton CB, Chen KT, Chonde DB, et al. Probabilistic atlas-based segmentation of combined T1-weighted and DUTE MRI for calculation of head attenuation maps in integrated PET/MRI scanners. Am J Nucl Med Mol Imaging. 2014;4:160–171. [PMC free article] [PubMed] [Google Scholar]
- 18.Pilipuf MN, Goble JC, Kassell NF. A noninvasive thermoplastic head immobilization system. Technical note. J Neurosurg. 1995;82:1082–1085. [DOI] [PubMed] [Google Scholar]
- 19.Olesen OV, Sullivan JM, Mulnix T, et al. List-mode PET motion correction using markerless head tracking: proof-of-concept with scans of human subject. IEEE Trans Med Imaging. 2013;32:200–209. [DOI] [PubMed] [Google Scholar]
- 20.Montgomery AJ, Thielemans K, Mehta MA, Turkheimer F, Mustafovic S, Grasby PM. Correction of head movement on PET studies: comparison of methods. J Nucl Med. 2006;47:1936–1944. [PubMed] [Google Scholar]
- 21.Picard Y, Thompson CJ. Motion correction of PET images using multiple acquisition frames. IEEE Trans Med Imaging. 1997;16:137–144. [DOI] [PubMed] [Google Scholar]
- 22.Jin X, Mulnix T, Gallezot JD, Carson RE. Evaluation of motion correction methods in human brain PET imaging–a simulation study based on human motion data. Med Phys. 2013;40:102503. [DOI] [PMC free article] [PubMed] [Google Scholar]
- 23.Qi J, Huesman RH. Correction of motion in PET using event-based rebinning method: pitfall and solution [abstract]. J Nucl Med. 2002;43:146P. [Google Scholar]
- 24.Catana C, Benner T, van der Kouwe A, et al. MRI-assisted PET motion correction for neurologic studies in an integrated MR-PET scanner. J Nucl Med. 2011;52:154–161. [DOI] [PMC free article] [PubMed] [Google Scholar]
- 25.Rousset OG, Ma Y, Evans AC. Correction for partial volume effects in PET: principle and validation. J Nucl Med. 1998;39:904–911. [PubMed] [Google Scholar]
- 26.Müller-Gärtner HW, Links JM, Prince JL, et al. Measurement of radiotracer concentration in brain gray matter using positron emission tomography: MRI-based correction for partial volume effects. J Cereb Blood Flow Metab. 1992;12:571–583. [DOI] [PubMed] [Google Scholar]
- 27.Rahmim A, Qi J, Sossi V. Resolution modeling in PET imaging: theory, practice, benefits, and pitfalls. Med Phys. 2013;40:064301. [DOI] [PMC free article] [PubMed] [Google Scholar]
- 28.Bowsher JE, Yuan H, Hedlund LW, et al. Utilizing MRI information to estimate F18-FDG distributions in rat flank tumors. IEEE Nucl Sci Symp Conf Rec. 2004:2488–2492. [Google Scholar]
- 29.Wang G, Qi J. PET image reconstruction using kernel method. IEEE Trans Med Imaging. 2015;34:61–71. [DOI] [PMC free article] [PubMed] [Google Scholar]
- 30.Hutchcroft W, Wang G, Chen KT, Catana C, Qi J. Anatomically-aided PET reconstruction using the kernel method. Phys Med Biol. 2016;61:6668–6683. [DOI] [PMC free article] [PubMed] [Google Scholar]
- 31.Tisdall MD, Hess AT, Reuter M, Meintjes EM, Fischl B, van der Kouwe AJ. Volumetric navigators for prospective motion correction and selective reacquisition in neuroanatomical MRI. Magn Reson Med. 2012;68:389–399. [DOI] [PMC free article] [PubMed] [Google Scholar]
- 32.Hong IK, Chung ST, Kim HK, Kim YB, Son YD, Cho ZH. Ultra fast symmetry and SIMD-based projection-backprojection (SSP) algorithm for 3-D PET image reconstruction. IEEE Trans Med Imaging. 2007;26:789–803. [DOI] [PubMed] [Google Scholar]
- 33.Byars LG, Sibomana M, Burbar Z, et al. Variance reduction on randoms from delayed coincidence histograms for the HRRT. 2005. IEEE Nucl Sci Symp Conf Rec. 2005;1-5:2622–2626. [Google Scholar]
- 34.Watson CC. New, faster, image-based scatter correction for 3D PET. IEEE Trans Nucl Sci. 2000;47:1587–1594. [Google Scholar]
- 35.Bowen SL, Byars LG, Michel CJ, Chonde DB, Catana C. Influence of the partial volume correction method on (18)F-fluorodeoxyglucose brain kinetic modelling from dynamic PET images reconstructed with resolution model based OSEM. Phys Med Biol. 2013;58:7081–7106. [DOI] [PMC free article] [PubMed] [Google Scholar]
- 36.Brown RK, Bohnen NI, Wong KK, Minoshima S, Frey KA. Brain PET in suspected dementia: patterns of altered FDG metabolism. Radiographics. 2014;34:684–701. [DOI] [PubMed] [Google Scholar]
- 37.Ishii K. PET approaches for diagnosis of dementia. AJNR. 2014;35:2030–2038. [DOI] [PMC free article] [PubMed] [Google Scholar]
- 38.Cohen J. Statistical Power Analysis for the Behavioral Sciences. 2nd ed. Hillsdale, NJ: L. Erlbaum Associates; 1988:20–27. [Google Scholar]
- 39.Ladefoged CN, Law I, Anazodo U, et al. A multi-centre evaluation of eleven clinically feasible brain PET/MRI attenuation correction techniques using a large cohort of patients. Neuroimage. 2017;147:346–359. [DOI] [PMC free article] [PubMed] [Google Scholar]
- 40.Gong K, Cheng-Liao J, Wang G, Chen KT, Catana C, Qi J. Direct Patlak reconstruction from dynamic PET data using the kernel method with MRI information based on structural similarity. IEEE Trans Med Imaging. 2018;37:955–965. [DOI] [PMC free article] [PubMed] [Google Scholar]
- 41.Bankó ÉM, Kortvelyes J, Weiss B, Vidnyanszky Z. How the visual cortex handles stimulus noise: insights from amblyopia. PLoS One. 2013;8:e66583. [DOI] [PMC free article] [PubMed] [Google Scholar]


