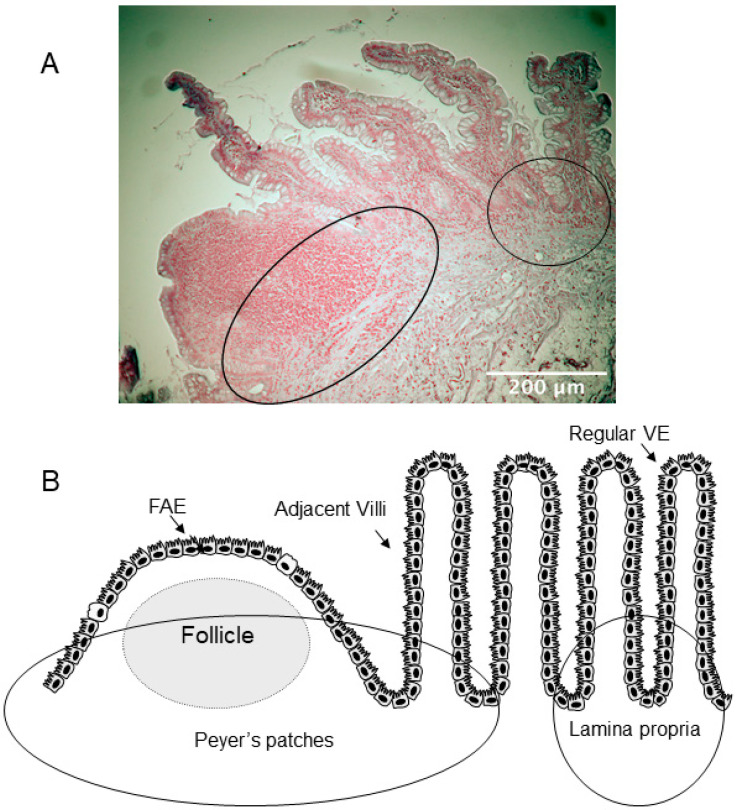
Figure 1.
Descriptive overview of the two areas analyzed for enteric glial cells (EGC) distribution. (A) Representative hematoxylin-stained image used for analysis. Circles represent the two areas analyzed; Peyer’s patches, covered by the follicle-associated epithelium (FAE), and lamina propria covered by regular villus epithelium (VE). Scale bar 200 μm. (B) Schematic representation of the two areas. The left circle represents the area defined as Peyer’s patches, which includes the follicle, the interfollicular region, and the adjacent villi. The circle to the right defines the area representing lamina propria. In the image, the circle identifying lamina propria is situated close to the Peyer’s patches, though, only areas of lamina propria that were situated at least six villi away from the Peyer’s patches were analyzed.

