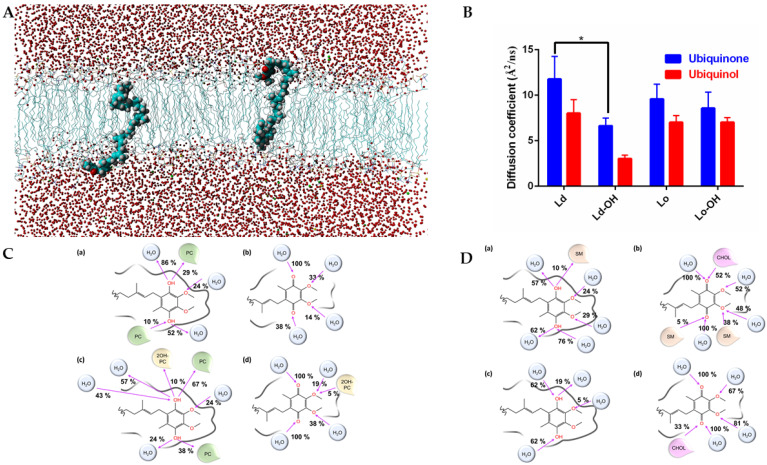
Figure 3.
(A) Snapshot of the ubiquinol embedded in a POPC/2OH-POPC fully solvated membrane. (B) Diffusion coefficients of ubiquinone and ubiquinol in model Lo and Ld membranes. The (-OH) suffix indicates a partial hydroxylation of the lipid chain. Two-way ANOVA (n = 3) show significant (p < 0.0001) differences between the row (Ld, Ld-OH, Lo, Lo-OH) and column (ubiquinol v ubiquinone) factors. *, Student’s t-test shows significant difference (p < 0.027) between hydroxylated and non-hysdroxylated lipids in Ld membrane. (C) Graphical representation of the hydrogen bonds occurring in the last 10 ns of simulation between the ubiquinol (a,c) or ubiquinone (b,d) and the water/membrane system. In (a,b), we simulated the ubiquinol and ubiquinone embedded in a pure POPC membrane (the lipids were indicated in green as PC). In (c,d), we simulated the ubiquinol and ubiquinone embedded in a membrane model POPC/2OH-POPC (50%–50%). The hydroxylated POPC was indicated as 2OH-PC and colored in yellow. The pink arrow indicates whether the oxygen atom is an acceptor or donor of hydrogen bonds. Interactions with a frequency lower than 5% were not shown. (D) Same as in (C), but in (a,b) we simulated the ubiquinol and ubiquinone embedded in a membrane model SM/CHOL (60%–40%). The SM lipids were indicated as SM and colored in light orange. The cholesterol was indicated as CHOL and colored in pink. In (c,d) we simulated the ubiquinol and ubiquinone embedded in a membrane model SM/2OH-SM/CHOL (30%–30%–40%). The pink arrow indicates whether the oxygen atom is an acceptor or donor of hydrogen bonds. Interactions with a frequency lower than 5% were not shown. The hydroxylated form of SM shows no relevant interactions with CoQ.

