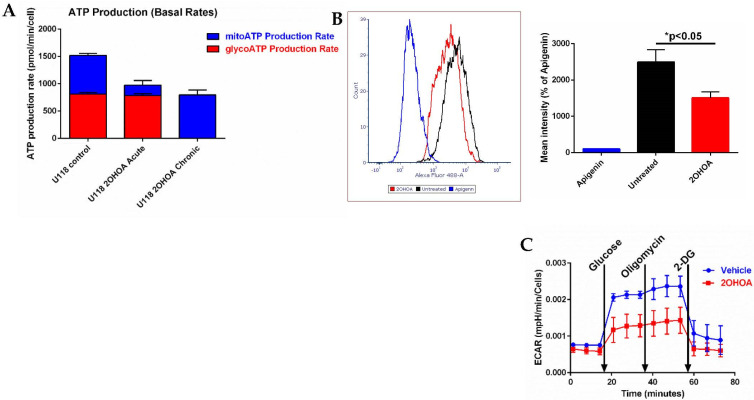
Figure 7.
(A) Glycolytic (red) and mitochondrial (blue) ATP production determined by Agilent’s Seahorse machine and real-time ATP rate assay kit. U118MG cells were treated, or not (control), with 200 μM 2OHOA for 48 h (chronic), or for 20 min on assay (acute). Readings were normalized to cell numbers as determined by Crystal Violet staining. Shown are mean and SEM values based on n = 3 repeats. Chronic treatment with 2OHOA led to complete depletion of glycolytic ATP production, while acute treatment significantly reduced respiratory ATP production (p < 0.002) leaving glycolytic ATP production intact (p < 0.92). These differences were inferred statistically by one-way ANOVA with Sidak’s post hoc correction. (B) Glycolysis estimated by NBDG (2-Deoxy-2-[(7-nitro-2,1,3-benzoxadiazol-4-yl)amino]-d-glucose) uptake into U118MG cells, as quantified by flow cytometry. U118MG cells were treated with 200 μM 2OHOA for 48 h and then assayed for NBDG uptake as per the manufacturer instructions. Apigenin is a Glut 1 inhibitor and serves as a control for inhibition of NBDG uptake. Right panel shows quantification based on n = 3 experiments. (C) Glycolysis estimated by the Seahorse XF Glyco Stress kit based on n = 6 replicates. U118MG cells (~40,000 per well as determined by crystal violet staining) were treated, or not (vehicle), with 200 μM 2OHOA for 48 h and their glycolysis was determined by extracellular acidification rate (ECAR) using the Seahorse XF Glyco Stress kit. Basal and maximal glycolysis were respectively estimated by supplementations of 10 mM glucose and 1 μM oligomycin, while non-glycolytic ECAR was estimated by blocking glycolysis with 2-deoxyglucose (2-DG).

