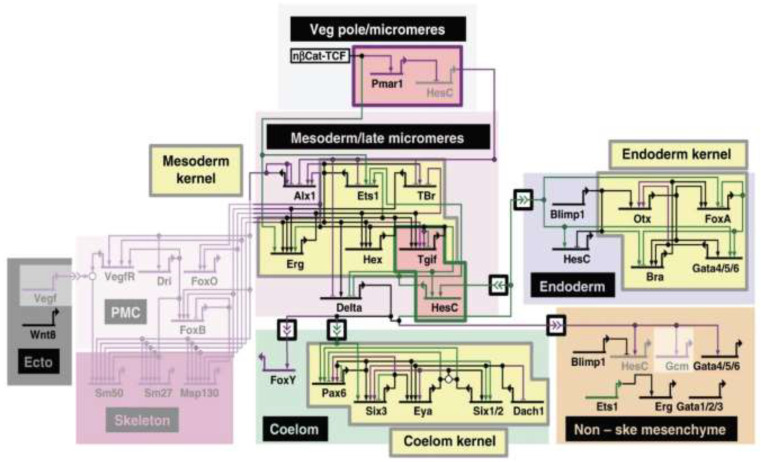
Figure 1.
Gene regulatory network showing conserved kernels and both shared and species-specific subcircuits. A schematic of the GRN for endomesoderm specification for both sea urchin and sea star is depicted (see ref. [7] for details). Genes are shown in the different regions (colored boxes) where they are expressed during development. Activating inputs are represented by arrows and repressive inputs by bars. Intercellular signaling is shown using double arrowheads. Purple genes and linkages are unique to sea urchin, while green is specific to sea stars, and black are those in common. The “kernels” (yellow) and distinct subcircuits (pink) are highlighted. The greyed-out backgrounds indicate network circuits absent in sea stars. Image credit: © Cary et al. [7], used with permission under CC-BY 4.0 license.

