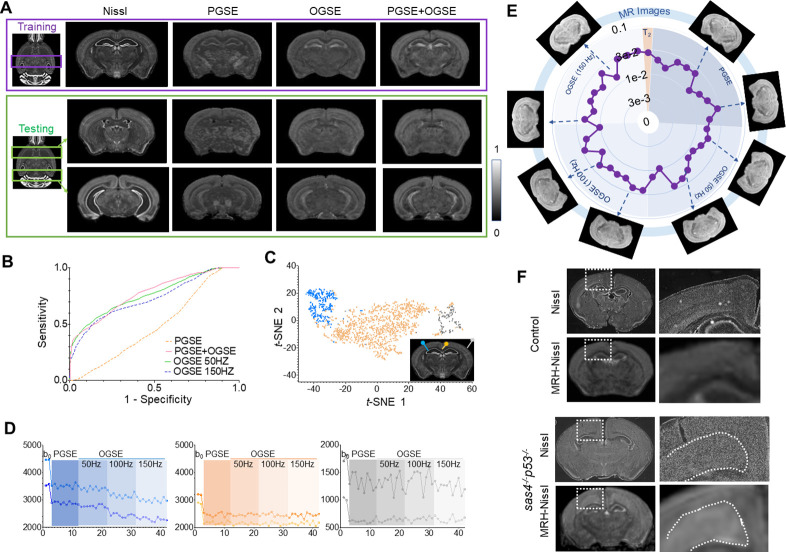
Figure 5. Generating maps that mimic Nissl stained histology from multi-contrast magnetic resonance imaging (MRI) data.
(A) Comparisons of reference Nissl histology and MRH-Nissl results with pulsed gradient spin echo (PGSE), oscillating gradient spin echo (OGSE), combined PGSE and OGSE diffusion MRI data in both training and testing datasets. The entire datasets consist of PGSE and OGSE data acquired with oscillating frequencies of 50, 100, and 150 Hz, a total of 42 images. (B) Receiver operating characteristic (ROC) curves of MRH-Nissl show enhanced specificity for structures with high cellularity (strong Nissl staining) when both PGSE and OGSE data were included in the inputs than PGSE only. (C) The distribution of randomly selected 3 × 3 MRI patches in the network’s 2D feature spaces of MRH-Nissl defined using t-distributed stochastic neighbor embedding (t-SNE) analyses. Green and orange dots correspond to regions with high and low cellularity, respectively, and gray dots represent patches on the brain surface. (D) Representative signal profiles from different groups in C. (E) Relative contributions of PGSE and three OGSE diffusion MRI datasets (F) Representative MRH-Nissl results from sas4-/-p53-/- and control mouse brains compared with Nissl-stained sections. The location of the cortical heterotopia, consists of undifferentiated neurons, is indicated by the dashed lines in the mutant mouse brain image.

