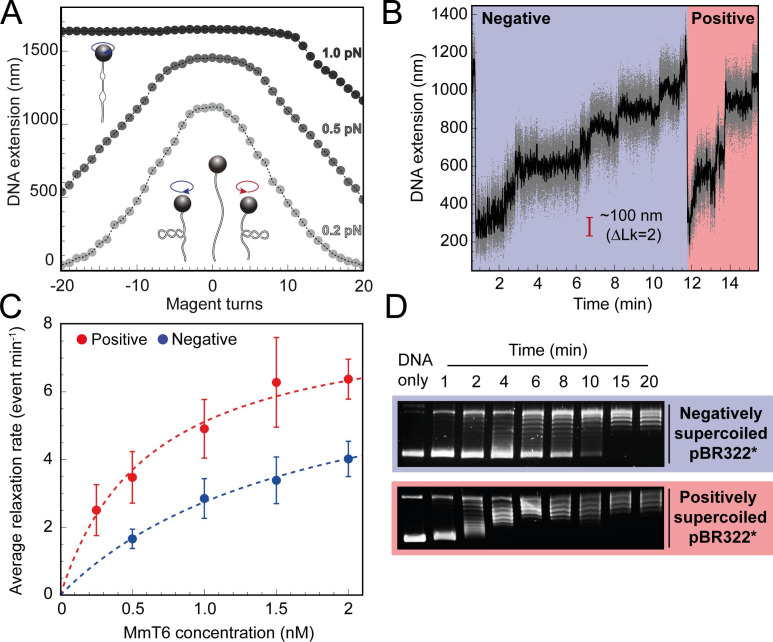
Figure 1. Topo VI relaxation rate depends on the chirality of DNA supercoiling.
(A) Magnetic tweezers calibration curves for a 5 kb DNA duplex supercoiled under low (0.2 pN), medium (0.5 pN) and high (1.0 pN) force. DNA extension is plotted as a function of magnet turns. Negative magnet turn values represent the clockwise rotation of the magnets which produces negative, or right-handed DNA crossings. Positive, or left-handed crossings are produced by rotating the magnets anticlockwise. At high force, clockwise rotation promotes DNA melting, rather than negative supercoiling, hence the DNA extension is insensitive to magnet rotation. (B) Example trace of topo VI-dependent supercoil relaxation. Data collected at a force of 0.4 pN, at 21 °C, using 0.5 nM topo VI and 1 mM ATP. Each strand-passage event is evident as an abrupt DNA extension increase of ~100 nm, corresponding to a ΔLk of 2. Relaxation of negative supercoils is highlighted in blue, and positive in red. Positive supercoils are relaxed faster, resulting in short events ( < 1 min) being compressed when plotted on the same axis as negative supercoil relaxation. Data collected at 200 Hz (grey dots) and plotted with a 1 s Savitzky–Golay smoothing filter (black line). (C) Average relaxation rate of topo VI (± SEM) on positive (N tethers across all data points = 40) and negative (N tethers across all data points = 42) supercoils as a function of topo VI concentration (0.25–2 nM), collected at a force of 0.4 pN, at 21 °C. Data were fitted to a Michaelis-Menten-like function (). Raw data were analysed in IgorPro 7 (WaveMetrics) using a T-test based method, first described in Seol et al., 2016. (D) Agarose gel-based supercoil-relaxation time course. Negatively or positively supercoiled pBR322* was incubated at 21 °C, with 20 nM topo VI and the reaction was stopped at consecutive time points using 50 mM EDTA. Samples were run on a 1% (w/v) native agarose gel for 15 hr at ~2 Vcm–1, stained with 0.5 μg/mL ethidium bromide and imaged under UV illumination.

