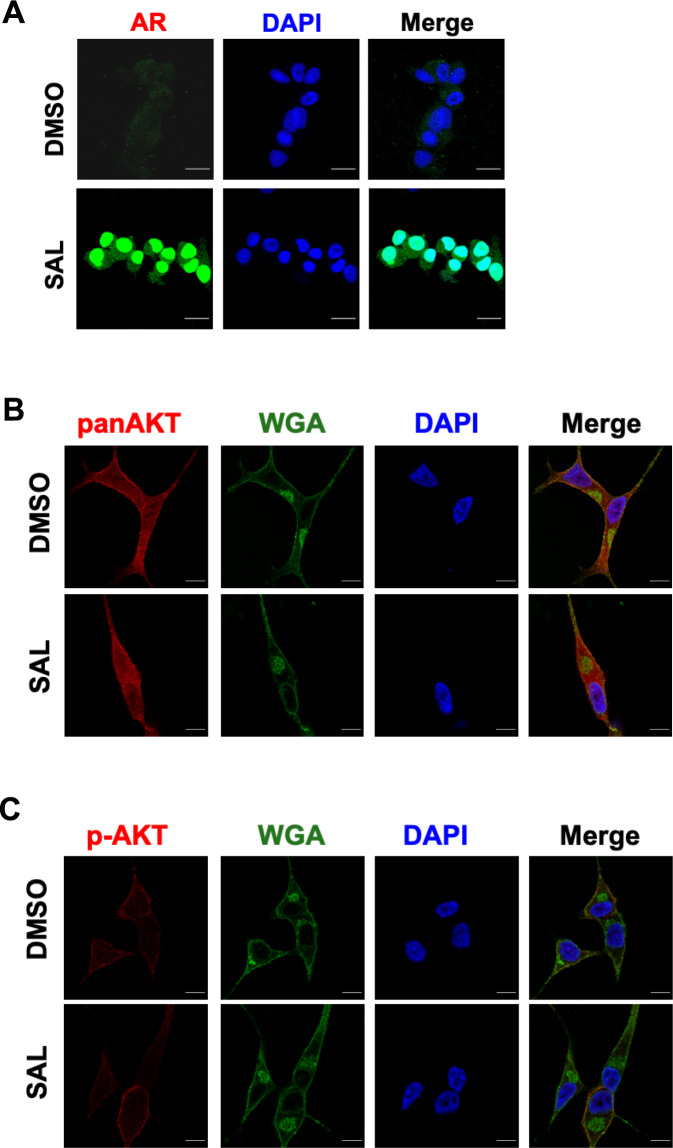
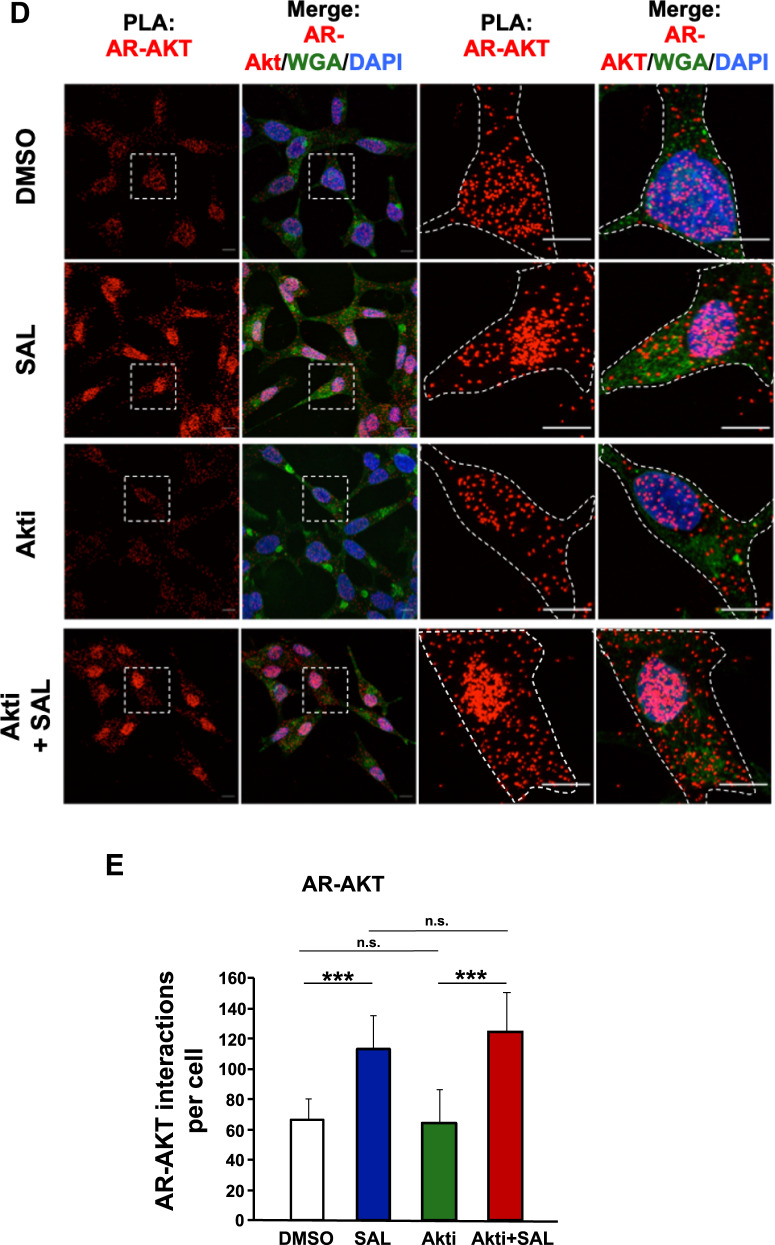
Fig. 4. SAL promotes interaction of AR with AKT.
A Immunofluorescence detection to visualize intracellular localization of AR (green) in LNCaP cells by high-resolution confocal scanning fluorescence microscopy. Nuclei are stained by DAPI (blue). Scale bar indicates 2 µm. B, C Intracellular detection of AKT (B) and p-AKT (C) by superresolution confocal scanning fluorescence microscopy (red). Wheat germ agglutinin (WGA) was used as membrane marker (green). Scale bar indicates 2 µm (n = 3). D Quantitative proximity-ligation assays (PLA) were performed to analyze native intracellular interaction of endogenous AR with endogenous AKT in the presence of SAL and AKTi. Cells were treated for 72 h. Shown are representative pictures. Scale bar indicates 10 µm. E The number of PLA signals per cell was counted by Fiji software. PLA signals were calculated from 80 cells derived from three independent experiments. Bar graphs are shown as mean ± SEM, ***p ≤ 0.001, n.s. not significant.


