

Abstract
Aberrant affective neural processing and negative emotional bias are trait‐marks of major depression disorders (MDDs). However, most research on biased emotional perception in depression has only focused on unimodal experimental stimuli, the neural basis of potentially biased emotional processing of multimodal inputs remains unclear. Here, we addressed this issue by implementing an audiovisual emotional task during functional MRI scanning sessions with 37 patients with MDD and 37 gender‐, age‐ and education‐matched healthy controls. Participants were asked to distinguish laughing and crying sounds while being exposed to faces with different emotional valences as background. We combined general linear model and psychophysiological interaction analyses to identify abnormal local functional activity and integrative processes during audiovisual emotional processing in MDD patients. At the local neural level, MDD patients showed increased bias activity in the ventromedial prefrontal cortex (vmPFC) while listening to negative auditory stimuli and concurrently processing visual facial expressions, along with decreased dorsolateral prefrontal cortex (dlPFC) activity in both the positive and negative visual facial conditions. At the network level, MDD exhibited significantly decreased connectivity in areas involved in automatic emotional processes and voluntary control systems during perception of negative stimuli, including the vmPFC, dlPFC, insula, as well as the subcortical regions of posterior cingulate cortex and striatum. These findings support a multimodal emotion dysregulation hypothesis for MDD by demonstrating that negative bias effects may be facilitated by the excessive ventral bottom‐up negative emotional influences along with incapability in dorsal prefrontal top‐down control system.
Keywords: audiovisual emotional processing, major depression disorder, negative bias effects
We had found the neural basis of negative‐biased emotional perception processing of audiovisual inputs in depression. Our findings provide novel evidence for the emotion dysregulation hypothesis by showing that, during exposure to complex real‐life‐like multimodal stimuli, negative emotional bias effects in MDD patients may be facilitated by the strong bottom‐up emotional influences along with incapability in top‐down control system processes.

1. INTRODUCTION
Major depression disorder (MDD) is one of the common psychiatric disorders and is characterized by affective and cognitive impairments (Gotlib & Joormann, 2010; Ochsner, Silvers, & Buhle, 2012). People with MDD tend to predominantly experience negative events or experiences, feeling which are additionally confirmed by biased interpretations of themselves or their environments (Kube, Schwarting, Rozenkrantz, Glombiewski, & Rief, 2020; Panchal, Kaltenboeck, & Harmer, 2019). Cognitive models of depression posit that negatively biased self‐referent processing and selective attentional focus are thought to lead to the development of symptoms of depression (Beck, 1967; De Raedt & Koster, 2010). This systemic, negative cognitive bias cuts across all levels of information processing, including emotional reactivity, attention and memory (Beck & Bredemeier, 2016). Moreover, the biological and cognitive vulnerability of patients leads to sustained negative affect in depression, which further reinforces the negative loop in turn (De Raedt & Koster, 2010; Rief & Joormann, 2019). Research groups have recently been focusing on the link between distorted cognitive prediction processes and cognitive dysfunction in MDDs (Kube et al., 2020). They suggest that patients with depression spend too much time focusing on negative prior beliefs, which also continuously shapes perception negatively. Although theoretical research on negative bias tendency of depressed individuals has been a focus of study for several decades, the biological mechanism still needs to be explored.
Neuroscientific evidence has consistently suggested that aberrant bottom‐up processing of emotional stimuli coupled with diminished top‐down executive control over limbic/affective neural circuitry contribute to abnormal negative emotional processes in depression (Disner, Beevers, Haigh, & Beck, 2011; Kube et al., 2020; Mennen, Norman, & Turk‐Browne, 2019; Stange et al., 2017; Woody & Gibb, 2015). In the bottom‐up pathway, emotional dysfunction that originates subcortically in limbic regions impacts resource integration of cognition and affective information in the prefrontal cortex (Fales et al., 2008; Banich et al., 2009; Puryear et al., 2020). Increased activity in subcortical regions (i.e., the amygdala and putamen) has been found during the processing of increasingly sad faces, suggesting an overactivity of subcortical regions during negative events in MDD patients (Surguladze et al., 2005). The increased amygdala reactivity subsequently creates a strong signal that biases emotional stimuli processing in higher cortical areas such as ventromedial prefrontal cortex (vmPFC) and dorsolateral prefrontal cortex (dlPFC) (Fales et al., 2008; Yang et al., 2010). In turn, as a key region associated with cognitive control, the dlPFC has decreased control over amygdala activity, resulting in difficulty disengaging from negative stimuli and prolonged periods of negative affect (Kertz, Petersen, & Stevens, 2019; Sanchez, Vazquez, Marker, LeMoult, & Joormann, 2013). Additionally, abnormal functional integrity and inefficient transfer of emotional information through the projection from hippocampus to mPFC have been associated with bias learning and negatively coded memory formation in patients with depression (Goto & Grace, 2008; Kertz et al., 2019; Philippi et al., 2018; Puryear et al., 2020). Although the neurobiological mechanism underlying negative bias effects in patients with depression has been widely explored, previous MDD studies have mainly focused on unimodal emotion processing. Emotional information and perception in natural environments are rarely based on only one sensory modality (De Gelder & Bertelson, 2003). In daily life, the emotional stimulation of several sensory modalities often occurs simultaneously, and the cross‐modal emotional influences between different sensory channels are thought to be strong (Van Rheenen & Rossell, 2014). This multimodal emotional integration is responsible for enriching perception, compensating for conflicts in cross‐modal sensation and facilitating perceptual decoding in times of unimodal ambiguity (De Gelder & Bertelson, 2003; Dolan, Morris, & De Gelder, 2001; Pourtois, Gelder, Bol, & Crommelinck, 2005). Thus, whether previous findings from unimodal emotional processing reflect the complex real‐life‐like emotional deficits in depression needs to be further confirmed. It is important to investigate potential deficits, particularly negative bias, during multimodal emotional processing in patients with depression.
Extraction of emotional information is mostly based on auditory and visual channel in real life (Müller et al., 2011). Previously, audiovisual emotional processing was mainly studied in schizophrenia and autistic disorder (Müller, Kellermann, Seligman, Turetsky, & Eickhoff, 2014). But, more and more researchers have shown increasing interest in the deficits in audiovisual emotion processing in major depression (Beatteay & Wilbiks, 2020; Rong et al., 2021; Van Rheenen & Rossell, 2014). At the neural level, initial multimodal emotional research in depression has demonstrated that patients showed inhibitory impairments in the right posterior superior temporal gyrus and middle cingulate cortex impairments in the inhibition of auditory stimuli presented with emotionally congruent facial expressions (Müller, Cieslik, Kellermann, & Eickhoff, 2014). Subsequent neuroimaging research revealed that depressed patients showed specific impairments the audiovisual integration of positive auditory stimuli (Doose‐Grünefeld, Eickhoff, & Müller, 2015). Further behavioral evidence suggested that there is a general emotion processing impairment in decoding dynamic emotional audio/video stimuli (Scibelli, Troncone, Likforman‐Sulem, Vinciarelli, & Esposito, 2016), and that MDD symptoms have negative effects on audiovisual integration capacity (Beatteay & Wilbiks, 2020). Recently, our group used machine learning classification models to show that MDD patients were engaged in complex functional network dysfunctions in the prefrontal cortex and limbic‐subcortical areas, as well as in multisensory regions that are involved in processing audiovisual emotional stimuli (Rong et al., 2021). Despite this evidence for impairments during audiovisual emotion integration in depression, the neural basis underlying cross‐modal emotion processing remains unknown, as does the question of whether a negative bias effect would be present when processing audiovisual emotional stimuli in patients with MDD.
In this study, we aimed to examine the abnormal neural activation and network connectivity patterns related to negative bias effects in patients with MDD by employing an audiovisual emotional experiment paradigm with functional MRI (fMRI). We hypothesized that patients with MDD would have abnormal negative bias activation when confronting audiovisual emotional stimuli, and that the critical regions of this abnormal mechanism would likely be located in emotional regulation networks. In particular, we expected to see a wide imbalance between the bottom‐up and top‐down functional circuits leading by these core regions. We tested our hypotheses by analyzing local brain activation from MDD being exposed to audiovisual stimuli that were either emotionally congruent or incongruent. We used psychophysiological interactions (PPIs) analyses to further examine the dysfunctional brain networks in MDD patients. To our knowledge, this is the first study investigating the negative bias effects in audiovisual emotional processing in MDD. These results may provide new insights into the mechanism underlying these effects in MDD.
2. METHODS
2.1. Participants
A total of 37 patients with major depression and 37 healthy volunteers (healthy control, HC) that were matched for gender, age, and education were included in this study. All the participants were right‐handed Chinese native speakers who had normal or corrected‐to‐normal vision and had no reported history of auditory disorders. All participants met magnetic resonance scanning criteria. The study procedures were approved by the research ethics committee of the School of Life Science and Technology at the University of Electronic Science and Technology of China, and all participants provided written informed assent. All participants were paid for taking part in the experiment.
MDD participants were recruited from a mental health center in Chengdu, Sichuan, China. Clinical diagnoses were confirmed via a consensus of two experienced psychiatrists using the Structured Clinical Interview for DSM‐IV (patient edition) (Yuan et al., 2018). MDD symptom severity was assessed using the 14‐item Hamilton Depression Scale (HAMD). Exclusion criteria included schizophrenia, mental retardation, personality disorders, history of head trauma, substance abuse, and serious medical or neurological illnesses. The HC group was recruited from the community through advertisements. In particular, our patients with MDD may be accompanied by some anxiety symptoms, but they all did not meet the diagnostic criteria for anxiety disorder. The members of this group had no history of serious medical and neuropsychiatric illness or a family history of major psychiatric or neurological illness among their first‐degree relatives. The SCID non‐patient version (SCID–NP) was employed to ensure the absence of psychiatric illnesses in the HC. The HC did not finish the HDMA scale test because it was only administered by two well‐trained psychiatrists in the hospital. Demographic and clinical characteristics are presented in Table 1.
TABLE 1.
Demographic characteristics
| Variables | MDD (n = 37) | HC (n = 37) | p value |
|---|---|---|---|
| Gender (male/female) | 12/25 | 18/19 | 0.1554 a |
| Age (years) | 31.21 ± 12.17 | 36.57 ± 16.28 | 0.1923 b |
| Education (years) | 14.30 ± 3.620 | 12.97 ± 2.736 | 0.0755 b |
| Handedness (left/right) | 0/37 | 0/37 | 1 a |
| Mean FD | 0.087 ± 0.050 | 0.082 ± 0.065 | 0.7381 b |
| Duration (months) | 35.92 ± 33.22 | ||
| HAMD score | 20.11 ± 6.895 | ||
| HAMA score | 28.35 ± 9.196 | ||
| Medication load | 2.22 ± 0.821 |
Note: Values are mean ± SD.
Abbreviations: HAMA, Hamilton anxiety scale; HAMD, Hamilton depression scale; HC, healthy control; MDD, major depressive disorder.
Chi‐square test.
Two‐sample t test.
To avoid potential confounds introduced by the use of medication, we calculated the total medication load index using an approach employed by previous studies (Almeida et al., 2009; Phillips, Travis, Fagiolini, & Kupfer, 2008; Versace et al., 2008). Briefly, we coded the dose of each medicine taken as 0 (absent), 1 (low), or 2 (high) based on previously developed criteria (Sackeim, 2001). Two medications (escitalopram and duloxetine) that are not included in the criteria were coded as 0, 1, or 2, according to the midpoint of the daily dose range recommended by the Physician's Desk Reference. The total medication load for each patient was obtained by summing all medication codes.
2.2. Stimuli
Visual stimuli were obtained using a Canon 5DS Single Lens Reflex Camera (with +24‐70 F4 camera model), and consisted of six black‐and‐white photos of female faces, showing either a happy or sad expression (three happy and three sad). The auditory stimuli were either positive (laughing) or negative (crying). Six different sounds (three laughing sounds and three crying sounds) were obtained from the same female actor using an iPhone loudspeaker, and equalized for length and volume.
To determine the experimental materials, we conducted a behavioral pre‐study with 30 subjects (17 males and 13 females) for each picture and sound to rate the valence on a nine‐point valence scale (ranging from “very fearful” to “very happy”) and the arousal of sounds on a nine‐point valence scale (ranging from “not arousing at all” to “very arousing”). The matching scores of each pair of visual and sound were also obtained with a nine‐point scale ranging from “matched well” to “did not match at all.” We picked two pictures (one positive and one negative) and two sounds (one positive and one negative) that scored the highest on the valence/arousal scales in this pre‐study. The matching score was balanced.
2.3. Procedure
To elicit specific neural responses during multiple emotional occasions, we applied an event‐related fMRI paradigm using the positive and negative faces as background to create emotional circumstances displayed which has been shown in Figure 1. In the experiment, each face condition (happy or sad) was combined with each sound condition (laughing or crying) resulting in emotionally congruent (C) and incongruent (IC) conditions. Each trial lasted 4,000, 6,000, or 8,000 ms. Each run consisted of 60 randomly arranged trials. The fMRI task comprised two runs. The only difference between them was the valence of the background (positive background, PB or negative background, NB).
FIGURE 1.
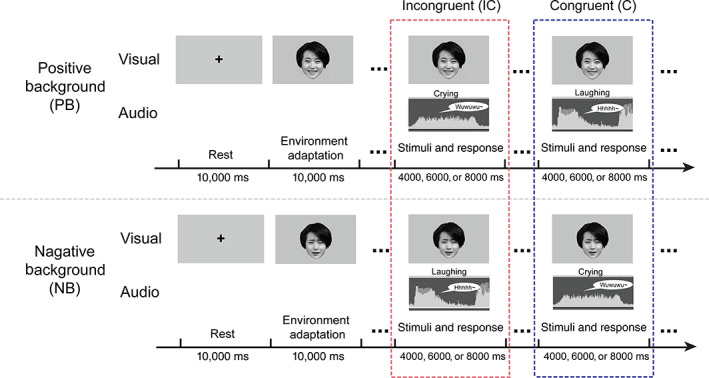
Experimental paradigm. Emotional stimuli were presented audiovisually, and participants were instructed to classify the emotional category of sound as soon as possible while keeping their eyes on a fixed background picture (which had two types of emotional valence: positive background, PB, or negative background, NB). The positive background (PB) and negative background (NB) were presented using a happy face (top) and sad face (bottom), respectively. Audio stimuli were randomly presented and balanced for the emotional category. The response window began with the stimulus onset. Without depending on response time, the trial duration was 4, 6, or 8 s
After being presented with a 10,000 ms cross and a 10,000 ms background emotion picture, participants were instructed to categorize the valence of each target sound as fast and accurately as possible while keeping their eyes on the background picture. Visual stimuli were projected on a screen approximately 50 cm from the participants, which they viewed through a mirror placed in front of their eyes. They were then required to press an MR‐compatible pad in response to the sound of laughing or crying with both hands (one hand for laughing sound and the other for crying). The corresponding hand for each emotional sound was counterbalanced between subjects. Stimuli were viewed on a 25 cm × 18.75 cm high resolution Avotec projector (SV6011; Avotec, Inc., Stuart, FL) with a screen resolution of 1,024 × 768 pixels. The sound was played through full coverage Avotec headphones (SS3300; Avotec, Inc., Stuart, FL) at a mean volume of 120 dBA. Although a 120 dBA threshold marks the onset of pain in typical daily environments, this threshold was required in order for the participants (who were also wearing earplugs and headphones) to hear the stimuli clearly in a noisy fMRI scanning environment. We used the E‐Prime program to record both the stimuli and button push response times for displayed stimuli (Schneider, Eschman, & Zuccolotto, 2002).
2.4. fMRI data acquisition
FMRI data were acquired using a 3.0 T GE 750 scanner (General Electric, Fairfield, CT) equipped with high‐speed gradients. Prior to study participation, subjects were familiarized with the MRI scanning environment and sounds. An eight‐channel prototype quadrature birdcage head coil fitted with foam padding was applied to minimize the head motion. Foam pads and earplugs were used to minimize head movement and scanner noise. Functional images were acquired with gradient‐recalled echo‐planar imaging (EPI) sequence. The parameters were as follows: repetition time/echo time = 2000 ms/30 ms, 90° flip angle, bandwidth = 250 Hz/pixel, 43 axial slices (3.2 mm slice thickness without gap), 64 × 64 matrix, and 22 cm field of view. A total of 190 volumes were obtained for each participant.
2.5. fMRI data analysis
2.5.1. Preprocessing
Functional images were preprocessed using the Data Processing Assistant for fMRI (DPARSF 4.3, http://www.fmri.org/DPARSF). The first 10 volumes were removed from each run to allow for scanner stabilization. The 180 remaining images in each run were spatially realigned to the intermediary image of each functional series, using 3D rigid body (linear) transformation with three translations and three rotation parameters. Transient movement during scanning was restricted to no more than 3 mm of translation and 3° of rotation. Images were then spatially normalized to the SPM EPI template in MNI space at a resolution of 3 × 3 × 3 mm3 and smoothed using an isotropic Gaussian kernel and a 6‐mm FWHM Gaussian kernel. In addition, the mean framewise displacement (FD) was calculated as the sum of the absolute values of changes in the six parameters for transitional and rotational displacements between volumes, and the threshold was set to 0.3 mm (Power, Barnes, Snyder, Schlaggar, & Petersen, 2012; Smyser et al., 2010). To further exclude the potential effect of head movement, we performed a two‐sample t test, and we found no difference of FD between MDDs and HC (as shown in Table 1).
2.5.2. First‐level analysis
We first performed a general linear model analysis at the single‐subject level for each subject in SPM12 (https://www.fil.ion.ucl.ac.uk/spm/) (Friston et al., 1994). Single‐subject BOLD responses were modeled using a design matrix which comprised the time points of each trail for the two experimental conditions (IC and C) in two sessions (PB and NB) separately. Six realignment parameters (three rotations and three translations), age, sex, education, and medical load were added to the design matrix as nuisance covariates. Using the modified general linear model, parameter estimate (Beta coefficients) images for the canonical hemodynamic response function (HRF) were calculated for each condition and each subject (separately for each of the two sessions).We used the incongruent emotional condition as an experimental condition and the congruent emotional condition as an implicit baseline. We are interested in the differences between the experimental and corresponding control conditions (incongruent vs. congruent), both in terms of task‐related activation and connectivity. Therefore, for each subject, emotionally incongruent responses were computed by applying baseline contrasts (IC vs. C) in PB and NB sessions separately. Subsequently, these contrast maps for each individual were used for analysis of second‐level random effects.
2.5.3. Second‐level analysis
In order to determine the possible involvement of significantly different brain circuits for the PB and NB background between MDD patients and HC, single‐subject contrasts were entered into second‐level analysis. A flexible factorial design using a 2 × 2 ANOVA was performed with the background emotional valence (PB, NB) as the within‐participant factor and group (MDD, HC) as the between‐participant factor. The mask was created by the conjunction of four activation maps, which resulted from applying one‐sample t tests (p < .05) to the contrast maps for each group (HC in PB; MDD in PB; HC in NB; MDD in NB). Significantly different activation was determined using p < .05 with a false discovery rate (FDR) multiple comparisons correction and extent threshold k = 50 voxels. To further break down the interaction effects, post hoc pair‐wise comparisons (mean activations) were conducted separately in each area with two‐sample t tests in Graphpad Prism 6 for Windows (and regressing out the effects of age, sex, education, and medical load).
2.5.4. Psychophysiological interactions analysis
In order to examine the abnormal modulation effect of negative mood in MDDs on functional connectivity of key regions with the rest of the brain, we performed a general psychophysiological interaction (gPPI) analysis by using significant regions of interest (ventromedial prefrontal cortex, vmPFC and dorsolateral prefrontal cortex, dlPFC) as seeds which were achieved from the interaction between background conditions and groups. The left vmPFC showed higher activation in MDD patients, but not HC, when they were confronted with the negative stimuli in auditory channel when concurrently seeing visual facial expressions, demonstrating negatively biased activities in patients. The MDD group also showed decreased activation in the right dorsolateral prefrontal cortex, suggesting cognitive control deficits in depression. Thus, both the vmPFC and dlPFC were used to extract deconvolved activity time courses within the region of interest (ROI) (MNI coordinates: vmPFC, x, y, z = −18, 33, 42 and dlPFC, x, y, z = 45, 27, 18; a sphere of 6 mm centered on the local maximum peak of activity) for each subject. PPI analysis employed 11 regressors: 2 activation time courses in a given volume of interest (the physiological variable) (C and IC conditions), 2 psychological variables of interest (C and IC conditions), the psychophysiological interaction term, and 6 realignment parameters. To create the psychophysiological interaction terms, we calculated the contrast of the time course with a condition‐specific regressor that probed the emotional incongruency (IC vs. C). We completed PPI analyses for each ROI in each subject, and then entered the results into statistical analyses.
In order to examine the interaction effects of seed functional connectivity, we followed the same analytic procedure as with our analysis of BOLD responses. The contrast images of the PPI terms in each participant were submitted to a 2 × 2 ANOVA model, which resulted in an interaction effect map between background (PB, NB) and group (MDD, HC) that was able to identify regions showing differential connectivity with seeds. Effects of age, sex, education and medical load were regressed out. The mask was also created by the conjunction of four PPI images which resulted from applying one‐sample t test (p < .05) to the contrast maps or each group (HC in PB; MDD in PB; HC in NB; MDD in NB). The false discovery rate (FDR) multiple comparisons correction (p < .05, extent threshold k = 50 voxels) was also used to determine significant interaction difference of connectivity. To further break down the interaction effects, the significant differences (PB or NB) between the patient and the control groups were extracted as a mask consisting of several regions of interest (i.e., a sphere of 6 mm centered on the local maximum value). Each centered of interested regions in significant interaction difference of connectivity was located on the local maximum peak of clusters, which was the same with the picking criteria of seed regions (vmPFC and dlPFC) in interaction difference of activation. Then the radius of each spherical ROIs was set as 6 mm. Post hoc pair‐wise comparisons (mean activations) were conducted for the two‐sample t tests in each ROIs in Graphpad Prism 6 for Windows, with the effects of age, sex, education, and medical load regressed out.
2.5.5. Validation analysis
Previous studies had shown that antidepressant medications did affect the brain activity (Hilland et al., 2020; Li et al., 2018). To explore the potential effect of antidepressant medication, we performed an additional Pearson's correlation analysis between the significant activation and connectivity and the total medical load index of each patient. In addition, to explore the relationship between the brain activation or connectivity and the clinical scores of patients, the Pearson's correlations between the activation and connectivity of brain regions with significant interaction and HAMD scores were calculated.
3. RESULTS
3.1. Brain activation
The F‐contrast group × condition (contrast: IC vs. C) showed activation differences in five areas: the left medial frontal gyrus, right dorsolateral prefrontal cortex, right angular gyrus, left middle occipital gyrus, and left inferior temporal gyrus (see Figure 2 and Table 2). In each area, post hoc pair‐wise comparisons were conducted separately to further explore these effects. In the left medial frontal gyrus, higher activation (contrast: IC v. C) was observed in the MDD group than the HC group in the PB [t(72) = 3.796, p < .001], and the decreased activation (contrast: IC vs. C) was observed in NB [t(72) = −21.33, p < .0001] conditions. As two types of incongruent and congruent combinations exist, there were four conditions in total (incongruent: PB with crying sound, NB with laughing sound; congruent: PB with laughing sound, NB with crying sound). Interestingly, we found a stronger bias in vmPFC activity in the patient group in response to negative stimuli. In positive background conditions, MDD patients showed elevated activation when one channel was negative (PB with crying sound) compared with conditions of congruent positive emotion (i.e., PB with laughing sound). Under negative background conditions, MDD patients showed higher activation when both channels were negative (NB with crying) compared to incongruent emotional conditions (NB with laughing sound). This tendency was opposite in HC. Thus, we found a negatively biased activation of left the vmPFC in patients. and a positively biased activation of left vmPFC in healthy participants.
FIGURE 2.
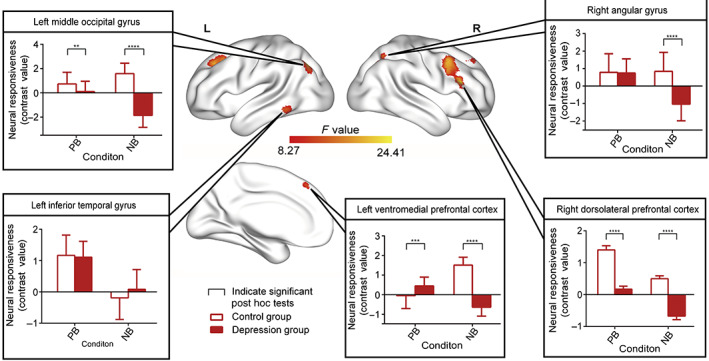
Functional magnetic resonance imaging activation of the full interaction of group × condition (contrast: emotionally incongruent vs. emotionally congruent). Significant post hoc comparisons of neural responsiveness (mean, square deviation) were calculated within each group and condition. Bar charts showed that the MDD group showed significantly decreased activation in the right dorsolateral prefrontal cortex, right angular gyrus, and middle occipital gyrus (contrast: IC vs. C) compared with HC in both the PB and the NB condition. Interestingly, in the left vmPFC, MDD patients showed stronger activation when one sensory channel was negative (i.e., PB with crying) under positive background. Under negative background conditions, MDD patients showed higher activation, when both sensory channels are negative (i.e., NB with crying)
TABLE 2.
Brain activation in the full interaction (group × condition) analysis
| MNI coordinates | ||||||
|---|---|---|---|---|---|---|
| ID | Brain regions | Cluster size | Peak F value | X | Y | Z |
| Cluster 1 | Left ventromedial prefrontal cortex | 342 | 21.67 | −18 | 33 | 42 |
| Cluster 2 | Right dorsolateral prefrontal cortex | 307 | 24.01 | 45 | 27 | 18 |
| Cluster 3 | Right angular gyrus | 80 | 17.77 | 33 | −66 | 48 |
| Cluster 4 | Left middle occipital gyrus | 190 | 24.41 | −36 | −69 | 39 |
| Cluster 5 | Left inferior temporal gyrus | 86 | 19.72 | −54 | −45 | −1 |
Note: All the clusters survived false discovery rate (FDR) correction with a high threshold of p < .05 and extent threshold k = 50 voxels.
Abbreviations: MNI, Montreal Neurological Institute; peak F value, statistical value of the peak voxel showing main effect; X, Y, Z, coordinates of primary peak locations in the MNI space.
The depression group showed significantly decreased activation (contrast: IC vs. C) In the right dlPFC compared to HC both in the PB [t(72) = −7.594, p < .0001] and the NB [t(72) = −8.145, p < .0001] condition. The MDD group showed significantly lower activation (contrast: IC vs. C) in the right angular gyrus in the NB condition only [t(72) = −7.905, p < .001]. The MDD group also showed diminished activation (contrast: IC vs. C) in the middle occipital gyrus in the PB [t(72) = −3.004, p < .01] and NB [t(72) = −15.90, p < .0001] conditions.
3.2. Functional connectivity
To further examine altered neural circuits in MDD patients during emotional regulation processes, we performed PPI analysis by using significant regions in whole‐ brain contrast (with the vmPFC and dlPFC used as seeds). The flexible factorial analysis had showed significant interaction effects in the connectivity between vmPFC and right posterior cingulate gyrus, right insula, right parahippocampal gyrus, right ventromedial prefrontal cortex, right dorsolateral prefrontal cortex, right ventrolateral prefrontal cortex, right dorsolateral prefrontal cortex (Figure 3 and Table 3). Post‐hoc analyses suggested that the vmPFC had significant decreased connectivity (contrast: IC v. C) to the right ventrolateral prefrontal cortex [PB condition: t(72) = −4.301, p < 0.0001], left dorsolateral prefrontal cortex [PB condition: t(72) = −3.117, p = 0.0026; NB condition: t(72) = −2.038, p = 0.04], right ventromedial prefrontal cortex [PB condition: t(72) = −4.649, p < 0.0001; NB condition: t(72) = −9.853, p < 0.0001], right dorsolateral prefrontal cortex [NB condition: t(72) = −7.647, p < 0.0001], right insula [PB condition: t(72) = −5.199, p < 0.0001; NB condition: t(72) = −5.383, p < 0.0001], right parahippocampal gyrus [PB condition: t(72) = −7.700, p < 0.0001; NB condition: t(72) = −2.590, p = 0.011] and right posterior cingulate cortex (PB condition: t(72) = 9.797, p < 0.0001). Increased connectivity (contrast: IC vs. C) between the vmPFC and the right posterior cingulate cortex [PB condition: t(72) = 9.797, p < 0.0001] was also found in the MDD patients. Focusing the patient group only, we could find a stronger bias connectivity between vmPFC and right posterior cingulate cortex in response to concurrent negative auditory stimuli and visual facial expressions.
FIGURE 3.
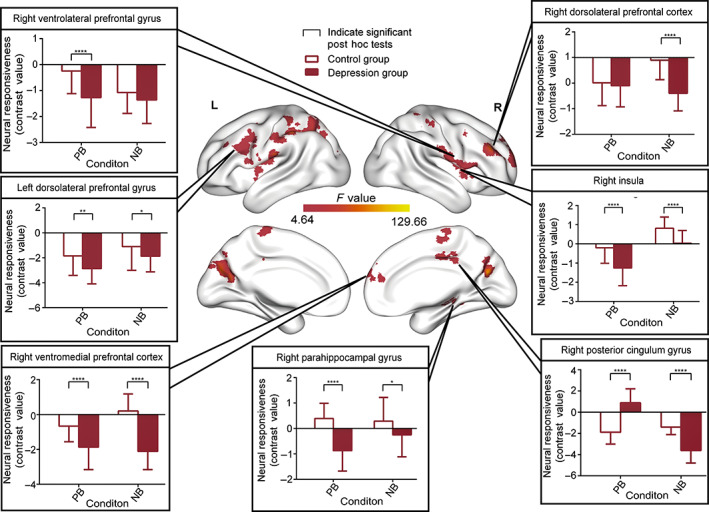
Psychophysiological interaction (vmPFC; seed region) of the full interaction of group × condition (contrast: emotionally incongruent vs. emotionally congruent). Significant post hoc comparisons of neural responsiveness (mean, square deviation) were calculated within each group and condition. Bar charts showed that vmPFC showed significantly decreased connectivity with the right insula, right ventromedial prefrontal cortex, left dorsolateral prefrontal cortex, right ventrolateral prefrontal gyrus and right parahippocampal gyrus in the PB condition in the MDDs compared with HC. Diminished connectivity was found between vmPFC and right insula, right dorsolateral prefrontal cortex, right parahippocampal gyrus, left dorsolateral prefrontal cortex, right ventromedial prefrontal cortex and the right posterior cingulate cortex in the NB condition in the depression group. Importantly, MDD showed a bias in vmPFC connectivity with the right posterior cingulate cortex when participants were exposed to concurrent negative auditory information and visual facial expression stimuli
TABLE 3.
Psychophysiological interaction of the full interaction (vmPFC, group × condition)
| MNI coordinates | ||||||
|---|---|---|---|---|---|---|
| ID | Brain regions | Cluster size | Peak F value | X | Y | Z |
| Cluster 1 |
Right insula Right ventrolateral prefrontal cortex Right dorsolateral prefrontal cortex |
309 | 104.69 | 63 | 9 | 9 |
| Cluster 2 | Right dorsolateral prefrontal cortex | 172 | 106.48 | 42 | 42 | 30 |
| Cluster 3 | Right cingulate gyrus | 61 | 58.43 | 0 | −33 | 39 |
| Cluster 4 | Right parahippocampal gyrus | 55 | 39.82 | 33 | −39 | −9 |
| Cluster 5 | Right ventromedial prefrontal cortex | 186 | 65.38 | 18 | 63 | 24 |
| Cluster 6 |
Left middle frontal gyrus Left precentral gyrus |
463 | 78.37 | −36 | −12 | 21 |
| Cluster 7 | Left postcentral gyrus | 194 | 91.10 | −60 | −27 | 15 |
| Cluster 8 | Left superior occipital gyrus | 141 | 99.18 | −15 | −78 | 27 |
| Cluster 9 | Right precuneus | 124 | 107.58 | 15 | −72 | 21 |
| Cluster 10 | Right middle frontal gyrus | 57 | 74.90 | 33 | 3 | 30 |
| Cluster 11 | Left parietal lobule | 468 | 129.66 | −45 | −36 | 36 |
| Cluster 12 | Right postcentral gyrus | 107 | 127.19 | 36 | −42 | 66 |
| Cluster 13 | Right supplementary motor area | 67 | 66.89 | 0 | −15 | 60 |
Note: All the clusters survived false discovery rate (FDR) correction with a high threshold of p < .05 and extent threshold k = 50 voxels.
Abbreviations: MNI, Montreal Neurological Institute; peak F value, statistical value of the peak voxel showing main effect; X, Y, Z, coordinates of primary peak locations in the MNI space.
Flexible factorial analysis also showed significant interaction effects in the connectivity between dlPFC and left middle temporal gyrus, right putamen, left putamen, left insula, right insula, right ventrolateral prefrontal cortex, right dorsolateral prefrontal cortex (Figure 4 and Table 4). Post hoc analysis suggested that the dlPFC showed significantly diminished connectivity (contrast: IC vs. C) with the left middle temporal gyrus [PB condition: t(72) = −11.34, p < .0001; NB condition: t(72) = −9.853, p < .0001], right putamen [PB condition: t(72) = −7.967, p < .0001], the left putamen [PB condition: t(72) = −13.18, p < .0001], left insula [PB condition: t(72) = −17.85, p < .0001], right insula [PB condition: t(72) = −2.656, p < .01], right ventrolateral prefrontal cortex [PB condition: t(72) = −26.32, p < .0001; NB condition: t(72) = −3.28, p < .01] and right dorsolateral prefrontal cortex [PB condition: t(72) = −14.79, p < .0001]. In the MDD group, increased connectivity (contrast: IC vs. C) was found between the dlPFC and right putamen [NB condition: t(72) = 8.214, p < .0001], left putamen [NB condition: t(72) = 4.495, p < .0001], left insula [NB condition: t(72) = 2.948, p < .01], right insula [NB condition: t(72) = 9.302, p < .0001] and right dorsolateral prefrontal cortex [NB condition: t(72) = 2.648, p < .01]. Interestingly, we found obvious bias connectivity between the dlPFC and most regions in response to the concurrent presentation of positive auditory stimuli and visual facial expressions. This tendency was the opposite in HC. Thus, we concluded that we had found a positive connectivity bias from the right dlPFC to other brain regions in MDD.
FIGURE 4.
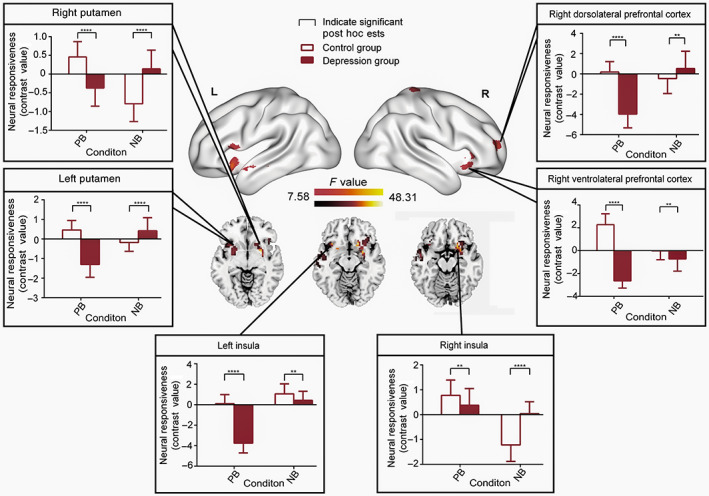
Psychophysiological interaction (dlPFC; seed region) of the full interaction of group × condition (contrast: emotionally incongruent vs. emotionally congruent). Significant post hoc comparisons of neural responsiveness (mean, square deviation) were calculated within each group and condition. Compared to the HC, the dlPFC in MDDs showed distinct decreased connectivity with the left middle temporal gyrus, left putamen, left insula, right insula, right ventrolateral prefrontal cortex and right dorsolateral prefrontal cortex in the PB condition. Increased connectivity was found in the NB condition in the depression group between the dlPFC and right putamen, left putamen, right insula, right ventrolateral prefrontal cortex and the right dorsolateral prefrontal cortex. Interestingly, under positive background conditions, MDD patients showed a bias decreased tendency in dlPFC connectivity with the bilateral putamen, bilateral insula, right ventrolateral prefrontal cortex and the right dorsolateral prefrontal cortex when participants were exposed to concurrent negative auditory information and visual facial expression stimuli
TABLE 4.
Psychophysiological interaction of the full interaction (dlPFC, group × condition)
| MNI coordinates | ||||||
|---|---|---|---|---|---|---|
| ID | Brain regions | Cluster size | Peak F value | X | Y | Z |
| Cluster 1 |
Right putamen Right insula Right ventrolateral prefrontal cortex |
265 | 48.31 | 27 | 0 | −6 |
| Cluster 2 |
Left insula Left putamen |
125 | 33.08 | −33 | 18 | −12 |
| Cluster 3 | Left middle temporal gyrus | 54 | 24.47 | −51 | −3 | −15 |
| Cluster 4 | Left calcarine | 146 | 34.33 | 33 | −39 | −9 |
| Cluster 5 |
Right middle frontal gyrus Right dorsolateral prefrontal cortex |
89 | 37.66 | 30 | 60 | 12 |
| Cluster 6 | Left precentral gyrus | 74 | 20.25 | −51 | 18 | 9 |
| Cluster 7 | Right precuneus | 98 | 39.95 | 18 | −75 | 27 |
| Cluster 8 | Right precentral gyrus | 56 | 23.62 | 18 | −36 | 72 |
Note: All the clusters survived false discovery rate (FDR) correction with a high threshold of p < .05 and extent threshold k = 50 voxels.
Abbreviations: MNI, Montreal Neurological Institute; peak F value, statistical value of the peak voxel showing main effect; X, Y, Z, coordinates of primary peak locations in the MNI space.
3.3. Validation analysis
As shown in Figure S1 , the significant interaction activation and connectivity did not correlate with total medical load index (all p > .05). This result suggests that there are no potential confounding effects of medication load on the activity and connectivity of patients in this study.
As for the relationships between the brain activation and connectivity and the clinical symptoms, we found that either activation or connectivity in the interaction regions were all not significantly correlated with the HAMD scores (all p > .05). The correlation coefficients (r) and significance index (p) value were listed in Tables S1 –S3.
4. DISCUSSION
In this study, we aimed to adopt an fMRI audiovisual emotional paradigm to identify the underlying neural mechanisms contributing to negative bias effects in patients with MDD. At the local neural level, we found that MDD patients showed increased bias activity in the vmPFC while listening to negative auditory stimuli and concurrently processing visual facial expressions, along with decreased dlPFC activity in both the positive and negative visual facial conditions. At the network level, we applied PPI analyses to further reveal the network dysfunction that was led by the vmPFC and dlPFC. This result showed that MDD exhibited significantly decreased connectivity in areas involved in automatic emotional processes and voluntary control systems during perception of negative stimuli, including the vmPFC, dlPFC, posterior cingulate cortex, insula, and striatum. These findings provide novel evidence for the emotion dysregulation hypothesis, which suggest that the negative bias effect of audiovisual emotion processing in MDD patients is associated with strong bottom‐up upstream influences on the medial prefrontal areas combined with dysfunction in the dorsal prefrontal top‐down control system.
Regarding our investigation of aberrant local neural processes, we found increased bias activity in the left vmPFC, which is a key region for negative audiovisual emotional stimuli bias processing in MDD patients. The overactive pattern in medial regions during emotion processing have been proposed as key structures contributing to dysfunctional emotion processing in MDD (Grimm et al., 2009; Opel et al., 2017). The vmPFC plays an important role in increasing positive emotional experiences related to stressful events (Doré et al., 2017; Yang et al., 2018), and in attenuating negative emotions during recovery (Roy, Shohamy, & Wager, 2012; Seo et al., 2014). Therefore, abnormal vmPFC activity in MDD patients could lead to poorly managed responses to negative stressors. This would add to the cumulative biological burdens in patients and make the organism more vulnerable to developing diseases or exacerbating existing disease symptoms (Cohen, Janicki‐Deverts, & Miller, 2007; Kube et al., 2020; Rief & Joormann, 2019). Prior research has also demonstrated that medial PFC hyperactivation during sad moods may be an indicator of relapse risk in individuals with remitted depression (Macoveanu et al., 2014). Moreover, the vmPFC is the hub of regions that encode negative self‐referent in MDD (Yoshimura et al., 2010; Li et al., 2018). Negative self‐representations could lead to wider dysfunction in depressed brains (Disner et al., 2011). Thus, we speculate that the negative bias activity in the vmPFC is a result of multiple pathological mechanisms in MDD patients.
Decreased dlPFC activity was also found in MDD patients in our study in both the positive and negative emotional conditions. Because the dlPFC is a key part of the top‐down signaling network that controls executive functioning, decreased responses to emotional stimuli in this area are also associated with dysfunction in suppressing negative stimuli (Opel et al., 2017). The combination of impaired inhibition and prolonged attention to negative material involved dlPFC further sustains depression symptoms (Kertz et al., 2019). Furthermore, cognitive reappraisal, which involves changing one's interpretation of an affective stimulus to modify emotional impacts, mainly depends on the dlPFC (Ochsner et al., 2012). As a result, hypoactivation of the dlPFC has repeatedly been found to be a feature of acute MDD during emotional processing (Disner et al., 2011; Ochsner et al., 2012). The dlPFC has also been a frequent target of innovative therapeutic interventions like transcranial magnetic stimulation (Kito et al., 2017; Sonmez et al., 2019). The dlPFC dysfunction during audiovisual emotion processing that we observed in our study is well in line with these previous findings.
Our analysis of task‐specific connectivity provides further evidence for the underlying network mechanisms associated with functional alterations in the vmPFC and dlPFC. These results are consistent with previous neural models of emotion regulation (Phillips, Ladouceur, & Drevets, 2008). This conceptual framework recognizes that emotion regulation can be disassembled into automatic and voluntary regulatory subprocesses, which mainly involve the vmPFC and dlPFC, respectively (Rive et al., 2013). These systems are also believed to operate in parallel (and possibly simultaneously), as they regulate emotional responses that emerge from subcortical regions (i.e., the amygdala and striatum) (Phillips, Ladouceur, & Drevets, 2008). The bottom‐up automatic regulation subprocess normally predominantly involves ventral medial regulatory structures, as well as the hippocampus and parahippocampus (Etkin, Egner, & Kalisch, 2011; Phillips, Ladouceur, & Drevets, 2008). The dysfunctional integrity and inefficient transfer of information between hippocampus and the vmPFC have been associated with negative distortions of memory and learning in MDD patients, which in turn simply strengthens negative thoughts (Goto & Grace, 2008). Internal negative attention of depression could also lead to extra cognitive burdens on the prefrontal cortex (Mennen et al., 2019), and contribute to increases in connectivity of the ventrolateral–dorsolateral prefrontal system in order to overcome distractions from negative emotions (Frodl et al., 2010). Thus, our finding of decreased coupling between the vmPFC and prefrontal regions could help explain misrepresentations of external environment in depression. During the early stages of emotional regulation, which are mediated by medial prefrontal regions, lateral prefrontal cortical regions (which are critical to voluntary top‐down control) may be additionally recruited in MDD subjects in order to achieve successful emotion regulation (Rive et al., 2013). However, when the emotional experience is already underway (as in our study), the strategy of additional recruitment of lateral prefrontal structures seems to fail, as reflected by significantly reduced activity in the lateral prefrontal cortex (Gotlib & Joormann, 2010). Particularly in the negative circumstance, the decreased connectivity between dlPFC and other regions could be interpreted as the decreased top‐down control ability to regulate negative emotion, which further emphasize the role of dlPFC (Sladky et al., 2015). When facing a negative environment MDD patients need additional cognitive attempt to conduct emotion processing (Gotlib & Joormann, 2010). Once the environment becomes more positive, the more normal function of the dlPFC may recover. In addition, as the deficit ability of dlPFC, inhibition of subcortical regions (like striatum) becomes increasingly weak, which was also demonstrated by our results (Korgaonkar et al., 2019; Li et al., 2018). Even worse, attempts to regulate negative emotions by recruiting right ventral lateral prefrontal cortex in MDD patients were associated with increased amygdala and insula activity (Johnstone, van Reekum, Urry, Kalin, & Davidson, 2007). The coupling between the insula and both the vmPFC and dlPFC suggests an inefficient integration of stimulus‐driven bottom‐up interoceptive signals with top‐down predictions to adapt the outside emotion state (Korgaonkar et al., 2019; LeWinn et al., 2018; Sheline, Price, Yan, & Mintun, 2010). Importantly, voluntary cognitive emotion regulation strategies are also related to DMN function (Rive et al., 2013). DMN hyperconnectivity appears to be associated with maladaptive rumination in depression (Li et al., 2018). The content of this ruminative thinking can be divided into a typically negative self‐focused component (i.e., the process of repetitively and passively thinking about one's feelings, the possible causes, and the consequences) (Nolen‐Hoeksema, Wisco, & Lyubomirsky, 2008; Zamoscik, Huffziger, Ebner‐Priemer, Kuehner, & Kirsch, 2014). Thus, the negative bias connections between the vmPFC and right posterior cingular gyrus (PCC) in our study could be interpreted as uncontrollable patterns lead by excessive self‐focus when MDD patients face a negative event. Therefore, these results elucidate the underlying abnormalities of the neural systems involved in audiovisual emotional processing.
The major weakness of our study is that we did not perform a cognitive assessment of MDD patients in our experimental design. Because patients with MDD are usually associated with several cognitive comorbidities, particularly biases in attention and memory (Kertz et al., 2019; Müller et al., 2017). It will be crucial to conduct cognitive tests in the future studies to avoid the task influence arising from cognitive dysfunction in MDD patients. In addition, considering that previous findings have demonstrated the significant effects of medications on the brain function in MDD patients (Hilland et al., 2020; Li et al., 2018) and that no medication‐free patient control group is involved in this study, we cannot exclude the potential effects of medications although no significant correlation is observed. We expect that future studies with medication‐free samples can replicate our results.
5. CONCLUSION
In summary, the current study identified a negative bias effect of audiovisual emotion processing in patients with MDD. We observed increased bias activity in the vmPFC while listening to negative auditory stimuli and concurrently processing visual facial expressions in MDD, as well as decreased dlPFC activity in both the positive and negative visual facial conditions. Moreover, task‐specific connectivity analysis showed network dysfunction in areas involved in automatic emotional processes and voluntary control systems during perception of negative stimuli, including the vmPFC, dlPFC, as well as subcortical posterior cingulate cortex, insula, and striatum. These findings suggest that MDD is engaged in complex network dysfunction which was led by the excessive ventral bottom‐up negative emotional influences and incapable dorsal prefrontal top‐down cognitive control during exposure to complex real‐life‐like multimodal stimuli. Our study provides novel evidence for the multimodal emotional dysregulation and may contribute to further understanding of the neural mechanism underlying depressive symptoms.
CONFLICT OF INTERESTS
The authors declare that they have no conflict of interest.
ETHICS STATEMENT
Approval was obtained from the research ethical committee of School of Life Science and Technology at University of Electronic Science and Technology of China. The procedures used in this study adhere to the tenets of the Declaration of Helsinki.
CONSENT TO PARTICIPATE
Informed consent was obtained from all individual participants included in the study.
Supporting information
Data S1: Supporting Information
ACKNOWLEDGEMENTS
This work was supported by the Key Project of Research and Development of the Ministry of Science and Technology (No. 2018AAA0100705), the National Natural Science Foundation of China (Nos. 82072006, 61906034, 62036003, U1808204), and the Sichuan Science and Technology Foundation (No. 2019YFS0429).
Li, L. , Li, R. , Shen, F. , Wang, X. , Zou, T. , Deng, C. , Wang, C. , Li, J. , Wang, H. , Huang, X. , Lu, F. , He, Z. , & Chen, H. (2022). Negative bias effects during audiovisual emotional processing in major depression disorder. Human Brain Mapping, 43(4), 1449–1462. 10.1002/hbm.25735
Funding information the Key Project of Research and Development of the Ministry of Science and Technology, Grant/Award Number: 2018AAA0100705; the National Natural Science Foundation of China, Grant/Award Numbers: 61906034, 62036003, 82072006, U1808204; the Sichuan Science and Technology Foundation, Grant/Award Number: 2019YFS0429
Contributor Information
Rong Li, Email: rongli1120@gmail.com.
Huafu Chen, Email: chenhf@uestc.edu.cn.
DATA AVAILABILITY STATEMENT
The data that support the findings of this study are available from the corresponding author upon reasonable request. The analysis scripts used for supporting the main findings of the article are publicly available at Github (https://github.com/LiyuanLly/fMRI‐task‐activation‐) and (https://github.com/LiyuanLly/fMRI‐task‐PPI).
REFERENCES
- Almeida, J. R. C. , Akkal, D. , Hassel, S. , Travis, M. J. , Banihashemi, L. , Kerr, N. , … Phillips, M. L. (2009). Reduced gray matter volume in ventral prefrontal cortex but not amygdala in bipolar disorder: Significant effects of gender and trait anxiety. Psychiatry Research ‐ Neuroimaging, 171(1), 54–68. 10.1016/j.pscychresns.2008.02.001 [DOI] [PMC free article] [PubMed] [Google Scholar]
- Banich, M. T. , Mackiewicz, K. L. , Depue, B. E. , Whitmer, A. J. , Miller, G. A. , & Heller, W. (2009). Cognitive control mechanisms, emotion and memory: A neural perspective with implications for psychopathology. Neuroscience & Biobehavioral Reviews, 33(5), 613–630. 10.1016/j.neubiorev.2008.09.010 [DOI] [PMC free article] [PubMed] [Google Scholar]
- Beatteay, A. , & Wilbiks, J. M. P. (2020). The effects of major depressive disorder symptoms on audiovisual integration. Journal of Cognitive Psychology, 32(8), 805–815. 10.1080/20445911.2020.1825452 [DOI] [Google Scholar]
- Beck, A. T. (1967). Depression: Clinical, experimental and theoretical aspects. New York: Hoeber. [Google Scholar]
- Beck, A. T. , & Bredemeier, K. (2016). A unified model of depression. Clinical Psychological Science, 4(4), 596–619. 10.1177/2167702616628523 [DOI] [Google Scholar]
- Cohen, S. , Janicki‐Deverts, D. , & Miller, G. E. (2007). Psychological stress and disease. JAMA, 298(14), 1685. 10.1001/jama.298.14.1685 [DOI] [PubMed] [Google Scholar]
- De Gelder, B. , & Bertelson, P. (2003). Multisensory integration, perception and ecological validity. Trends in Cognitive Sciences, 7(10), 460–467. 10.1016/j.tics.2003.08.014 [DOI] [PubMed] [Google Scholar]
- De Raedt, R. , & Koster, E. H. W. (2010). Understanding vulnerability for depression from a cognitive neuroscience perspective: A reappraisal of attentional factors and a new conceptual framework. Cognitive, Affective, & Behavioral Neuroscience, 10, 50–70. 10.3758/CABN.10.1.50 [DOI] [PubMed] [Google Scholar]
- Disner, S. G. , Beevers, C. G. , Haigh, E. A. P. , & Beck, A. T. (2011). Neural mechanisms of the cognitive model of depression. Nature Reviews Neuroscience, 12(8), 467–477. 10.1038/nrn3027 [DOI] [PubMed] [Google Scholar]
- Dolan, R. J. , Morris, J. S. , & De Gelder, B. (2001). Crossmodal binding of fear in voice and face. Proceedings of the National Academy of Sciences of the United States of America, 98(17), 10006–10010. 10.1073/pnas.171288598 [DOI] [PMC free article] [PubMed] [Google Scholar]
- Doose‐Grünefeld, S. , Eickhoff, S. B. , & Müller, V. I. (2015). Audiovisual emotional processing and neurocognitive functioning in patients with depression. Frontiers in Integrative Neuroscience, 9(January), 1–13. 10.3389/fnint.2015.00003 [DOI] [PMC free article] [PubMed] [Google Scholar]
- Doré, B. P. , Boccagno, C. , Burr, D. , Hubbard, A. , Long, K. , Weber, J. , … Ochsner, K. N. (2017). Finding positive meaning in negative experiences engages ventral striatal and ventromedial prefrontal regions associated with reward valuation. Journal of Cognitive Neuroscience, 29(2), 235–244. 10.1162/jocn_a_01041 [DOI] [PubMed] [Google Scholar]
- Etkin, A. , Egner, T. , & Kalisch, R. (2011). Emotional processing in anterior cingulate and medial prefrontal cortex. Trends in Cognitive Sciences, 15(2), 85–93. 10.1016/j.tics.2010.11.004 [DOI] [PMC free article] [PubMed] [Google Scholar]
- Fales, C. L. , Barch, D. M. , Rundle, M. M. , Mintun, M. A. , Snyder, A. Z. , Cohen, J. D. , … Sheline, Y. I. (2008). Altered emotional interference processing in affective and cognitive‐control brain circuitry in major depression. Biological Psychiatry, 63(4), 377–384. 10.1016/j.biopsych.2007.06.012 [DOI] [PMC free article] [PubMed] [Google Scholar]
- Friston, K. J. , Holmes, A. P. , Worsley, K. J. , Poline, J. P. , Frith, C. D. , & Frackowiak, R. S. J. (1994). Statistical parametric maps in functional imaging: A general linear approach. Human Brain Mapping, 2, 189–210. 10.1002/hbm.460020402 [DOI] [Google Scholar]
- Frodl, T. , Bokde, A. L. W. , Scheuerecker, J. , Lisiecka, D. , Schoepf, V. , Hampel, H. , … Meisenzahl, E. (2010). Functional connectivity bias of the orbitofrontal cortex in drug‐free patients with major depression. Biological Psychiatry, 67(2), 161–167. 10.1016/j.biopsych.2009.08.022 [DOI] [PubMed] [Google Scholar]
- Gotlib, I. H. , & Joormann, J. (2010). Cognition and depression: Current status and future directions. Annual Review of Clinical Psychology, 6(1), 285–312. 10.1146/annurev.clinpsy.121208.131305 [DOI] [PMC free article] [PubMed] [Google Scholar]
- Goto, Y. , & Grace, A. A. (2008). Dopamine modulation of hippocampal‐prefrontal cortical interaction drives memory‐guided behavior. Cerebral Cortex, 18(6), 1407–1414. 10.1093/cercor/bhm172 [DOI] [PMC free article] [PubMed] [Google Scholar]
- Grimm, S. , Boesiger, P. , Beck, J. , Schuepbach, D. , Bermpohl, F. , Walter, M. , … Northoff, G. (2009). Altered negative BOLD responses in the default‐mode network during emotion processing in depressed subjects. Neuropsychopharmacology, 34(4), 932–943. 10.1038/npp.2008.81 [DOI] [PubMed] [Google Scholar]
- Hilland, E. , Landrø, N. I. , Harmer, C. J. , Browning, M. , Maglanoc, L. A. , & Jonassen, R. (2020). Attentional bias modification is associated with fMRI response toward negative stimuli in individuals with residual depression: A randomized controlled trial. Journal of Psychiatry and Neuroscience, 45(1), 23–33. 10.1503/jpn.180118 [DOI] [PMC free article] [PubMed] [Google Scholar]
- Johnstone, T. , van Reekum, C. M. , Urry, H. L. , Kalin, N. H. , & Davidson, R. J. (2007). Failure to regulate: Counterproductive recruitment of top‐down prefrontal‐subcortical circuitry in major depression. Journal of Neuroscience, 27(33), 8877–8884. 10.1523/JNEUROSCI.2063-07.2007 [DOI] [PMC free article] [PubMed] [Google Scholar]
- Kertz, S. J. , Petersen, D. R. , & Stevens, K. T. (2019). Cognitive and attentional vulnerability to depression in youth: A review. Clinical Psychology Review, 71, 63–77. 10.1016/j.cpr.2019.01.004 [DOI] [PubMed] [Google Scholar]
- Kito, S. , Hasegawa, T. , Takamiya, A. , Noda, T. , Nakagome, K. , Higuchi, T. , & Koga, Y. (2017). Transcranial magnetic stimulation modulates resting EEG functional connectivity between the left dorsolateral prefrontal cortex and limbic regions in medicated patients with treatment‐resistant depression. Journal of Neuropsychiatry and Clinical Neurosciences, 29(2), 155–159. 10.1176/appi.neuropsych.15120419 [DOI] [PubMed] [Google Scholar]
- Korgaonkar, M. S. , Erlinger, M. , Breukelaar, I. A. , Boyce, P. , Hazell, P. , Antees, C. , … Malhi, G. S. (2019). Amygdala activation and connectivity to emotional processing distinguishes asymptomatic patients with bipolar disorders and unipolar depression. Biological Psychiatry: Cognitive Neuroscience and Neuroimaging, 4(4), 361–370. 10.1016/j.bpsc.2018.08.012 [DOI] [PubMed] [Google Scholar]
- Kube, T. , Schwarting, R. , Rozenkrantz, L. , Glombiewski, J. A. , & Rief, W. (2020). Distorted cognitive processes in major depression: A predictive processing perspective. Biological Psychiatry, 87(5), 388–398. 10.1016/j.biopsych.2019.07.017 [DOI] [PubMed] [Google Scholar]
- LeWinn, K. Z. , Strigo, I. A. , Connolly, C. G. , Ho, T. C. , Tymofiyeva, O. , Sacchet, M. D. , … Yang, T. T. (2018). An exploratory examination of reappraisal success in depressed adolescents: Preliminary evidence of functional differences in cognitive control brain regions. Journal of Affective Disorders, 240(July), 155–164. 10.1016/j.jad.2018.07.020 [DOI] [PubMed] [Google Scholar]
- Li, B.‐J. , Friston, K. , Mody, M. , Wang, H.‐N. , Lu, H.‐B. , & Hu, D.‐W. (2018). A brain network model for depression: From symptom understanding to disease intervention. CNS Neuroscience & Therapeutics, 24(11), 1004–1019. 10.1111/cns.12998 [DOI] [PMC free article] [PubMed] [Google Scholar]
- Macoveanu, J. , Knorr, U. , Skimminge, A. , Søndergaard, M. G. , Jørgensen, A. , Fauerholdt‐Jepsen, M. , … Kessing, L. V. (2014). Altered reward processing in the orbitofrontal cortex and hippocampus in healthy first‐degree relatives of patients with depression. Psychological Medicine, 44(6), 1183–1195. 10.1017/S0033291713001815 [DOI] [PubMed] [Google Scholar]
- Mennen, A. C. , Norman, K. A. , & Turk‐Browne, N. B. (2019). Attentional bias in depression: Understanding mechanisms to improve training and treatment. Current Opinion in Psychology, 29, 266–273. 10.1016/j.copsyc.2019.07.036 [DOI] [PMC free article] [PubMed] [Google Scholar]
- Müller, V. I. , Cieslik, E. C. , Kellermann, T. S. , & Eickhoff, S. B. (2014). Crossmodal emotional integration in major depression. Social Cognitive and Affective Neuroscience, 9(6), 839–848. 10.1093/scan/nst057 [DOI] [PMC free article] [PubMed] [Google Scholar]
- Müller, V. I. , Cieslik, E. C. , Serbanescu, I. , Laird, A. R. , Fox, P. T. , & Eickhoff, S. B. (2017). Altered brain activity in unipolar depression revisited: Meta‐analyses of neuroimaging studies. JAMA Psychiatry, 74(1), 47–55. 10.1001/jamapsychiatry.2016.2783 [DOI] [PMC free article] [PubMed] [Google Scholar]
- Müller, V. I. , Habel, U. , Derntl, B. , Schneider, F. , Zilles, K. , Turetsky, B. I. , & Eickhoff, S. B. (2011). Incongruence effects in crossmodal emotional integration. NeuroImage, 54(3), 2257–2266. 10.1016/j.neuroimage.2010.10.047 [DOI] [PMC free article] [PubMed] [Google Scholar]
- Müller, V. I. , Kellermann, T. S. , Seligman, S. C. , Turetsky, B. I. , & Eickhoff, S. B. (2014). Modulation of affective face processing deficits in schizophrenia by congruent emotional sounds. Social Cognitive and Affective Neuroscience, 9(4), 436–444. 10.1093/scan/nss107 [DOI] [PMC free article] [PubMed] [Google Scholar]
- Nolen‐Hoeksema, S. , Wisco, B. E. , & Lyubomirsky, S. (2008). Rethinking rumination. Perspectives on Psychological Science, 3(5), 400–424. 10.1111/j.1745-6924.2008.00088.x [DOI] [PubMed] [Google Scholar]
- Ochsner, K. N. , Silvers, J. A. , & Buhle, J. T. (2012). Functional imaging studies of emotion regulation: A synthetic review and evolving model of the cognitive control of emotion. Annals of the new York Academy of Sciences, 1251(1), E1–E24. 10.1111/j.1749-6632.2012.06751.x [DOI] [PMC free article] [PubMed] [Google Scholar]
- Opel, N. , Redlich, R. , Grotegerd, D. , Dohm, K. , Zaremba, D. , Meinert, S. , … Dannlowski, U. (2017). Prefrontal brain responsiveness to negative stimuli distinguishes familial risk for major depression from acute disorder. Journal of Psychiatry and Neuroscience, 42(5), 343–352. 10.1503/jpn.160198 [DOI] [PMC free article] [PubMed] [Google Scholar]
- Panchal, P. , Kaltenboeck, A. , & Harmer, C. J. (2019). Cognitive emotional processing across mood disorders. CNS Spectrums, 24(1), 54–63. 10.1017/S109285291800130X [DOI] [PubMed] [Google Scholar]
- Philippi, C. L. , Cornejo, M. D. , Frost, C. P. , Walsh, E. C. , Hoks, R. M. , Birn, R. , & Abercrombie, H. C. (2018). Neural and behavioral correlates of negative self‐focused thought associated with depression. Human Brain Mapping, 39(5), 2246–2257. 10.1002/hbm.24003 [DOI] [PMC free article] [PubMed] [Google Scholar]
- Phillips, M. L. , Ladouceur, C. D. , & Drevets, W. C. (2008). A neural model of voluntary and automatic emotion regulation: Implications for understanding the pathophysiology and neurodevelopment of bipolar disorder. Molecular Psychiatry, 13(9), 833–857. 10.1038/mp.2008.65 [DOI] [PMC free article] [PubMed] [Google Scholar]
- Phillips, M. L. , Travis, M. J. , Fagiolini, A. , & Kupfer, D. J. (2008). Medication effects in neuroimaging studies of bipolar disorder. American Journal of Psychiatry, 165(3), 313–320. 10.1176/appi.ajp.2007.07071066 [DOI] [PMC free article] [PubMed] [Google Scholar]
- Pourtois, G. , Gelder, B. , Bol, A. , & Crommelinck, M. (2005). Perception of facial expressions and voices and of their combination in the human brain. Cortex, 41(1), 49–59. 10.1016/S0010-9452(08)70177-1 [DOI] [PubMed] [Google Scholar]
- Power, J. D. , Barnes, K. A. , Snyder, A. Z. , Schlaggar, B. L. , & Petersen, S. E. (2012). Spurious but systematic correlations in functional connectivity MRI networks arise from subject motion. NeuroImage, 59(3), 2142–2154. 10.1016/j.neuroimage.2011.10.018 [DOI] [PMC free article] [PubMed] [Google Scholar]
- Puryear, C. B. , Brooks, J. , Tan, L. , Smith, K. , Li, Y. , Cunningham, J. , … Sanchez, C. (2020). Opioid receptor modulation of neural circuits in depression: What can be learned from preclinical data? Neuroscience and Biobehavioral Reviews, 108, 658–678. 10.1016/j.neubiorev.2019.12.007 [DOI] [PubMed] [Google Scholar]
- Rief, W. , & Joormann, J. (2019). Revisiting the cognitive model of depression: The role of expectations. Clinical Psychology in Europe, 1(1). 10.32872/cpe.v1i1.32605 [DOI] [Google Scholar]
- Rive, M. M. , van Rooijen, G. , Veltman, D. J. , Phillips, M. L. , Schene, A. H. , & Ruhé, H. G. (2013). Neural correlates of dysfunctional emotion regulation in major depressive disorder. A systematic review of neuroimaging studies. Neuroscience and Biobehavioral Reviews, 37(10), 2529–2553. 10.1016/j.neubiorev.2013.07.018 [DOI] [PubMed] [Google Scholar]
- Rong, L. , Jiale, Y. , Liyuan, L. , Fei, S. , Ting, Z. , Hongyu, W. , … Huafu, C. (2021). Integrating multi‐level functional characteristics reveals aberrant neural patterns during audiovisual emotional processing in depression. Cerebral Cortex. 32(1), 1–14. 10.1093/cercor/bhab185 [DOI] [PubMed] [Google Scholar]
- Roy, M. , Shohamy, D. , & Wager, T. D. (2012). Ventromedial prefrontal‐subcortical systems and the generation of affective meaning. Trends in Cognitive Sciences, 16(3), 147–156. 10.1016/j.tics.2012.01.005 [DOI] [PMC free article] [PubMed] [Google Scholar]
- Sackeim, H. A. (2001). The definition and meaning of treatment‐resistant depression. Journal of Clinical Psychiatry 10‐17+35, 62(Suppl. 16), 10–17. [PubMed] [Google Scholar]
- Sanchez, A. , Vazquez, C. , Marker, C. , LeMoult, J. , & Joormann, J. (2013). Attentional disengagement predicts stress recovery in depression: An eye‐tracking study. Journal of Abnormal Psychology, 122(2), 303–313. 10.1037/a0031529 [DOI] [PubMed] [Google Scholar]
- Schneider, W. , Eschman, A. , & Zuccolotto, A. (2002). E‐prime user's guide. 2002. Pittsburgh, PA: Psychology Software Tools Inc. [Google Scholar]
- Scibelli, F. , Troncone, A. , Likforman‐Sulem, L. , Vinciarelli, A. , & Esposito, A. (2016). How major depressive disorder affects the ability to decode multimodal dynamic emotional stimuli. Frontiers in ICT, 3(SEP), 1–12. 10.3389/fict.2016.00016 [DOI] [Google Scholar]
- Seo, D. , Olman, C. A. , Haut, K. M. , Sinha, R. , MacDonald, A. W., III , & Patrick, C. J. (2014). Neural correlates of preparatory and regulatory control over positive and negative emotion. Social Cognitive and Affective Neuroscience, 9(4), 494–504. 10.1093/scan/nst115 [DOI] [PMC free article] [PubMed] [Google Scholar]
- Sheline, Y. I. , Price, J. L. , Yan, Z. , & Mintun, M. A. (2010). Resting‐state functional MRI in depression unmasks increased connectivity between networks via the dorsal nexus. Proceedings of the National Academy of Sciences, 107(24), 11020–11025. 10.1073/pnas.1000446107 [DOI] [PMC free article] [PubMed] [Google Scholar]
- Sladky, R. , Höflich, A. , Küblböck, M. , Kraus, C. , Baldinger, P. , Moser, E. , … Windischberger, C. (2015). Disrupted effective connectivity between the amygdala and orbitofrontal cortex in social anxiety disorder during emotion discrimination revealed by dynamic causal modeling for fMRI. Cerebral Cortex, 25(4), 895–903. 10.1093/cercor/bht279 [DOI] [PMC free article] [PubMed] [Google Scholar]
- Smyser, C. D. , Inder, T. E. , Shimony, J. S. , Hill, J. E. , Degnan, A. J. , Snyder, A. Z. , & Neil, J. J. (2010). Longitudinal analysis of neural network development in preterm infants. Cerebral Cortex, 20(12), 2852–2862. 10.1093/cercor/bhq035 [DOI] [PMC free article] [PubMed] [Google Scholar]
- Sonmez, A. I. , Camsari, D. D. , Nandakumar, A. L. , Voort, J. L. V. , Kung, S. , Lewis, C. P. , & Croarkin, P. E. (2019). Accelerated TMS for depression: A systematic review and meta‐analysis. Psychiatry Research, 273, 770–781. 10.1016/j.psychres.2018.12.041 [DOI] [PMC free article] [PubMed] [Google Scholar]
- Stange, J. P. , Jenkins, L. M. , Hamlat, E. J. , Bessette, K. L. , DelDonno, S. , Kling, L. R. , … Langenecker, S. A. (2017). Disrupted engagement of networks supporting hot and cold cognition in remitted major depressive disorder. Journal of Affective Disorders, 227, 183–191. 10.1016/j.jad.2017.10.018 [DOI] [PMC free article] [PubMed] [Google Scholar]
- Surguladze, S. , Brammer, M. J. , Keedwell, P. , Giampietro, V. , Young, A. W. , Travis, M. J. , … Phillips, M. L. (2005). A differential pattern of neural response toward sad versus happy facial expressions in major depressive disorder. Biological Psychiatry, 57(3), 201–209. 10.1016/j.biopsych.2004.10.028 [DOI] [PubMed] [Google Scholar]
- Van Rheenen, T. E. , & Rossell, S. L. (2014). Multimodal emotion integration in bipolar disorder: An investigation of involuntary cross‐modal influences between facial and prosodic channels. Journal of the International Neuropsychological Society, 20(5), 525–533. 10.1017/S1355617714000253 [DOI] [PubMed] [Google Scholar]
- Versace, A. , Almeida, J. R. C. , Hassel, S. , Walsh, N. D. , Novelli, M. , Klein, C. R. , … Phillips, M. L. (2008). Elevated left and reduced right orbitomedial prefrontal fractional anisotropy in adults with bipolar disorder revealed by tract‐based spatial statistics. Archives of General Psychiatry, 65(9), 1041–1052. 10.1001/archpsyc.65.9.1041 [DOI] [PMC free article] [PubMed] [Google Scholar]
- Woody, M. L. , & Gibb, B. E. (2015). Integrating NIMH research domain criteria (RDoC) into depression research. Current Opinion in Psychology, 4(1), 6–12. 10.1016/j.copsyc.2015.01.004 [DOI] [PMC free article] [PubMed] [Google Scholar]
- Yang, T. T. , Simmons, A. N. , Matthews, S. C. , Tapert, S. F. , Frank, G. K. , Max, J. E. , … Paulus, M. P. (2010). Adolescents with major depression demonstrate increased amygdala activation. Journal of the American Academy of Child & Adolescent Psychiatry, 49(1), 42–51. 10.1016/j.jaac.2009.09.004 [DOI] [PMC free article] [PubMed] [Google Scholar]
- Yang, X. , Garcia, K. M. , Jung, Y. , Whitlow, C. T. , McRae, K. , & Waugh, C. E. (2018). vmPFC activation during a stressor predicts positive emotions during stress recovery. Social Cognitive and Affective Neuroscience, 13(3), 256–268. 10.1093/scan/nsy012 [DOI] [PMC free article] [PubMed] [Google Scholar]
- Yoshimura, S. , Okamoto, Y. , Onoda, K. , Matsunaga, M. , Ueda, K. , Suzuki, S. , & Shigetoyamawaki. (2010). Rostral anterior cingulate cortex activity mediates the relationship between the depressive symptoms and the medial prefrontal cortex activity. Journal of Affective Disorders, 122(1‐2), 76–85. 10.1016/j.jad.2009.06.017 [DOI] [PubMed] [Google Scholar]
- Yuan, C. , Zhu, H. , Ren, Z. , Yuan, M. , Gao, M. , Zhang, Y. , … Zhang, W. (2018). Precuneus‐related regional and network functional deficits in social anxiety disorder: A resting‐state functional MRI study. Comprehensive Psychiatry, 82, 22–29. 10.1016/j.comppsych.2017.12.002 [DOI] [PubMed] [Google Scholar]
- Zamoscik, V. , Huffziger, S. , Ebner‐Priemer, U. , Kuehner, C. , & Kirsch, P. (2014). Increased involvement of the parahippocampal gyri in a sad mood predicts future depressive symptoms. Social Cognitive and Affective Neuroscience, 9(12), 2034–2040. 10.1093/scan/nsu006 [DOI] [PMC free article] [PubMed] [Google Scholar]
Associated Data
This section collects any data citations, data availability statements, or supplementary materials included in this article.
Supplementary Materials
Data S1: Supporting Information
Data Availability Statement
The data that support the findings of this study are available from the corresponding author upon reasonable request. The analysis scripts used for supporting the main findings of the article are publicly available at Github (https://github.com/LiyuanLly/fMRI‐task‐activation‐) and (https://github.com/LiyuanLly/fMRI‐task‐PPI).