

Abstract
Opioid receptors are expressed throughout the brain and play a major role in regulating striatal dopamine (DA) release. Clinical studies have shown that naloxone (NAL, a nonspecific opioid antagonist) in individuals with opioid use disorder and morphine (MRP, a nonspecific opioid agonist) in healthy controls, resulted in DA release in the dorsal and ventral striatum, respectively. It is not known whether the underlying patterns of striatal DA release are associated with the striatal distribution of opioid receptors. We leveraged previously published PET datasets (collected in independent cohorts) to study the brain‐wide distribution of opioid receptors and to compare striatal opioid receptor availability with striatal DA release patterns. We identified three major gray matter segments based on availability maps of DA and opioid receptors: striatum, and primary and secondary opioid segments with high and intermediate opioid receptor availability, respectively. Patterns of DA release induced by NAL and MRP were inversely associated and correlated with kappa (NAL: r(68) = −0.81, MRP: r(68) = 0.54), and mu (NAL: r(68) = −0.62, MRP: r(68) = 0.46) opioid receptor availability. Kappa opioid receptor availability accounted for a unique part of variance in NAL‐ and MRP‐DA release patterns (ΔR 2 >0.14, p <.0001). In sum, distributions of opioid receptors distinguished major cortical and subcortical regions. Patterns of NAL‐ and MRP‐induced DA release had inverse associations with striatal opioid receptor availability. Our approach provides a pattern‐based characterization of drug‐induced DA targets and is relevant for modeling the role of opioid receptors in modulating striatal DA release.
Keywords: dopamine, k‐means, morphine, naloxone, opioid receptors, positron emission tomography (PET), striatum
We characterized the brain‐wide distribution of opioid receptors and, within the striatum, studied their association with drug‐induced dopamine release patterns. There was highest opioid receptor availability in a brain primary opioid segment including frontal, temporal, limbic, thalamic, cerebellar vermis, and periaqueductal gray regions. Patterns of dopamine release induced by naloxone and morphine were inversely related and were both associated with mu and uniquely with kappa opioid receptor availability. The data revealed major brain opioid segments and showed that striatal DA release patterns were related to the pharmacology of opioid drugs.

1. INTRODUCTION
Mu (MOR), kappa (KOR), and delta (DOR) opioid receptors are expressed throughout the brain and body and interact with several neurotransmitter systems (Maurer, Cortes, Probst, & Palacios, 1983). Consequently, opioid use disorder (OUD) has been associated with severe psychological and physical impairments (Pergolizzi Jr, Raffa, & Rosenblatt, 2020). Characterizing the relative distribution of opioid receptors throughout the brain is important for identifying vulnerable brain systems to OUD. In particular, opioid receptors have a major modulatory effect on the dopamine (DA) system, a main component of the brain reward circuitry (Kosten & George, 2002). While MOR and DOR inhibit GABAergic inhibition of midbrain DA neurons (Johnson & North, 1992), KOR could directly inhibit DA neurons (Margolis, Hjelmstad, Bonci, & Fields, 2003; Peckys & Landwehrmeyer, 1999). KOR and DOR (but not MOR) are also expressed on presynaptic DA terminals in the striatum (Svingos, Chavkin, Colago, & Pickel, 2001; Svingos, Clarke, & Pickel, 1999; Trovero, Herve, Desban, Glowinski, & Tassin, 1990), where KOR, in particular, inhibits stimulated DA release (Britt & McGehee, 2008; Mulder, Wardeh, Hogenboom, & Frankhuyzen, 1984; Werling, Frattali, Portoghese, Takemori, & Cox, 1988).
Opioid‐sensitive mechanisms of DA regulation contribute to the emergence of different patterns of striatal DA release in different psychopharmacological conditions. Characterizing striatal DA release patterns is relevant for delineating the functionally diverse striatal projections that are modulated by DA release (Gerfen & Surmeier, 2011). In humans, opioid withdrawal precipitated by nonselective opioid antagonist naloxone (NAL, see Section 2) (G.‐J. Wang et al., 1997) resulted in DA increases in the dorsal striatum of participants with OUD (Shokri‐Kojori, Wang, & Volkow, 2021). In contrast, the nonselective opioid agonist morphine (MRP, see Section 2) resulted in DA release primarily in the ventral striatum of healthy controls (Spagnolo et al., 2019). It is not known whether the patterns of striatal DA release induced by NAL and MRP are related to the distribution of opioid receptors in the striatum and whether such patterns of DA release are different from those induced by drugs that do not directly interact with opioid receptors (such as methylphenidate, MPH, a DA transporter blocker).
Here we characterized the brain‐wide distribution of opioid and DA receptors using previously published datasets that measured MOR (Kuwabara et al., 2014), KOR (Naganawa et al., 2014), DOR (Weerts et al., 2011), and D2/3R (Spagnolo et al., 2019) availability in independent cohorts of healthy controls. We also compared drug‐induced patterns of DA release to the distribution of MOR, KOR, and DOR across striatal sub‐partitions. For this purpose, we used [11C]raclopride‐PET datasets where we had assessed DA release induced by NAL precipitated withdrawal in OUD men (Shokri‐Kojori et al., 2021; G.‐J. Wang et al., 1997), by MRP in healthy men (Spagnolo et al., 2019), and by MPH in healthy controls (Volkow et al., 2014), which we used here as a nonopioid control pharmacological condition. Considering the opposite effects of NAL and MRP on opioid receptors, we predicted that the striatal DA release pattern induced by NAL would be negatively associated with that induced by MRP in healthy controls and not associated with that induced by MPH. Finally, the direct effect of KOR on striatal DA terminals (Britt & McGehee, 2008; Spanagel, Herz, & Shippenberg, 1992) would lead to unique associations between striatal KOR distribution and the patterns of striatal DA release induced by NAL and MRP.
2. MATERIALS AND METHODS
2.1. Participants
This study entailed a retrospective analysis of six independent PET brain imaging datasets (a total of 118 PET scans) that were collected on 74 participants (10 OUD and 64 healthy controls) at various institutions. Three of the datasets were collected with [11C]raclopride to measure DA changes under three pharmacological interventions: naloxone (NAL) in OUD participants (G.‐J. Wang et al., 1997), morphine (MRP) in healthy controls (Spagnolo et al., 2019), and MPH in healthy controls (Volkow et al., 2014). Three additional datasets measured availability of opioid receptor subtypes in healthy controls: [11C]carfentanil‐PET to measure MOR (Kuwabara et al., 2014), [11C]‐LY2795050‐PET to measure KOR (Naganawa et al., 2014), and [11C]methylnaltrindole‐PET to measure DOR (Weerts et al., 2011). All participants provided written informed consent approved by the respective institutional review board where the data were originally collected.
The OUD cohort (n = 10, 10 males, age = 40.8 ± 4.3 years) was studied at Brookhaven National Laboratory. OUD participants met DSM‐IV criteria for opioid dependence and had at least one‐year history of continued opioid use (heroin or methadone treated). Some OUD participants were current marijuana users (n = 7), current smokers (n = 8), current (n = 2) or past (n = 1) amphetamine users, current (n = 4) or past (n = 3) cocaine users, and past LSD users (n = 2). The MRP cohort included healthy controls (n = 10, 10 males, age = 28.0 ± 8.1 years) who were studied during MRP exposure at the National Institutes of Health Clinical Center. The MPH cohort included healthy controls (n = 24, 12 males, age = 28.2 ± 6 years) who were studied during MPH exposure at Brookhaven National Laboratory. The MOR cohort included healthy controls (n = 10, 6 males, age = 34.3 ± 10.7 years) who underwent MOR imaging at the Johns Hopkins University School of Medicine. The KOR cohort included healthy controls (n = 10, 10 males, age = 28.7 ± 7.4 years) who underwent KOR imaging at Yale University School of Medicine. The DOR cohort included healthy controls (n = 10, 9 males, age = 31.8 ± 7.8 years) who underwent DOR imaging at the Johns Hopkins University School of Medicine (see Table 1 for a summary of cohorts).
TABLE 1.
Summary of the datasets included in this study
| Imaging target | Radiotracer | Scan condition(s) | Cohort | Number of participants (males) |
|---|---|---|---|---|
| D2/3R | [11C]raclopride | SAL and NAL | OUD | 10 (10) |
| D2/3R | [11C]raclopride | SAL and MRP | MRP | 10 (10) |
| D2/3R | [11C]raclopride | SAL and MPH | MPH | 24 (12) |
| MOR | [11C]carfentanil | Baseline | MOR | 10 (6) |
| KOR | [11C]LY2795050 | Baseline | KOR | 10 (10) |
| DOR | [11C]methylnaltrindole | Baseline | DOR | 10 (9) |
Note: Except for the OUD cohort, other cohorts were healthy controls.
2.2. PET imaging and modeling
The OUD cohort underwent two dynamic [11C]raclopride‐PET imaging sessions (CTI‐Siemens ECAT 931, ~6 mm FWHM) that were performed consecutively on the same day, except for two participants who were not scanned on the same day. The first scan with [11C]raclopride started 5–7 min following administration of intravenous (IV) saline (SAL). After about 2 hr, the second scan with [11C]raclopride started following IV NAL administration that was given every 4 min in 0.01 mg/kg increments, until withdrawal symptoms appeared (G.‐J. Wang et al., 1997). A total of 0.02 mg/kg of NAL was administered to OUD participants. Two participants received 0.01 mg/kg NAL and were scanned on a different day. The MRP cohort underwent two [11C]raclopride‐PET imaging sessions (GE Advance, ~5 mm FWHM) on two separate days, one following administration of IV MRP (10 mg/70 kg) and the other following administration of IV SAL (10 mg/70 kg), which were administrated 5 min prior to injection of [11C]raclopride. SAL and MRP days were randomized (Spagnolo et al., 2019). The MPH cohort underwent two [11C]raclopride‐PET imaging sessions (Siemens HR+, ~4.5 mm FWHM) on two separate days, one following the administration of IV MPH (0.5 mg/kg) and the other following administration of IV SAL (3 ml), which were given 5 min prior to injection of [11C]raclopride. SAL and MPH days were randomized (Volkow et al., 2014).
Both sessions for each participant with [11C]raclopride‐PET data were co‐registered and corrected for framewise motion. To estimate D2/3R availability in OUD, MRP, and MPH cohorts, dynamic [11C]raclopride‐PET data were modeled in PMOD 3.9 (PMOD Technologies Ltd, Zurich, Switzerland). Voxelwise estimates of binding potential (BPnd) and R1 (R1 = K1/K′1) were calculated using simplified reference tissue model 2 (SRTM2; Wu & Carson, 2002) with a cerebellar reference region. R1 was used as a proxy of relative cerebral blood flow (rCBF) that is in agreement with rCBF measures obtained by [15O]H2O‐PET (Bilgel et al., 2020; Chen et al., 2015; Meyer et al., 2011) and has high reliability when estimated with [11C]raclopride‐PET data (Stokes et al., 2010).
The MOR cohort underwent dynamic [11C]carfentanil‐PET (Siemens HRRT, ~2.5 mm FWHM) (Kuwabara et al., 2014). MOR availability was estimated using the noninvasive graphical analysis (Logan et al., 1996) with an occipital reference region to estimate BPnd with k2 R (brain‐to‐blood efflux rate constant of occipital cortex) set at 0.104 min−1 (Endres, Bencherif, Hilton, Madar, & Frost, 2003). The KOR cohort underwent dynamic [11C]LY2795050‐PET (Siemens HRRT, ~2.5 mm FWHM) and (metabolite‐corrected) arterial input function sampling (Naganawa et al., 2014). KOR availability was estimated by applying likelihood estimation in graphical analysis (LEGA) (Ogden, 2003). Specifically, LEGA volume of distribution was calculated using the basis function method and gamma value of −100 min to −10 min that was determined based on time‐activity curve analysis. Subsequently, BPnd was calculated using a population nondisplaceable distribution volume value of 1.61 ml/cm3. The DOR cohort underwent dynamic [11C]methylnaltrindole‐PET (GE Advance, ~5 mm FWHM; Weerts et al., 2011). DOR availability was estimated using the noninvasive graphical analysis graphical analysis (Logan et al., 1996) with a corpus callosum reference region and t* set at 10 min and k2 R set at 0.035 min−1. All PET images were normalized to MNI space and were resampled to 2‐mm isotropic voxels using FSL (the FMRIB Software Library; Jenkinson, Beckmann, Behrens, Woolrich, & Smith, 2012) and AFNI (Cox, 1996) routines.
2.3. DA release and rCBF change
To estimate drug‐induced DA release, we subtracted D2/3R BPnd in the drug condition (i.e., NAL, MRP, and MPH) from that in the SAL condition and divided the result by D2/3R BPnd in the SAL condition (to normalize for regional differences in D2/3R). To estimate drug‐induced changes in rCBF, we subtracted R1 in the SAL condition from that in the drug condition and divided the result by R1 in the SAL condition (to normalize for regional differences in R1).
2.4. NAL and MRP binding affinities
NAL and MRP are nonspecific opioid antagonist and agonist, respectively. Their binding affinities for different opioid receptors depend on experimental conditions. For NAL K i: MOR = 7 ± 1 nM, DOR = 8 ± 1 nM, KOR = 4 ± 1 nM has been reported (D. Wang, Sun, & Sadee, 2007) whereas for MRP K i: MOR = 6.4 ± 0.72 nM, DOR = 112 ± 28 nM, KOR = 52 ± 1.0 nM has been reported (Schmid et al., 2017).
2.5. Regions of interest
A priori ventral tegmental area (VTA; Edlow et al., 2012) and substantia nigra pars compacta (SNc; Y. Zhang, Larcher, Misic, & Dagher, 2017) masks were used to study opioid receptor availability in these regions. Habenula was defined based on previously reported MNI coordinates (Lawson, Drevets, & Roiser, 2013). The pituitary region of interest (ROI) was defined as described previously (Shokri‐Kojori et al., 2021). Additional subcortical regions were defined using the Harvard‐Oxford atlas (probability threshold >50%; Desikan et al., 2006) and ascending autonomic network atlas (Edlow et al., 2012).
2.6. k‐means clustering
For classifying brain regions based on the regional distributions of the four receptors of interest: MOR (MOR cohort, n = 10), KOR (KOR cohort, n = 10), DOR (DOR cohort, n = 10), and D2/3R (MRP cohort, n = 10), k‐means clustering (Lloyd, 1982) was performed in MATLAB (The MathWorks, Natick, MA) on the z‐score (mean–variance normalized) of between‐subject average of receptor availability maps. No additional smoothing was applied to the BPnd maps prior to k‐means clustering. We used the Calinski–Harabasz clustering evaluation criterion (Caliński and Harabasz, 1974) and identified k = 4 to be a reasonable number of clusters for our data (see Figure S1). Next, k centroids with l dimensions (l = 4, number of receptors) were randomly selected. Each of the n observations (n = number of brain voxels) was assigned to the closest centroid. The algorithm iteratively updates the centroids' location so that within‐cluster distances to the centroid decreases at each iteration. An updated cluster centroid was computed by averaging the observations in each cluster. This process continued until the maximum number of specified iterations (i = 1,000,000) or when there was no change in the clusters. k‐means was repeated 100 times (using the “Replicates” option) and a solution was chosen that had the lowest within cluster sum of point‐to‐centroid distances. Identical segmentation results were obtained after repeating the entire process. Finally, we repeated the k‐means clustering but instead of the [11C]raclopride‐PET template, we used estimates of D2/3R availability obtained from a [18F]fallypride‐PET template (Castrellon et al., 2019). This was done to ensure that the segmentation results are not affected by differences in presentation of striatal and extra‐striatal D2/3R availability with these two radiotracers (Karalija et al., 2020; Svensson et al., 2019).
2.7. Striatal sub‐partitions
The striatal segment obtained from k‐means clustering was partitioned into 6‐mm isotropic cubes. The dimensions were selected based on the lowest resolution of the PET cameras across the various datasets included in this study. In order to reduce the partial volume effect, only sub‐partitions (i.e., 6‐mm isotropic cubes) that completely fell within the striatal mask were included (n = 70). To extract the pattern of DA‐release and striatal distribution of opioid receptors, each measurement was averaged across voxels within each cubic sub‐partition and then averaged across participants.
3. RESULTS
3.1. Brain opioid segments
Whole brain was segmented based on the regional differences in MOR, KOR, DOR, and D2/3R availability measured in independent cohorts of healthy participants (Table 1, Figure 1a–d, see Section 2). We identified four reproducible segments (Figure 1e,f). One segment corresponded to the entire striatum (Figure 1f, red) with primarily high D2/3R availability. Next, a primary opioid segment was identified (Table S1) with high availability of opioid receptors, including frontal, temporal, insular, cingulate, amygdala, thalamic, inferior cerebellar vermis, and periaqueductal gray regions (Figure 1f, blue). Another segment was labeled as a secondary opioid segment with intermediate availability of opioid receptors and included the reminder of gray matter regions, including sensorimotor cortices, visual regions, and large parts of the brainstem (Figure 1f, green). The last segment corresponded to white matter and CSF with insignificant opioid and DA receptor availability (Figure 1f, gray). The primary and secondary opioid segments showed that opioid receptors were expressed throughout the brain gray matter. Our segmentation results were not affected when we replaced the [11C]raclopride‐PET template with a [18F]fallypride‐PET template (Castrellon et al., 2019) to measure brain D2/3R availability (Figure S2). It was notable that opioid receptors had high variability in the striatal segment (Figure 1e). In the midbrain, the SNc had higher KOR than VTA, whereas the VTA had higher MOR than SNc (p <.05, Figure 2). See Figure 2 for average BPnd of MOR, KOR, and DOR in subcortical, brainstem, and pituitary regions.
FIGURE 1.
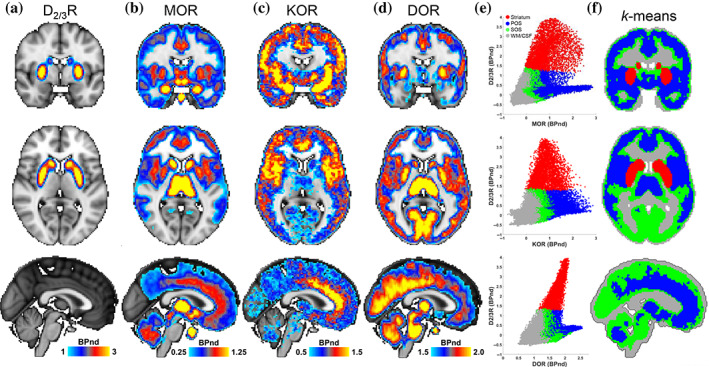
Brain segmentation based on the distributions of DA and opioid receptors. (a–d) Coronal, (y = −2 mm), axial (z = 6 mm), and sagittal (x = 0) views of average D2/3R, MOR, KOR, and DOR availability maps. (e) Scatterplots of opioid receptor availability across brain voxels in the four major segments identified by k‐means clustering. Red: striatum, blue: primary opioid segment (POS), green: secondary opioid segment (SOS), and gray: white matter (WM) and CSF. (f) The k‐means clusters shown on the brain
FIGURE 2.
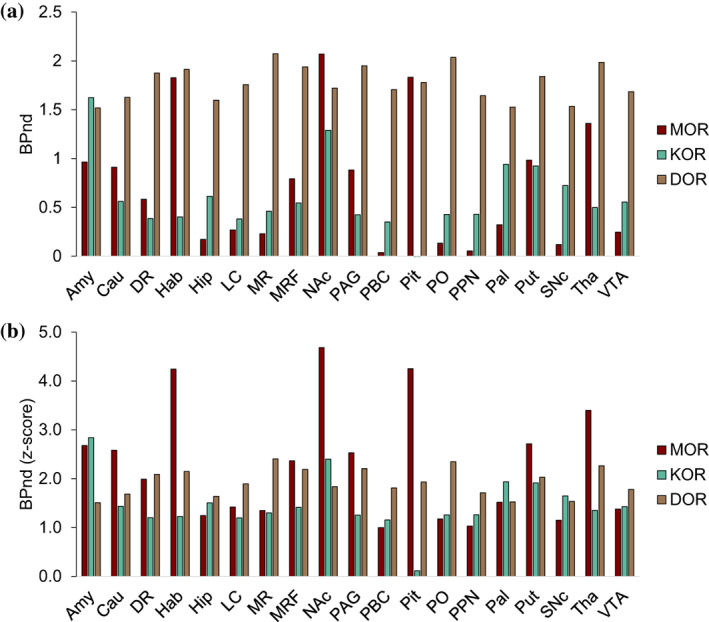
Mu (MOR), kappa (KOR), and delta (DOR) opioid receptor availability in subcortical, brainstem, and pituitary regions. (a) Average binding potential (BPnd) for MOR, KOR, and DOR (see Section 2). MOR BPnd was higher in VTA (M = 0.25, SD = 0.24) than SNc (M = 0.12, SD = 0.175) (t(9) = 4.36, p = .002). KOR BPnd was higher in SNc (M = 0.72, SD = 0.18) than VTA (M = 0.56, SD = 0.30) (t(9) = 2.28, p = .049). KOR BPnd in the pituitary was insignificant. (b) The z‐scores of BPnd values shown in (a) calculated with whole‐brain mean–variance normalization. It should be noted that for each opioid receptor, BPnd values were estimated using a different modeling technique and in a different cohort, thus differences in BPnd values between different opioid receptors should be interpreted with caution. Amy, amygdala; Cau, caudate; DR, dorsal raphé; Hab, habenula; Hip, hippocampus; LC, locus coeruleus; MR, median raphé; MRF, midbrain reticular formation; NAc, nucleus accumbens; PAG, periaqueductal gray; PBC, parabrachial complex; PO, pontis oralis; PPN, pendunculopontine nucleus; Pal, pallidum; Pit, pituitary; Put, putamen; SNc; substantia nigra pars compacta; Tha, thalamus; VTA, ventral tegmental area. See Section 2 for ROI definitions. MOR is shown in “maroon,” KOR in “keppel,” and DOR in “dirt” colors
3.2. Striatal distribution of opioid receptors
The striatal mask was partitioned into 6‐mm isotropic cubes (n = 70) that was consistent with the lowest PET camera resolution across the datasets (see Section 2). Regional differences in MOR, KOR, DOR, and D2/3R availability between striatal sub‐partitions had excellent inter‐subject reliability (Figure S3). Figure S4a–c shows the association between MOR and KOR patterns (r(68) = 0.79, p <.0001), KOR and DOR patterns (r(68) = 0.30, p = .01), and the nonsignificant association between MOR and DOR (r(68) = 0.09, p = 0.47).
3.3. Striatal patterns of DA release
We studied the associations between DA‐release patterns and MOR, KOR, and DOR availability across striatal sub‐partitions (Figure 3a,d). The NAL‐DA release pattern (Figure 3b,e) was negatively associated with KOR (r(68) = −0.81, p <.0001, Figure 4a), MOR (r(68) = −0.62, p <.0001, Figure S5a), and DOR availability (r(68) = −0.29, p = .015), but not with baseline D2/3R availability (r(68) = 0.11, p = .34). After controlling for availability of other opioid receptors, striatal KOR availability remained significantly associated with the striatal pattern of NAL‐DA release (F (1,66) = 39.72, p <.0001, Figure 4b). Across striatal sub‐partitions, NAL‐DA release and NAL‐rCBF change were associated (r(68) = 0.53, p <.0001, Figures 3c,f and S4d‐f). In contrast to NAL‐DA release in OUD participants, which occurred predominantly in the dorsal striatum, MRP‐DA release was predominantly ventral. MPH‐DA release pattern, which we used as a control experiment, was highest in the lateral striatal regions (Figure 3e). As expected, NAL‐DA release was negatively associated with MRP‐DA release (r(68) = −0.64, p <.0001, Figure 4a), but not with MPH‐DA release across striatal sub‐partitions (r(68) = 0.23, p = .056, Figure S6a,b). Patterns of MRP‐DA release and MRP‐rCBF change were not correlated (r(68) = 0.09, p = .44) but patterns of MPH‐DA release and MPH‐rCBF change were significantly correlated (r(68) = 0.33, p = .005; Figure 3c,f, Figure S4). Across striatal sub‐partitions, MRP‐DA release was positively associated with MOR (r(68) = 0.46, p <.0001, Figure S5b) and KOR (r(68) = 0.54, p <.0001, Figure 4a) but not DOR availability (r(68) = 0.12, p = .31). After controlling for availability of other opioid receptors, striatal KOR availability remained significantly associated with the striatal pattern of MRP‐DA release (F (1,66) = 15.14, p <.00025, Figure 4b).
FIGURE 3.
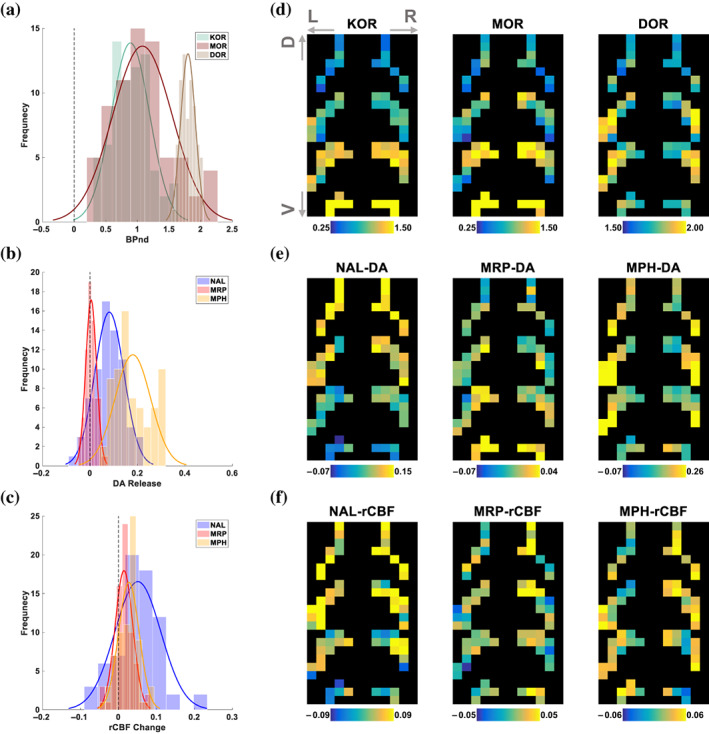
Striatal distribution of opioid receptors compared to the patterns of DA release and change in rCBF. (a) Histograms of BPnd for kappa (KOR), mu (MOR), and delta (DOR) opioid receptors (frequency refers to the number of striatal sub‐partitions). (b) Striatal DA release with naloxone (NAL), morphine (MOR), and methylphenidate (MPH). (c) Change in relative cerebral blood flow (rCBF) induced by NAL, MRP, and MPH in the striatum derived from changes in R1 (see Methods). (d–f) 2D representation of striatal‐sub partitions for the data shown in a–c, respectively. Specifically, the most ventral striatal sub‐partitions (6‐mm cubes) were placed at the bottom rows of each 2D map while preserving their placement along the sagittal and coronal axes. Next, striatal sub‐partitions that were immediately dorsal to these sub‐partitions were placed in the 2D map in the same manner, just above the lastly placed sub‐partitions. This procedure was repeated until all striatal sub‐partitions were placed in the 2D map. Bottom to top rows generally correspond to ventral (V) to dorsal (D) axis of the striatum, respectively. The dark background was added to improve visibility
FIGURE 4.
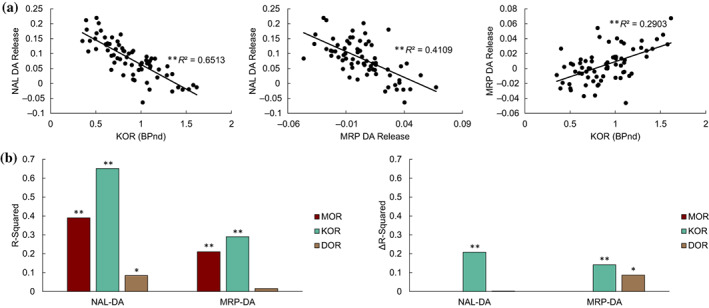
Associations between striatal DA‐release patterns and opioid receptor availability. (a) Linear associations between KOR and NAL‐ and MRP‐induced DA release. Each data point represents the average measure across participants in one of the 70 striatal sub‐partitions shown in Figure 3d–f. These spatial correlations are between separate groups of subjects (see Section 2). (b) Left: R‐squared values of the linear correlations between opioid receptor distributions and NAL‐ and MRP‐induced DA release patterns. Right: Difference in R‐squared values of full model (including all opioid receptors) and the reduced model (removing the opioid receptor of interest) in explaining variability in DA‐release across striatal sub‐partitions. Significance was calculated by partial F‐tests (*p <.02, **p <.00025)
4. DISCUSSION
Here we characterized the brain‐wide distribution of opioid receptors and compared the striatal patterns of DA release induced by NAL and MRP to striatal opioid receptor availability. While opioid receptors had notable expression throughout the brain gray matter, we identified a primary opioid segment with a relatively higher expression of opioid receptors (Figure 1f), including frontal, temporal, limbic, cerebellar, thalamic, and periaqueductal gray regions (Table S1). Regions within the primary opioid segment are expected to be more sensitive to opioid drugs or endogenous opioid signaling and have been implicated in structural and functional impairments in OUD (Lyoo et al., 2006; Upadhyay et al., 2010; Wollman et al., 2017). Across striatal sub‐partitions, the inverse patterns of DA release induced by NAL (in OUD) and MRP (in healthy controls) were associated with MOR and uniquely with KOR availability.
4.1. Drug‐induced patterns of DA release
We identified marked differences in the patterns of striatal DA release induced by different drug challenges, which appeared to be consistent with different molecular targets of each drug. These patterns could inform relevant cortical and subcortical regions that would be modulated by striatal DA‐release (N. Li & Jasanoff, 2020; Tziortzi et al., 2014). The inversely associated patterns of striatal DA release with NAL (an opioid antagonist) in OUD and MRP (an opioid agonist) in healthy controls highlighted an opioid‐modulated axis of DA release in the striatum. While these effects were observed in different cohorts, they could be consistent with the opposite action of NAL and MRP on opioid‐related mechanisms of DA release in the midbrain and striatal DA terminals (Beier et al., 2015; Devine, Leone, Pocock, & Wise, 1993; Ford, Beckstead, & Williams, 2007; Y. Zhang et al., 2017). Yet, it is important to further characterize neuroadaptations in individuals who are physically dependent to opioids (such as OUD participants in this study) in enhanced sensitivity to NAL. NAL‐DA release and MRP‐DA release patterns were not associated with the pattern of MPH‐DA release, which was expected considering that MPH primarily enhance striatal DA signaling by blocking DA transporters (Volkow et al., 2001). In particular, MPH‐DA release was higher in the lateral striatum (Figure 3e) which was consistent with the mediolateral gradient of striatal DA transports that have higher densities in the putamen (Sasaki et al., 2012).
4.2. Opioid receptors in SNc and VTA
DA neurons in SNc and VTA mainly project to the dorsal and ventral striatum, respectively, and utilize similar inhibitory and excitatory mechanisms of DA regulation. SNc and VTA receive KOR signaling at DA somatodendritic sites in mice (Ford et al., 2007), whereas KOR signaling in rat VTA appear to predominantly affect DA neurons projecting to the frontal cortex (Devine et al., 1993; Margolis & Karkhanis, 2019). SNc and VTA include MOR expressing GABAergic interneurons (Bontempi & Sharp, 1997) and receive inputs from MOR expressing GABAergic interneurons in the rostromedial tegmentum (RMTg; Matsui & Williams, 2011) in rats. DA neurons in SNc and VTA respond differently to opioids and their withdrawal (Nazzaro, Seeger, & Gardner, 1981), suggesting that they receive different contributions from opioid‐sensitive mechanisms of DA regulation (Xiao et al., 2016). SNc had 30% higher KOR availability than VTA (Figure 2), though in mice VTA exhibits stronger KOR‐mediated inhibitory currents than SNc (Ford et al., 2007). MOR availability in VTA was 100% higher than SNc, which is consistent with higher GABAergic interneurons in this structure (Margolis, Toy, Himmels, Morales, & Fields, 2012). Considering the higher MOR expression in VTA, MRP could have more effectively removed the GABAergic inhibition in the VTA than SNc, leading to ventral striatal DA release. In contrast, MOR blockade by NAL in SNc could have had less inhibitory effects, leading to relative increases in DA release in the dorsal striatum during precipitated withdrawal (Shokri‐Kojori et al., 2021). Chronic opioid exposure could upregulate KOR (X.‐Y. Li et al., 2010; Suzuki, Chuang, Chuang, Doi, & Chuang, 2001) and downregulate MOR (Tempel, Habas, Paredes, & Barr, 1988; Turchan et al., 1999; Zadina, Chang, Ge, & Kastin, 1993), which may have contributed to dorsal striatal NAL‐DA release in OUD.
4.3. Striatal opioid receptors and DA release patterns
To characterize the striatal patterns of NAL‐ and MRP‐DA release, we compared them with the distribution of opioid receptors in the striatum. Both MOR and KOR availability showed an overall increase from dorsal to ventral striatum, though MOR availability was higher in the medial than lateral regions (Figure 3d). Electron microscopy in rodents have suggested that striatal KOR expression is predominantly presynaptic (Meshul & McGinty, 2000), where KOR directly affect DA release (Britt & McGehee, 2008; Clark & Abi‐Dargham, 2019; Werling et al., 1988; Yamada et al., 2006). In contrast, striatal MOR (a main contributor to opioid reward and locomotor effects) is predominantly expressed on GABAergic neurons and interneurons which, among other functions, may indirectly affect DA release (Charbogne et al., 2017; Cui et al., 2014; Gómez‐A et al., 2019). KOR availability accounted for a unique part of variance in striatal patterns of NAL‐ and MRP‐DA release (Figure 4b) which could be consistent with its direct effect on DA terminals whereas striatal MOR availability (measured with PET) may reflect contributions from multiple MOR functions. Yet, the direction of associations with KOR seemed paradoxical and appeared to suggest that systemic NAL antagonism and MRP agonism of KOR were less effective in striatal regions with more KOR density (e.g., ventral striatum). However, given the correlational nature of our analyses, the observed associations do not show the direct action of opioid receptors and could not be used to make any causal inferences. Indeed, the data revealed that striatal KOR is particularly distributed in a manner that resembles the MRP‐DA release pattern and is opposite to the NAL‐DA release pattern. This distribution could be by design and may indicate that striatal KOR may have a dampening role on DA release, such that it counters the effect of midbrain‐initiated DA release in either condition (i.e., NAL and MRP). An analogy to this effect would be that a heavier automobile wheel requires a larger brake pad when compared to a lighter wheel. Similarly, more KOR is expressed in striatal regions where there is more MRP‐induced DA release and less NAL‐induced DA release. A better understanding of these effects, however, calls for experimental and computational modeling of DA release that in a dose‐dependent manner assesses the effects of opioid agonism and antagonism on the midbrain DA neurons and their striatal terminals at the same time.
4.4. DA release in dorsal and ventral striatum
Striatal DA release and its consequences are dependent on the context and are important for processing stimuli salience (Howes & Nour, 2016; Matsumoto, Tian, Uchida, & Watabe‐Uchida, 2016). Patterns of striatal DA release are relevant for delineating local and global effects of DA release on the brain in different psychopharmacological states. The dorsal striatum predominantly projects to executive and motor‐related regions whereas the ventral striatum predominantly projects to limbic and reward‐related regions (Tziortzi et al., 2014). Thus, it is expected that distinct cortical and subcortical regions would be affected by DA release in response to NAL and MRP. Other human studies on the effects of opioid agonists showed a blunted striatal DA response to opioids in OUD (Daglish et al., 2008), but a decrease in cortical and dorsal striatal DA when given a MOR‐specific agonist (alfentanil) in healthy men (Hagelberg et al., 2002; Hagelberg et al., 2004). Notably, we found that MRP increased ventral striatal DA release (Figure 3e). Together, these observations suggest that opioid agonists result in relative decreases in DA release along a ventral‐to‐dorsal axis, with ventral striatum showing relatively more DA release compared to the dorsal striatum. Traditionally, studies with pharmacological and psychological interventions have focused on striatal regions with maximal DA effect (Birn et al., 2019; Schott et al., 2008). Our approach complements these studies by showing that the overall pattern of drug‐induced striatal DA release is also meaningful (Figures 3 and 4). These patterns could be used to inform functional DA targets by quantifying the spatial gradients of DA release across striatal sub‐partitions, which could be used to model the cumulative effects of these sub‐partitions on modulating the function of striatal projections. Thus, our approach could provide a more complete picture of the DA‐related effects of drugs such as opioids in OUD and healthy individuals.
4.5. Additional considerations and limitations
The segmentation results were not affected by replacing the D2/3R availability map obtained by [11C]raclopride‐PET with that obtained by [18F]fallypride‐PET, which has stronger extra‐striatal signal (Figure S2). The similar segmentation outcomes reflect that both radiotracers have much higher binding in the striatum relative to the rest of the brain, which resulted in identifying only the entire striatum as the segment with distinctly high D2/3R availability. In our study, we only assessed the spatial correlation between striatal opioid receptor availability and striatal NAL‐ and MRP‐DA release patterns, thus we cannot ascertain any causal relationship. We also could not rule out the role of other neurotransmitter systems that receive opioid signaling and could affect striatal DA release patterns (Al‐Hasani et al., 2015; H. Zhang & Sulzer, 2012). Despite the small sample sizes, the striatal distributions of opioid receptors were highly reliable across healthy controls (Figure S3). Our study is limited in using striatal opioid receptor availability maps generated in healthy controls for characterizing the pattern of striatal NAL‐DA release in OUD participants. Yet, in vivo measurement of opioid receptor availability in OUD is challenging because their use of opioids or treatment medications (e.g., methadone, buprenorphine, or naltrexone) would block the binding of the PET ligand. Another limitation was differences in PET cameras across datasets. While different PET cameras could result in systematic differences in absolute quantification of tracer binding, it has been shown that the relative regional differences were highly preserved (van Velden et al., 2009). Our study was similarly focused on comparing the relative differences in tracer binding for opioid and DA receptors between striatal sub‐partitions that were defined based on the lowest PET camera resolution across the datasets. We did not assess NAL‐ and MRP‐DA release patterns in healthy controls and OUD, respectively. However, NAL does not result in an aversive response in opioid‐naïve participants (Rzasa Lynn & Galinkin, 2018) and opioid‐induced reward (due to tolerance) and striatal DA release are attenuated after chronic opioid exposure (Daglish et al., 2008; Madhavan, Bonci, & Whistler, 2010). The data used in the analysis of NAL and MRP DA release patterns were obtained in males, thus we could not assess sex differences in the modulation of striatal DA by opioid receptors. Finally, the significant interspecies differences in the distribution and function of opioid receptors could limit the generalizability of preclinical observations to human studies.
5. CONCLUSIONS
Here we identified a primary brain opioid segment in which there was relatively higher expression of major opioid receptors. This segment (including frontal, limbic, temporal, cerebellar, thalamic, and periaqueductal gray regions) could be more sensitive to endogenous opioid signaling and may be relevant for identifying brain regions with high vulnerability to OUD. We also studied the distribution of opioid receptors (measured with PET) within the striatum and found that MOR and KOR availability increased from dorsal to ventral striatum. MOR availability was also higher in the medial than lateral regions whereas DOR availability was highest in the lateral regions. We compared patterns of striatal DA release induced by NAL and MRP with striatal opioid receptor availability. Both DA release patters showed a unique association with KOR, were associated with MOR, but were not strongly associated with DOR. These effects show that MOR and KOR, are more expressed in striatal regions with higher opioid agonist induced DA release and are less expressed in striatal regions with higher NAL induced DA release. While it is expected that the combined effects of opioid receptors on midbrain DA neurons and their terminals contribute to the pattern of striatal DA release induced by NAL and MRP, our results suggest that striatal KOR is particularly distributed in a manner that its effect on DA terminals would counter midbrain‐initiated DA release induced by NAL and MRP. In contrast to traditional analyses, our approach provided a pattern‐based representation of drug‐induced striatal DA effects that were related to the pharmacology of opioid drugs and may be informative for delineating the role of opioid receptors in modulating DA release.
CONFLICT OF INTEREST
The authors declare no potential conflict of interest.
AUTHOR CONTRIBUTIONS
Ehsan Shokri‐Kojori and Nora D. Volkow designed the study and interpreted the data. Ehsan Shokri‐Kojori planned and performed the analyses. Ehsan Shokri‐Kojori wrote the manuscript with contribution and edits by Nora D. Volkow. Nora D. Volkow and Gene‐Jack Wang collected the data for the NAL and MPH experiments. Vijay A. Ramchandani contributed to data for the MRP experiment. Dean F. Wong contributed to the MOR and DOR datasets and interpretation. Mika Naganawa contributed to the KOR dataset and performed kinetic modeling for the [11C]‐LY2795050‐PET data. All authors commented on the manuscript.
Supporting information
Appendix S1: Supporting Information
ACKNOWLEDGMENT
The authors thank Hiroto Kuwabara for modeling the MOR and DOR data and Mary McCaul R01AA11855 (PI: McCaul) and Elise Weerts for providing the DOR data. The authors thank Henry Huang and Richard Carson for providing the KOR dataset. The authors thank Christopher Wong for assistance with behavioral and imaging data. The authors thank Hugo Tejeda, Sunny Kim, Min Guo, and Abolghasem Bakhoda for helpful discussions. The authors thank Ayon Nandi for assistance with PET data at JHU. The authors thank Primavera Spagnolo, Melanie Schwandt, Nancy Diazgranados, and Markus Heilig for MRP study support and Peter Herscovitch and Shielah Conant for assistance with PET data at the NIH. The authors thank members of Laboratory of Neuroimaging at the NIAAA for their support. This work was supported by National Institute on Alcohol Abuse and Alcoholism intramural research program (Grant Y1AA3009).
Shokri‐Kojori, E. , Naganawa, M. , Ramchandani, V. A. , Wong, D. F. , Wang, G.‐J. , & Volkow, N. D. (2022). Brain opioid segments and striatal patterns of dopamine release induced by naloxone and morphine. Human Brain Mapping, 43(4), 1419–1430. 10.1002/hbm.25733
Funding information National Institute on Alcohol Abuse and Alcoholism, Grant/Award Number: Y1AA3009
DATA AVAILABILITY STATEMENT
Most data are included in the manuscript and supporting information. Additional data will be made available at: https://github.com/eshoko/OPIOID.
REFERENCES
- Al‐Hasani, R. , McCall, J. G. , Shin, G. , Gomez, A. M. , Schmitz, G. P. , Bernardi, J. M. , … Bruchas, M. R. (2015). Distinct subpopulations of nucleus accumbens dynorphin neurons drive aversion and reward. Neuron, 87(5), 1063–1077. 10.1016/j.neuron.2015.08.019 [DOI] [PMC free article] [PubMed] [Google Scholar]
- Beier, K. T. , Steinberg, E. E. , DeLoach, K. E. , Xie, S. , Miyamichi, K. , Schwarz, L. , … Luo, L. (2015). Circuit architecture of VTA dopamine neurons revealed by systematic input‐output mapping. Cell, 162(3), 622–634. [DOI] [PMC free article] [PubMed] [Google Scholar]
- Bilgel, M. , Beason‐Held, L. , An, Y. , Zhou, Y. , Wong, D. F. , & Resnick, S. M. (2020). Longitudinal evaluation of surrogates of regional cerebral blood flow computed from dynamic amyloid PET imaging. Journal of Cerebral Blood Flow and Metabolism, 40(2), 288–297. 10.1177/0271678x19830537 [DOI] [PMC free article] [PubMed] [Google Scholar]
- Birn, R. M. , Converse, A. K. , Rajala, A. Z. , Alexander, A. L. , Block, W. F. , McMillan, A. B. , … Populin, L. C. (2019). Changes in endogenous dopamine induced by methylphenidate predict functional connectivity in nonhuman primates. The Journal of Neuroscience, 39(8), 1436–1444. 10.1523/jneurosci.2513-18.2018 [DOI] [PMC free article] [PubMed] [Google Scholar]
- Bontempi, B. , & Sharp, F. R. (1997). Systemic morphine‐induced Fos protein in the rat striatum and nucleus accumbens is regulated by μ opioid receptors in the substantia nigra and ventral tegmental area. Journal of Neuroscience, 17(21), 8596–8612. [DOI] [PMC free article] [PubMed] [Google Scholar]
- Britt, J. P. , & McGehee, D. S. (2008). Presynaptic opioid and nicotinic receptor modulation of dopamine overflow in the nucleus accumbens. Journal of Neuroscience, 28(7), 1672–1681. [DOI] [PMC free article] [PubMed] [Google Scholar]
- Caliński, T. , & Harabasz, J. (1974). A dendrite method for cluster analysis. Communications in Statistics‐theory and Methods, 3(1), 1–27. [Google Scholar]
- Castrellon, J. J. , Young, J. S. , Dang, L. C. , Cowan, R. L. , Zald, D. H. , & Samanez‐Larkin, G. R. (2019). Mesolimbic dopamine D2 receptors and neural representations of subjective value. Scientific Reports, 9(1), 20229. 10.1038/s41598-019-56858-1 [DOI] [PMC free article] [PubMed] [Google Scholar]
- Charbogne, P. , Gardon, O. , Martín‐García, E. , Keyworth, H. L. , Matsui, A. , Mechling, A. E. , … Kieffer, B. L. (2017). Mu opioid receptors in gamma‐aminobutyric acidergic forebrain neurons moderate motivation for heroin and palatable food. Biological Psychiatry, 81(9), 778–788. 10.1016/j.biopsych.2016.12.022 [DOI] [PMC free article] [PubMed] [Google Scholar]
- Chen, Y. J. , Rosario, B. L. , Mowrey, W. , Laymon, C. M. , Lu, X. , Lopez, O. L. , … Price, J. C. (2015). Relative 11C‐PiB delivery as a proxy of relative CBF: Quantitative evaluation using single‐session 15O‐water and 11C‐PiB PET. Journal of Nuclear Medicine, 56(8), 1199–1205. [DOI] [PMC free article] [PubMed] [Google Scholar]
- Clark, S. D. , & Abi‐Dargham, A. (2019). The role of dynorphin and the kappa opioid receptor in the symptomatology of schizophrenia: A review of the evidence. Biological Psychiatry, 86(7), 502–511. 10.1016/j.biopsych.2019.05.012 [DOI] [PubMed] [Google Scholar]
- Cox, R. W. (1996). AFNI: Software for analysis and visualization of functional magnetic resonance neuroimages. Computers and Biomedical Research, 29(3), 162–173. [DOI] [PubMed] [Google Scholar]
- Cui, Y. , Ostlund, S. B. , James, A. S. , Park, C. S. , Ge, W. , Roberts, K. W. , … Yang, X. W. (2014). Targeted expression of μ‐opioid receptors in a subset of striatal direct‐pathway neurons restores opiate reward. Nature Neuroscience, 17(2), 254–261. 10.1038/nn.3622 [DOI] [PMC free article] [PubMed] [Google Scholar]
- Daglish, M. R. , Williams, T. M. , Wilson, S. J. , Taylor, L. G. , Eap, C. B. , Augsburger, M. , … Grasby, P. (2008). Brain dopamine response in human opioid addiction. The British Journal of Psychiatry, 193(1), 65–72. [DOI] [PubMed] [Google Scholar]
- Desikan, R. S. , Ségonne, F. , Fischl, B. , Quinn, B. T. , Dickerson, B. C. , Blacker, D. , … Killiany, R. J. (2006). An automated labeling system for subdividing the human cerebral cortex on MRI scans into gyral based regions of interest. NeuroImage, 31(3), 968–980. 10.1016/j.neuroimage.2006.01.021 [DOI] [PubMed] [Google Scholar]
- Devine, D. P. , Leone, P. , Pocock, D. , & Wise, R. (1993). Differential involvement of ventral tegmental mu, delta and kappa opioid receptors in modulation of basal mesolimbic dopamine release: In vivo microdialysis studies. Journal of Pharmacology and Experimental Therapeutics, 266(3), 1236–1246. [PubMed] [Google Scholar]
- Edlow, B. L. , Takahashi, E. , Wu, O. , Benner, T. , Dai, G. , Bu, L. , … Folkerth, R. D. (2012). Neuroanatomic connectivity of the human ascending arousal system critical to consciousness and its disorders. Journal of Neuropathology and Experimental Neurology, 71(6), 531–546. 10.1097/NEN.0b013e3182588293 [DOI] [PMC free article] [PubMed] [Google Scholar]
- Endres, C. J. , Bencherif, B. , Hilton, J. , Madar, I. , & Frost, J. J. (2003). Quantification of brain μ‐opioid receptors with [11C] carfentanil: Reference‐tissue methods. Nuclear Medicine and Biology, 30(2), 177–186. [DOI] [PubMed] [Google Scholar]
- Ford, C. P. , Beckstead, M. J. , & Williams, J. T. (2007). Kappa opioid inhibition of somatodendritic dopamine inhibitory postsynaptic currents. Journal of Neurophysiology, 97(1), 883–891. [DOI] [PMC free article] [PubMed] [Google Scholar]
- Gerfen, C. R. , & Surmeier, D. J. (2011). Modulation of striatal projection systems by dopamine. Annual Review of Neuroscience, 34, 441–466. 10.1146/annurev-neuro-061010-113641 [DOI] [PMC free article] [PubMed] [Google Scholar]
- Gómez‐A, A. , Shnitko, T. A. , Barefoot, H. M. , Brightbill, E. L. , Sombers, L. A. , Nicola, S. M. , & Robinson, D. L. (2019). Local μ‐opioid receptor antagonism blunts evoked phasic dopamine release in the nucleus accumbens of rats. ACS Chemical Neuroscience, 10(4), 1935–1940. 10.1021/acschemneuro.8b00437 [DOI] [PMC free article] [PubMed] [Google Scholar]
- Hagelberg, N. , Aalto, S. , Kajander, J. , Oikonen, V. , Hinkka, S. , Någren, K. , … Scheinin, H. (2004). Alfentanil increases cortical dopamine D2/D3 receptor binding in healthy subjects. Pain, 109(1–2), 86–93. [DOI] [PubMed] [Google Scholar]
- Hagelberg, N. , Kajander, J. K. , Någren, K. , Hinkka, S. , Hietala, J. , & Scheinin, H. (2002). μ‐Receptor agonism with alfentanil increases striatal dopamine D2 receptor binding in man. Synapse, 45(1), 25–30. [DOI] [PubMed] [Google Scholar]
- Howes, O. D. , & Nour, M. M. (2016). Dopamine and the aberrant salience hypothesis of schizophrenia. World Psychiatry, 15(1), 3–4. [DOI] [PMC free article] [PubMed] [Google Scholar]
- Jenkinson, M. , Beckmann, C. F. , Behrens, T. E. J. , Woolrich, M. W. , & Smith, S. M. (2012). FSL. Neuroimage, 62(2), 782–790. 10.1016/j.neuroimage.2011.09.015 [DOI] [PubMed] [Google Scholar]
- Johnson, S. W. , & North, R. A. (1992). Two types of neurone in the rat ventral tegmental area and their synaptic inputs. The Journal of Physiology, 450(1), 455–468. [DOI] [PMC free article] [PubMed] [Google Scholar]
- Karalija, N. , Jonassson, L. , Johansson, J. , Papenberg, G. , Salami, A. , Andersson, M. , … Boraxbekk, C. J. (2020). High long‐term test‐retest reliability for extrastriatal (11)C‐raclopride binding in healthy older adults. Journal of Cerebral Blood Flow and Metabolism, 40(9), 1859–1868. 10.1177/0271678x19874770 [DOI] [PMC free article] [PubMed] [Google Scholar]
- Kosten, T. R. , & George, T. P. (2002). The neurobiology of opioid dependence: Implications for treatment. Science & Practice Perspectives, 1(1), 13–20. [DOI] [PMC free article] [PubMed] [Google Scholar]
- Kuwabara, H. , Heishman, S. J. , Brasic, J. R. , Contoreggi, C. , Cascella, N. , Mackowick, K. M. , … Huestis, M. A. (2014). Mu opioid receptor binding correlates with nicotine dependence and reward in smokers. PLoS One, 9(12), e113694. [DOI] [PMC free article] [PubMed] [Google Scholar]
- Lawson, R. P. , Drevets, W. C. , & Roiser, J. P. (2013). Defining the habenula in human neuroimaging studies. NeuroImage, 64, 722–727. [DOI] [PMC free article] [PubMed] [Google Scholar]
- Li, N. , & Jasanoff, A. (2020). Local and global consequences of reward‐evoked striatal dopamine release. Nature, 580, 1–6. [DOI] [PMC free article] [PubMed] [Google Scholar]
- Li, X.‐Y. , Sun, L. , He, J. , Chen, Z.‐L. , Zhou, F. , Liu, X.‐Y. , & Liu, R.‐S. (2010). The kappa‐opioid receptor is upregulated in the spinal cord and locus ceruleus but downregulated in the dorsal root ganglia of morphine tolerant rats. Brain Research, 1326, 30–39. [DOI] [PubMed] [Google Scholar]
- Lloyd, S. (1982). Least squares quantization in PCM. IEEE Transactions on Information Theory, 28(2), 129–137. [Google Scholar]
- Logan, J. , Fowler, J. S. , Volkow, N. D. , Wang, G.‐J. , Ding, Y.‐S. , & Alexoff, D. L. (1996). Distribution volume ratios without blood sampling from graphical analysis of PET data. Journal of Cerebral Blood Flow & Metabolism, 16(5), 834–840. [DOI] [PubMed] [Google Scholar]
- Lyoo, I. K. , Pollack, M. H. , Silveri, M. M. , Ahn, K. H. , Diaz, C. I. , Hwang, J. , … Renshaw, P. F. (2006). Prefrontal and temporal gray matter density decreases in opiate dependence. Psychopharmacology, 184(2), 139–144. 10.1007/s00213-005-0198-x [DOI] [PubMed] [Google Scholar]
- Madhavan, A. , Bonci, A. , & Whistler, J. L. (2010). Opioid‐induced GABA potentiation after chronic morphine attenuates the rewarding effects of opioids in the ventral tegmental area. The Journal of Neuroscience, 30(42), 14029–14035. 10.1523/JNEUROSCI.3366-10.2010 [DOI] [PMC free article] [PubMed] [Google Scholar]
- Margolis, E. B. , Hjelmstad, G. O. , Bonci, A. , & Fields, H. L. (2003). κ‐Opioid agonists directly inhibit midbrain dopaminergic neurons. Journal of Neuroscience, 23(31), 9981–9986. [DOI] [PMC free article] [PubMed] [Google Scholar]
- Margolis, E. B. , & Karkhanis, A. N. (2019). Dopaminergic cellular and circuit contributions to kappa opioid receptor mediated aversion. Neurochemistry International, 129, 104504. [DOI] [PMC free article] [PubMed] [Google Scholar]
- Margolis, E. B. , Toy, B. , Himmels, P. , Morales, M. , & Fields, H. L. (2012). Identification of rat ventral tegmental area GABAergic neurons. PLoS One, 7(7), e42365. [DOI] [PMC free article] [PubMed] [Google Scholar]
- Matsui, A. , & Williams, J. T. (2011). Opioid‐sensitive GABA inputs from rostromedial tegmental nucleus synapse onto midbrain dopamine neurons. The Journal of Neuroscience, 31(48), 17729–17735. 10.1523/JNEUROSCI.4570-11.2011 [DOI] [PMC free article] [PubMed] [Google Scholar]
- Matsumoto, H. , Tian, J. , Uchida, N. , & Watabe‐Uchida, M. (2016). Midbrain dopamine neurons signal aversion in a reward‐context‐dependent manner. eLife, 5, e17328. [DOI] [PMC free article] [PubMed] [Google Scholar]
- Maurer, R. , Cortes, R. , Probst, A. , & Palacios, J. (1983). Multiple opiate receptor in human brain: An autoradiographic investigation. Life Sciences, 33, 231–234. [DOI] [PubMed] [Google Scholar]
- Meshul, C. , & McGinty, J. (2000). Kappa opioid receptor immunoreactivity in the nucleus accumbens and caudate–putamen is primarily associated with synaptic vesicles in axons. Neuroscience, 96(1), 91–99. [DOI] [PubMed] [Google Scholar]
- Meyer, P. T. , Hellwig, S. , Amtage, F. , Rottenburger, C. , Sahm, U. , Reuland, P. , … Hüll, M. (2011). Dual‐biomarker imaging of regional cerebral amyloid load and neuronal activity in dementia with PET and 11C‐labeled Pittsburgh compound B. Journal of Nuclear Medicine, 52(3), 393–400. [DOI] [PubMed] [Google Scholar]
- Mulder, A. H. , Wardeh, G. , Hogenboom, F. , & Frankhuyzen, A. L. (1984). κ and δ‐opioid receptor agonists differentially inhibit striatal dopamine and acetylcholine release. Nature, 308(5956), 278–280. [DOI] [PubMed] [Google Scholar]
- Naganawa, M. , Zheng, M.‐Q. , Nabulsi, N. , Tomasi, G. , Henry, S. , Lin, S.‐F. , … Neumeister, A. (2014). Kinetic modeling of 11C‐LY2795050, a novel antagonist radiotracer for PET imaging of the kappa opioid receptor in humans. Journal of Cerebral Blood Flow & Metabolism, 34(11), 1818–1825. [DOI] [PMC free article] [PubMed] [Google Scholar]
- Nazzaro, J. , Seeger, T. , & Gardner, E. (1981). Morphine differentially affects ventral tegmental and substantia nigra brain reward thresholds. Pharmacology Biochemistry and Behavior, 14(3), 325–331. [DOI] [PubMed] [Google Scholar]
- Ogden, R. T. (2003). Estimation of kinetic parameters in graphical analysis of PET imaging data. Statistics in Medicine, 22(22), 3557–3568. [DOI] [PubMed] [Google Scholar]
- Peckys, D. , & Landwehrmeyer, G. (1999). Expression of mu, kappa, and delta opioid receptor messenger RNA in the human CNS: A 33P in situ hybridization study. Neuroscience, 88(4), 1093–1135. [DOI] [PubMed] [Google Scholar]
- Pergolizzi, J. V., Jr. , Raffa, R. B. , & Rosenblatt, M. H. (2020). Opioid withdrawal symptoms, a consequence of chronic opioid use and opioid use disorder: Current understanding and approaches to management. Journal of Clinical Pharmacy and Therapeutics, 45(5), 892–903. 10.1111/jcpt.13114 [DOI] [PubMed] [Google Scholar]
- Rzasa Lynn, R. , & Galinkin, J. L. (2018). Naloxone dosage for opioid reversal: Current evidence and clinical implications. Therapeutic Advances in Drug Safety, 9(1), 63–88. 10.1177/2042098617744161 [DOI] [PMC free article] [PubMed] [Google Scholar]
- Sasaki, T. , Ito, H. , Kimura, Y. , Arakawa, R. , Takano, H. , Seki, C. , … Suhara, T. (2012). Quantification of dopamine transporter in human brain using PET with 18F‐FE‐PE2I. Journal of Nuclear Medicine, 53(7), 1065. 10.2967/jnumed.111.101626 [DOI] [PubMed] [Google Scholar]
- Schmid, C. L. , Kennedy, N. M. , Ross, N. C. , Lovell, K. M. , Yue, Z. , Morgenweck, J. , … Bohn, L. M. (2017). Bias factor and therapeutic window correlate to predict safer opioid analgesics. Cell, 171(5), 1165–1175.e1113. 10.1016/j.cell.2017.10.035 [DOI] [PMC free article] [PubMed] [Google Scholar]
- Schott, B. H. , Minuzzi, L. , Krebs, R. M. , Elmenhorst, D. , Lang, M. , Winz, O. H. , … Bauer, A. (2008). Mesolimbic functional magnetic resonance imaging activations during reward anticipation correlate with reward‐related ventral striatal dopamine release. The Journal of Neuroscience: The Official Journal of the Society for Neuroscience, 28(52), 14311–14319. 10.1523/JNEUROSCI.2058-08.2008 [DOI] [PMC free article] [PubMed] [Google Scholar]
- Shokri‐Kojori, E. , Wang, G.‐J. , & Volkow, N. D. (2021). Naloxone precipitated withdrawal increases dopamine release in the dorsal striatum of opioid dependent men. Translational Psychiatry, 11(1), 445. 10.1038/s41398-021-01548-8 [DOI] [PMC free article] [PubMed] [Google Scholar]
- Spagnolo, P. A. , Kimes, A. , Schwandt, M. L. , Shokri‐Kojori, E. , Thada, S. , Phillips, K. A. , … Tomasi, D. (2019). Striatal dopamine release in response to morphine: A [11C]‐raclopride positron emission tomography study in healthy men. Biological Psychiatry, 86, 356–364. [DOI] [PMC free article] [PubMed] [Google Scholar]
- Spanagel, R. , Herz, A. , & Shippenberg, T. S. (1992). Opposing tonically active endogenous opioid systems modulate the mesolimbic dopaminergic pathway. Proceedings of the National Academy of Sciences, 89(6), 2046–2050. [DOI] [PMC free article] [PubMed] [Google Scholar]
- Stokes, P. R. A. , Egerton, A. , Watson, B. , Reid, A. , Breen, G. , Lingford‐Hughes, A. , … Mehta, M. A. (2010). Significant decreases in frontal and temporal [11C]‐raclopride binding after THC challenge. NeuroImage, 52(4), 1521–1527. 10.1016/j.neuroimage.2010.04.274 [DOI] [PubMed] [Google Scholar]
- Suzuki, S. , Chuang, T. K. , Chuang, L. F. , Doi, R. H. , & Chuang, R. Y. (2001). Morphine upregulates kappa‐opioid receptors of human lymphocytes. In Neuroimmune circuits, drugs of abuse, and infectious diseases (pp. 81–87). Boston, MA: Springer. [DOI] [PubMed] [Google Scholar]
- Svensson, J. E. , Schain, M. , Plavén‐Sigray, P. , Cervenka, S. , Tiger, M. , Nord, M. , … Lundberg, J. (2019). Validity and reliability of extrastriatal [(11)C]raclopride binding quantification in the living human brain. NeuroImage, 202, 116143. 10.1016/j.neuroimage.2019.116143 [DOI] [PubMed] [Google Scholar]
- Svingos, A. L. , Chavkin, C. , Colago, E. E. , & Pickel, V. M. (2001). Major coexpression of κ‐opioid receptors and the dopamine transporter in nucleus accumbens axonal profiles. Synapse, 42(3), 185–192. [DOI] [PubMed] [Google Scholar]
- Svingos, A. L. , Clarke, C. L. , & Pickel, V. M. (1999). Localization of the δ‐opioid receptor and dopamine transporter in the nucleus accumbens shell: Implications for opiate and psychostimulant cross‐sensitization. Synapse, 34(1), 1–10. [DOI] [PubMed] [Google Scholar]
- Tempel, A. , Habas, J. , Paredes, W. , & Barr, G. A. (1988). Morphine‐induced downregulation of μ‐opioid receptors in neonatal rat brain. Developmental Brain Research, 41(1–2), 129–133. [DOI] [PubMed] [Google Scholar]
- Trovero, F. , Herve, D. , Desban, M. , Glowinski, J. , & Tassin, J.‐P. (1990). Striatal opiate mu‐receptors are not located on dopamine nerve endings in the rat. Neuroscience, 39(2), 313–321. [DOI] [PubMed] [Google Scholar]
- Turchan, J. , Przewłocka, B. , Toth, G. , Lasoń, W. , Borsodi, A. , & Przewłocki, R. (1999). The effect of repeated administration of morphine, cocaine and ethanol on mu and delta opioid receptor density in the nucleus accumbens and striatum of the rat. Neuroscience, 91(3), 971–977. [DOI] [PubMed] [Google Scholar]
- Tziortzi, A. C. , Haber, S. N. , Searle, G. E. , Tsoumpas, C. , Long, C. J. , Shotbolt, P. , … Rabiner, E. A. (2014). Connectivity‐based functional analysis of dopamine release in the striatum using diffusion‐weighted MRI and positron emission tomography. Cerebral Cortex, 24(5), 1165–1177. [DOI] [PMC free article] [PubMed] [Google Scholar]
- Upadhyay, J. , Maleki, N. , Potter, J. , Elman, I. , Rudrauf, D. , Knudsen, J. , … Borsook, D. (2010). Alterations in brain structure and functional connectivity in prescription opioid‐dependent patients. Brain, 133(Pt 7, 2098–2114. 10.1093/brain/awq138 [DOI] [PMC free article] [PubMed] [Google Scholar]
- van Velden, F. H. P. , Kloet, R. W. , van Berckel, B. N. M. , Buijs, F. L. , Luurtsema, G. , Lammertsma, A. A. , & Boellaard, R. (2009). HRRT versus HR+ human brain PET studies: An interscanner test–retest study. Journal of Nuclear Medicine, 50(5), 693. 10.2967/jnumed.108.058628 [DOI] [PubMed] [Google Scholar]
- Volkow, N. D. , Wang, G.‐J. , Fowler, J. S. , Logan, J. , Gerasimov, M. , Maynard, L. , … Franceschi, D. (2001). Therapeutic doses of oral methylphenidate significantly increase extracellular dopamine in the human brain. Journal of Neuroscience, 21(2), RC121. [DOI] [PMC free article] [PubMed] [Google Scholar]
- Volkow, N. D. , Wang, G.‐J. , Telang, F. , Fowler, J. S. , Alexoff, D. , Logan, J. , … Tomasi, D. (2014). Decreased dopamine brain reactivity in marijuana abusers is associated with negative emotionality and addiction severity. Proceedings of the National Academy of Sciences, 111(30), E3149–E3156. [DOI] [PMC free article] [PubMed] [Google Scholar]
- Wang, D. , Sun, X. , & Sadee, W. (2007). Different effects of opioid antagonists on μ‐, δ‐, and κ‐opioid receptors with and without agonist pretreatment. Journal of Pharmacology and Experimental Therapeutics, 321(2), 544–552. 10.1124/jpet.106.118810 [DOI] [PubMed] [Google Scholar]
- Wang, G.‐J. , Volkow, N. D. , Fowler, J. S. , Logan, J. , Abumrad, N. N. , Hitzemann, R. J. , … Pascani, K. (1997). Dopamine D 2 receptor availability in opiate‐dependent subjects before and after naloxone‐precipitated withdrawal. Neuropsychopharmacology, 16(2), 174–182. [DOI] [PubMed] [Google Scholar]
- Weerts, E. M. , Wand, G. S. , Kuwabara, H. , Munro, C. A. , Dannals, R. F. , Hilton, J. , … McCaul, M. E. (2011). Positron emission tomography imaging of mu‐and delta‐opioid receptor binding in alcohol‐dependent and healthy control subjects. Alcoholism: Clinical and Experimental Research, 35(12), 2162–2173. [DOI] [PMC free article] [PubMed] [Google Scholar]
- Werling, L. , Frattali, A. , Portoghese, P. , Takemori, A. , & Cox, B. (1988). Kappa receptor regulation of dopamine release from striatum and cortex of rats and Guinea pigs. Journal of Pharmacology and Experimental Therapeutics, 246(1), 282–286. [PubMed] [Google Scholar]
- Wollman, S. C. , Alhassoon, O. M. , Hall, M. G. , Stern, M. J. , Connors, E. J. , Kimmel, C. L. , … Radua, J. (2017). Gray matter abnormalities in opioid‐dependent patients: A neuroimaging meta‐analysis. The American Journal of Drug and Alcohol Abuse, 43(5), 505–517. 10.1080/00952990.2016.1245312 [DOI] [PubMed] [Google Scholar]
- Wu, Y. , & Carson, R. E. (2002). Noise reduction in the simplified reference tissue model for neuroreceptor functional imaging. Journal of Cerebral Blood Flow & Metabolism, 22(12), 1440–1452. [DOI] [PubMed] [Google Scholar]
- Xiao, C. , Cho, J. R. , Zhou, C. , Treweek, J. B. , Chan, K. , McKinney, S. L. , … Gradinaru, V. (2016). Cholinergic Mesopontine signals govern locomotion and reward through dissociable midbrain pathways. Neuron, 90(2), 333–347. 10.1016/j.neuron.2016.03.028 [DOI] [PMC free article] [PubMed] [Google Scholar]
- Yamada, H. , Shimoyama, N. , Sora, I. , Uhl, G. R. , Fukuda, Y. , Moriya, H. , & Shimoyama, M. (2006). Morphine can produce analgesia via spinal kappa opioid receptors in the absence of mu opioid receptors. Brain Research, 1083(1), 61–69. [DOI] [PubMed] [Google Scholar]
- Zadina, J. E. , Chang, S. L. , Ge, L. , & Kastin, A. J. (1993). Mu opiate receptor down‐regulation by morphine and up‐regulation by naloxone in SH‐SY5Y human neuroblastoma cells. Journal of Pharmacology and Experimental Therapeutics, 265(1), 254–262. [PubMed] [Google Scholar]
- Zhang, H. , & Sulzer, D. (2012). Regulation of striatal dopamine release by presynaptic auto‐ and heteroreceptors. Basal Ganglia, 2(1), 5–13. 10.1016/j.baga.2011.11.004 [DOI] [PMC free article] [PubMed] [Google Scholar]
- Zhang, Y. , Larcher, K. M.‐H. , Misic, B. , & Dagher, A. (2017). Anatomical and functional organization of the human substantia nigra and its connections. eLife, 6, e26653. [DOI] [PMC free article] [PubMed] [Google Scholar]
Associated Data
This section collects any data citations, data availability statements, or supplementary materials included in this article.
Supplementary Materials
Appendix S1: Supporting Information
Data Availability Statement
Most data are included in the manuscript and supporting information. Additional data will be made available at: https://github.com/eshoko/OPIOID.