Abstract
Cannabis is gaining increasing attention due to the high pharmacological potential and updated legislation authorizing multiple uses. The development of time- and cost-efficient analytical methods is of crucial importance for phytocannabinoid profiling. This review aims to capture the versatility of analytical methods for phytocannabinoid profiling of cannabis and cannabis-based products in the past four decades (1980–2021). The thorough overview of more than 220 scientific papers reporting different analytical techniques for phytocannabinoid profiling points out their respective advantages and drawbacks in terms of their complexity, duration, selectivity, sensitivity and robustness for their specific application, along with the most widely used sample preparation strategies. In particular, chromatographic and spectroscopic methods, are presented and discussed. Acquired knowledge of phytocannabinoid profile became extremely relevant and further enhanced chemotaxonomic classification, cultivation set-ups examination, association of medical and adverse health effects with potency and/or interplay of certain phytocannabinoids and other active constituents, quality control (QC), and stability studies, as well as development and harmonization of global quality standards. Further improvement in phytocannabinoid profiling should be focused on untargeted analysis using orthogonal analytical methods, which, joined with cheminformatics approaches for compound identification and MSLs, would lead to the identification of a multitude of new phytocannabinoids.
Keywords: Cannabis sativa, sample preparation, analysis, quality control
1. Introduction
Cannabis sativa L. (C. sativa L.), from the family Cannabaceae, is the most widely cultivated, trafficked, consumed and investigated, yet most notorious and controversial, plant in the world [1,2]. It is one of the oldest known crops to humanity, with first records of use dating to 3000 B.C. [3], and one of the most commonly used plants for industrial and medical purposes, with a global legal market expected to reach 147 billion USD by the end of 2027 but also the world’s most widespread drug of abuse [1], comprising around 200 million global users.
1.1. Botany of C. sativa
C. sativa is an annual dioecious plant with histaminate male and pistillate female flowers on separate plants. It grows up to 5 m height, with serrated leaves with a distinct vein pattern that extends to their tips [4]. The inflorescences of the female plants produce several individual bunches of flowers, a large cluster on the upper torso and various small clusters in each branch, covered by trichome glands containing resin rich in phytocannabinoids and terpenoids. Phytocannabinoids are mainly accumulated in the glands of both capitate stalked and capitate-sessile trichomes, but mostly in the latter [4]. C. sativa was first classified in 1753 by the Swedish botanist Carolus Linnaeus (Carl Von Linné). More than 2 centuries later, despite its wide use, C. sativa is considered a plant with inconclusive taxonomic organization and evolutionary history that are the subject of constant scientific debates [3,5,6]. The United Nations Office on Drugs and Crime (UNODC) [5] considers that the plant has only one recognized species, C. sativa L. [5,6,7], although other reported taxa for this genus, such as C. sativa subsp. sativa, C. sativa subsp. indica, C. sativa subsp. ruderalis, C. sativa subsp. spontanea, and C. sativa subsp. kafiristanca are currently recognized as subspecies [3,5,6,7]. Today, due to the difficulty in distinguishing cannabis species either morphologically or chemically, and given the continuous changes occurring in subspecies according to the cultivation environment, the designation C. sativa is considered suitable for all plants from the genus [3,5].
1.2. Phytocannabinoids
A wide variety of chemical constituents, i.e., more than 750 compounds, have been identified in C. sativa, belonging to the various classes of natural products such as mono- and sesquiterpenes, flavonoids, steroidsand nitrogen-containing compounds [8]. Among them, more than 100 are classified as phytocannabinoids [9], the family of plant-derived C21 or C22 terpenophenolic compounds, including analogues and metabolites. They are synthesized in secreting cells of glandular trichomes in a biosynthetic pathway from geranyl pyrophosphate (GPP) as the parent precursor of both phytocannabinoids and terpenes. By coupling with olivetolic acid or divarinic acid, C5 or C3 cannabinoid acids are produced, respectively [10]. Most phytocannabinoids naturally occur as acidic precursors in unfertilized female flowers prior to senescence [2], of which delta-9-tetrahydrocannabinolic acid (Δ9-THCA), cannabidiolic acid (CBDA), cannabigerolic acid (CBGA) and cannabichromenic acid (CBCA) are most abundant, with cannabidivarinic acid (CBDVA) and tetrahydrocannabivarinic acid (THCVA) as less abundant [11]. Lower phytocannabinoids content is found in leavesand stems, while absent from roots and seeds.
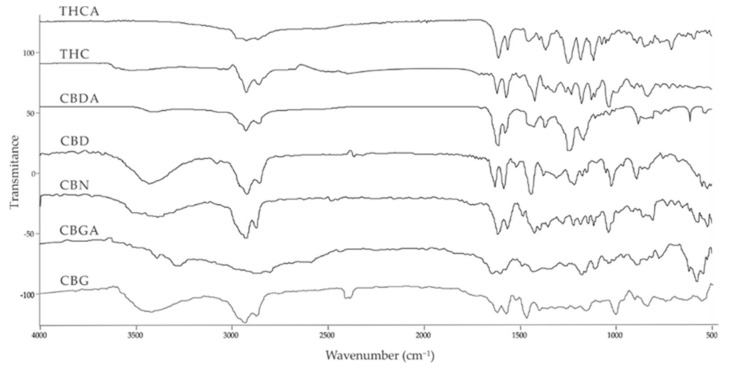
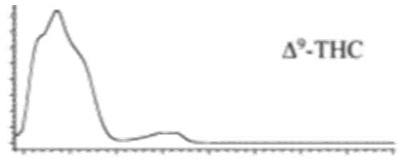
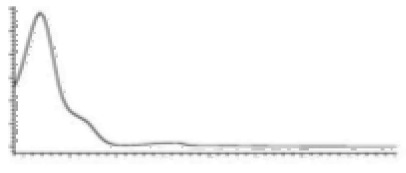
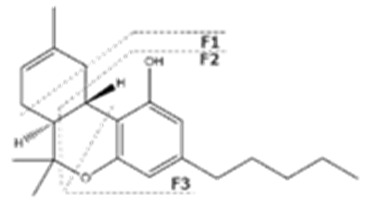
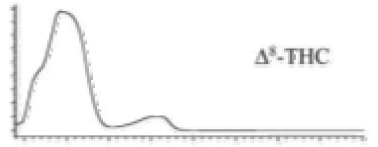
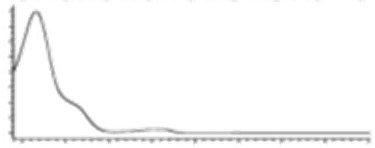
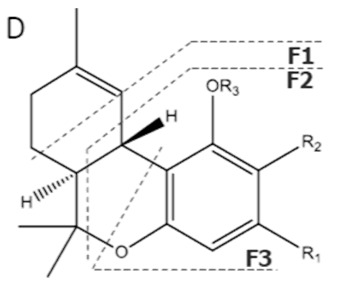
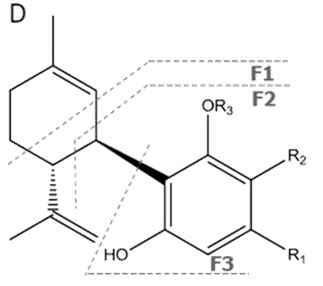
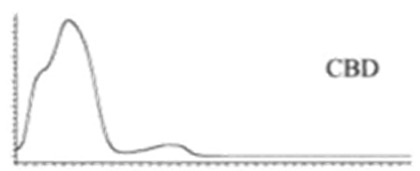
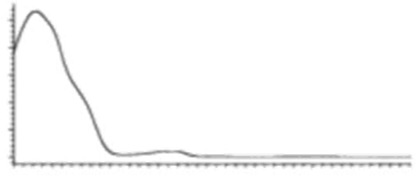
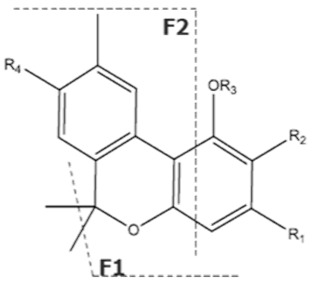
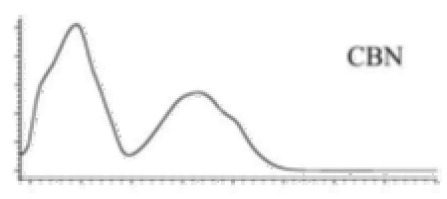
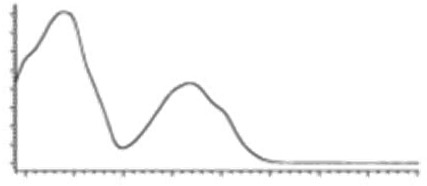
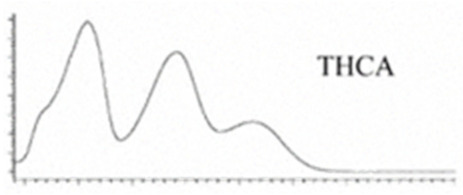
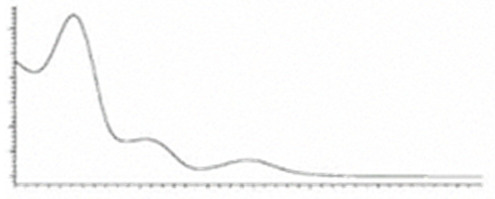
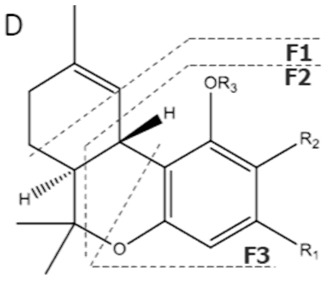
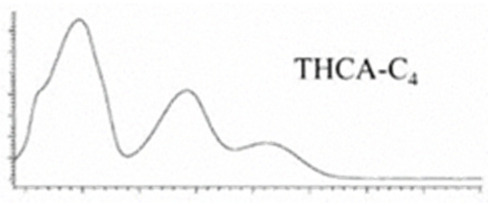
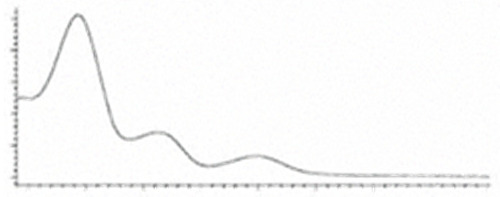
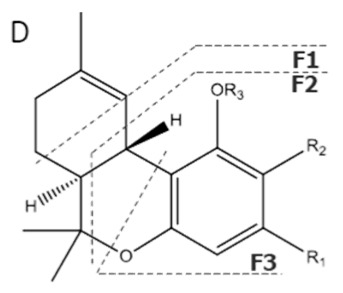
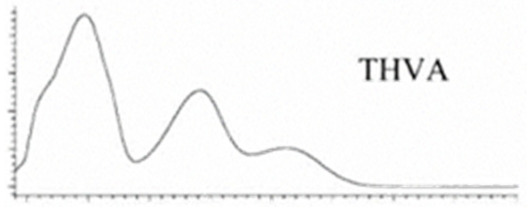
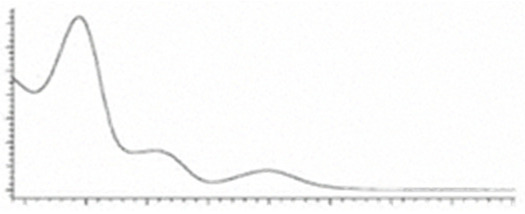
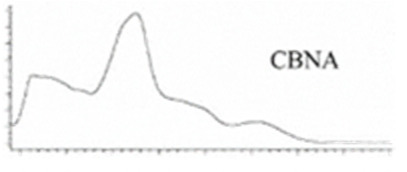
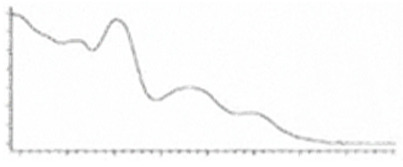
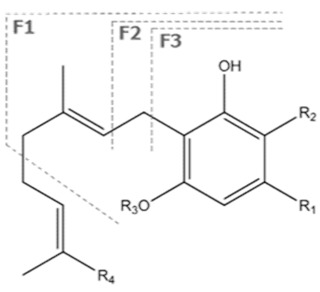
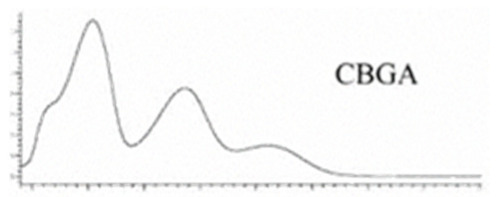
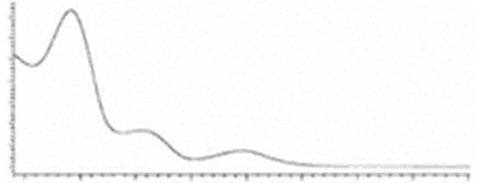
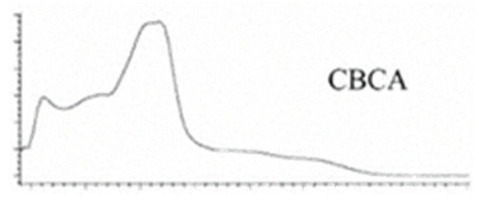
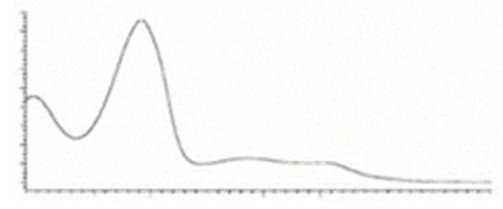
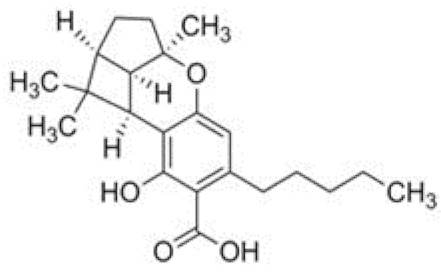
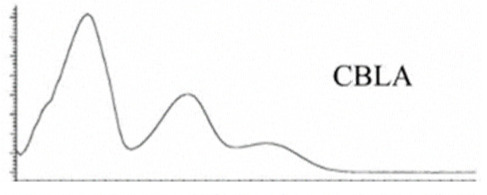
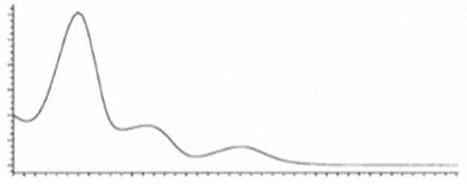
Cannabinoid acids are converted to their neutral counterparts by decarboxylation induced by heat or age. Cannabidiol (CBD), the first cannabinoid was isolated from C. sativa in 1963 [12], -delta-9--tetrahydrocannabinol (Δ9-THC), the second cannabinoid from C. sativa in 1964 [13], delta-8-tetrahydrocannabinol (Δ8-THC), the third, cannabigerol (CBG), isolated in 1964, followed by cannabichromene (CBC), isolated in 1966 [14], cannabidivarin (CBDV) [15] and tetrahydrocannabivarin (THCV) [16], which are formed from CBDA, Δ9-THCA, CBGA, CBCA, CBDVA and THCVA, respectively [17]. Oxidative degradation of Δ9-THC results in the formation of cannabinol (CBN), while isomerization leads to the formation of the more stable, but less active isomer of Δ9-THC, Δ8-THC. Δ9-THCA can degrade to cannabinolic acid (CBNA) and further to CBN. Molecular and structural formula, molecular mass and major fragments as well as UV-VIS spectrum and mid-IR spectra of major phytocannabinoids are presented in Table 1 and Figure 1.
Table 1.
Formula, MS and UV data of major phytocannabinoids.
| Compound [18] | Molecular Formula and Mr [18] | [M-H]− [MF1-H]− [MF2-H]− [MF3-H]− [19] |
Structure [19] | UV-VIS Spectra [18] Acidic HPLC Systems/ Basic HPLC Systems |
1H NMR in Deuterated Chloroform [4,20] |
|---|---|---|---|---|---|
| Δ9-THC | C21H30O2 314.472 |
C21H29O2, 313.2173 C16H21O2, 245.1547 C12H15O2, 191.1078 C11H15O22, 179.1067 |
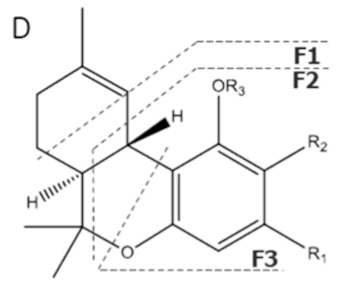 R1-C5H11, R2-H, R3-H |
|
3.20 (1H, dm, 10.9 Hz) 6.31 (1H, q, 1.6 Hz) 1.68 (3H, s) 2.16 (2H, m) 1.90 (1H, m), 1.40 (m) 1.69 (m) 1.41 (3H, s) 1.09 (3H, s) 6.14 (1H, d, 1.6Hz) 6.27 (1H, d, 1.6 Hz) 2.42 (2H, t, 7.3 Hz, 1.6 Hz), 1.55 (2H, q, 7.8 Hz) 1.29 (m) 1.29 (m) d 0.87 (3H, t, 7.0 Hz) 4.87 (1H, s) |
| Δ8-THC | C21H30O2 314.472 |
C21H29O2, 313.2173 C16H21O2, 245.1547 C12H15O2, 191.1078 C11H15O2, 179.1067 |
 - |
|
|
| THV | C19H26O2 286.418 |
C19H25O2, 285.1860 C14H17O2, 217.1234 C10H11O2, 163.0765 C9H11O2, 151.0765 |
 R1-C3H17, R2-H, R3-H |
- - |
|
| CBD | C21H30O2 314.472 |
C21H29O2, 313.2173 C16H21O2, 245.1547 C12H15O2, 191.1078 C11H15O2, 179.1067 |
 R1-C5H11, R2-H, R3-H |
|
3.90 (1H, dm, 11.8Hz) 5.57 (1H, s) 2.21 (1H, m), 2.09 (1H, m) 1.84 (m) 2.40 (m) 1.79 (3H, s) 4.64 (trans, 1H, m), 4.54 (cis, 1H, m) 1.66 (3H, s) 6.26 (1H, brs) 6.16 (1H, brs) 2.43 (2H, t, 7.5Hz) 1.55 (2H, q, 7.6Hz) 1.29 (m) 1.29 (m) 0.88 (3H, t, 6.8Hz) 5.99 (1H, s) 5.02 (1H, s) |
| CBN | C21H26O2 310.440 |
C21H25O2, 309.1860 C19H19O2, 279.1391 C12H11O2, 171.0815 |
 R1-C5H11, R2-H, R3-H, R4-H |
|
8.16 (1H, s) 2.38 (3H, s) 7.07 (1H, d, 7.9Hz) 7.14 (1H, d, 7.9Hz) 1.60 (6H, s) 1.60 (6H, s) 6.29 (1H, d, 1.1Hz) 6.44 (1H, d, 1.1Hz) 2.50 (2H, t, 7.5Hz) 1.63 (m) 1.32 (m) g 1.32 (m) g 0.89 (3H, t, 6.8Hz)5.13 (1H, s) |
| CBG | C21H32O2 316.488 |
C21H31O2, 315.2329 C16H21O2, 245.1547 C12H15O2, 191.1078 C11H15O2, 179.1067 |
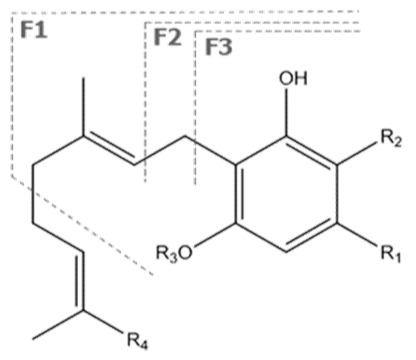 R1-C5H11, R2-H, R3-H, R4-H |
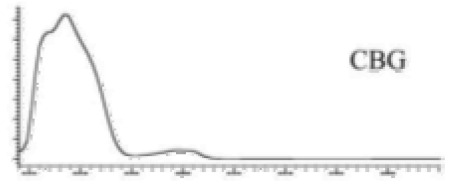
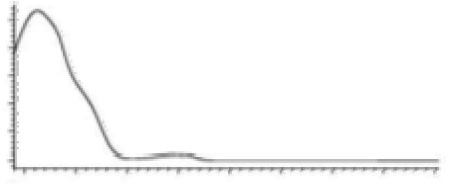
|
6.26 (2H, s) d 6. (2H, s) d 3.41 (2H, d, 7.0 Hz) 5.29 (1H, m) 1.82 (3H, s) 2.09 (4H, m) 2.09 (4H, m) 5.07 (1H, m) 1.60 (3H, s) 1.69 (3H, s) 2.45 (2H, t, 7.5 Hz) 1.56 (2H, q, 7.8 Hz) 1.33 (4H, m) 1.33 (4H, m) 0.90 (3H, t, 6.9 Hz) 5.36 (2H, s) |
| CBC | C21H30O2 314.172 |
C12H29O2, 313.2173 C16H19O2, 243.1391 C12H15O2, 191.1078 C11H15O2, 179.1067 |
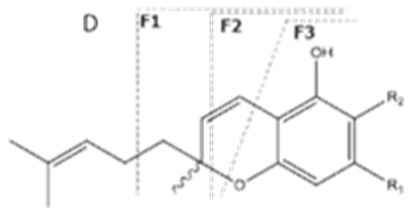 R1-C5H11, R2-H |
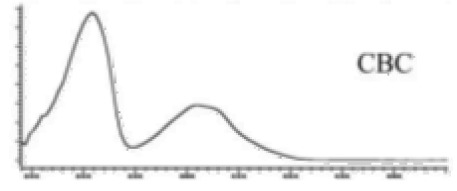
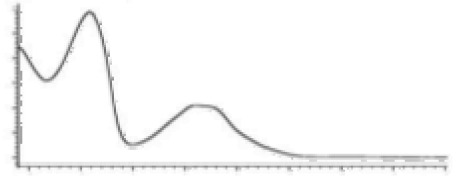
|
N/A |
| CBL | C21H30O2 314.472 |
C21H29O2, 313.2173 C16H19O2, 243.1391 C12H15O2, 191.1078 C11H15O2, 179.1067 |
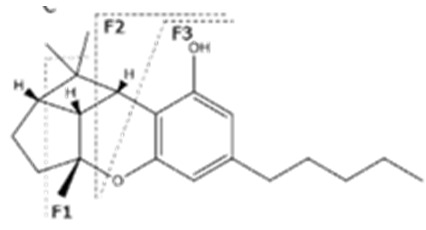
|
N/A | N/A |
| Δ9-THCA | C22H30O24 358.482 |
C22H29O4, 357.2071 C21H30O2, 245.1547 C12H15O2, 191.1078 C11H15O22, 179.1067 |
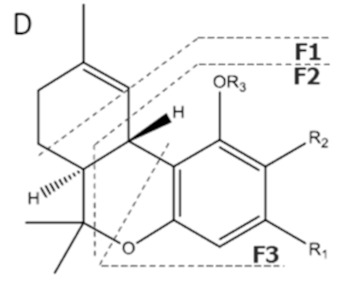 R1-C5H11, R2-COOH, R3-H |
|
3.23 (1H, dm, 7.0 Hz), 6.39(1H, brs), 1.68 (3H, s), 2.17 (2H, m) 1.92 (1H, m) 1.35 (m) 1.67 (m) 1.44 (3H, s) 1.11 (3H, s) 6.26 (1H, s) 2.94 (1H, m) 2.78 (1H, m) 1.57 (2H, 1.35 (m) 1.35 (m) 0.90 (3H, t, 6.9 Hz) 12.19 (1H, s) |
| Δ9-THCA-C4 | C21H28O4 344.455 |
C21H27O4, 343.1915 C15H19O2, 231.1391 C11H13O2, 177.0921 C10H13O2, 165.0921 |
 R1-C4H9, R2-COOH, R3-H |
|
N/A |
| THVA | C20H26O4 330.428 |
C20H25O4, 329.1758 C14H17O2, 217.1234 C10H11O2, 163.0765 C9H11O2, 151.0765 |
 R1-C3H7, R2-COOH, R3-H |
|
N/A |
| CBDA | C22H30O4 358.482 |
C22H29O4, 357.2071 C16H2102, 245.1547 C12H1502, 191.1078 C11H1502, 179.1067 |
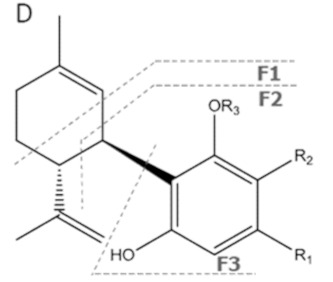 R1-C5H11, R2-COOH, R3-H |
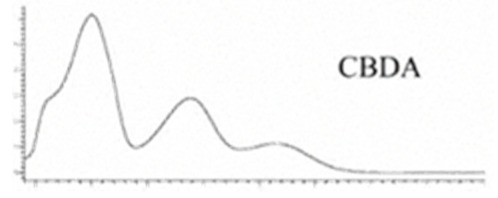
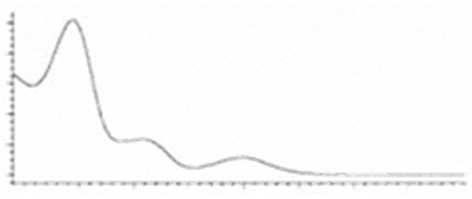
|
N/A |
| CBNA | C22H26O4 354.450 |
C22H25O4, 353.175 C19H1902, 279.1391 C12H1102, 171.0815 C21H2502, 309.1860 |
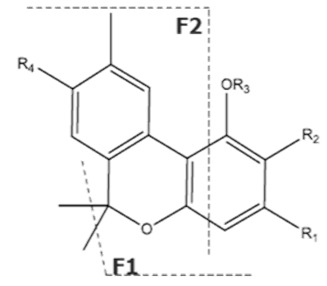 R1-C5H11, R2-COOH, R3-H, R4-H |
|
N/A |
| CBGA | C22H32O4 360.498 |
C22H31O4, 359.2228 C16H21O2, 245.1547 C12H15O2, 191.1078 C11H15O2, 179.1067 |
 R1-C5H11, R2-COOH, R3-H, R4-H |
|
N/A |
| CBCA | C22H30O4 358.482 |
C22H29O4, 357.2071 C16H19O2, 243.1391 C12H15O2, 191.1078 C11H15O2, 179.1067 |
R1-C5H11, R2-COOH, 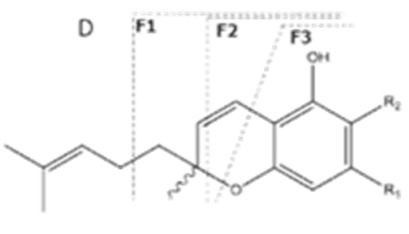
|
|
N/A |
| CBLA | C22H30O4 358.482 |
- - - - |
|
|
N/A |
Figure 1.
Mid−IR spectra from the main cannabinoids; THCA, THC, CBDA, CBD were adapted from [21,22]; CBN, CBGA and CBG were adapted from [18].
1.3. Use of C. sativa
For more than 12,000 years, Cannabis spp. is used as a source of textile fiber and food worldwide [23]. The earliest data for medical use of Cannabis by the Assyrians goes back to 3000 B.C. Follow-up records date from around 2700 B.C. in China, where C. sativa was used as a medicine for menstrual fatigue, rheumatism, malaria, constipation and other conditions. It was later used by other ancient civilizations-the Egyptians (ca. 1700 B.C.), the Indians (ca. 1600 B.C.), the Persians (ca. 750 B.C.), the Greeks and the Romans (ca. 450 B.C.). Historically, Cannabis was also used for additional indications such as glaucoma, anal fissures, diarrhoea, as obstetric aid and as anxiety relief [23]. The plant was introduced to the modern western medicine in the early 19th century, and was mainly indicated for treating pain, glaucoma, nausea, depression and neuralgia [24].
Today, medical use of C. sativa includes multiple indications supported by reliable clinical evidence. Such are the treatment of chronic pain, mutiple sclerosis, resistant epilepsy and chemotherapy-associated nausea and vomiting, apetite and weight loss associated with HIV/AIDS, Tourette syndrome, anxiety disorders, sleep disorders, post-traumatic stress disorder and schizophrenia [1,25,26]. Multiple additional health benefits of C. sativa extracts are reported in in vitro and in vivo trials, such as lowering blood cholesterol, triglycerides and blood pressure, antioxidant and antimicrobial activity [27]. C. sativa and its extracts are also used in the treatment of dermatitis and degenerative imunological diseases, both as supplements and as traditional medications [25]. Cannabis oils, oral solutions, oil-like concentrates and tinctures used orally and sublingually, lotions, balms, creams, bath salts, salves, gels, patches and other topical products as well as rectal and vaginal products (suppositories, tablets) are the most common pharmaceutical dosage forms employed [26].
Moreover, hemp is additionally used in food and beverage production, as hempseeds are shown to have great nutritional value: high content of protein, containingnine essential amino acids, dietary fibers and an ideal ratio of ω-6:ω-3 fatty acids (3:1). The same applies to hempseed flour and oils, which have high content of proteins, insoluble fibers and polyunsaturated fatty acids. The “cannabis edibles” are the latest type of cannabis-based products that recently became popular. Chewing gums, lollipops, caramel hard candy, berry gummies, lozenges, candy bars, jam, tea, soda, coffee, water, honey, etc., containing Δ9-THC- and/or CBD-dominant extracts and concentrates are widely marketed [28].
Today, cannabis is the most commonly used illicit drug worldwide, despite the strict international control for more than eight decades [9].
1.4. Legal Aspect of C. sativa
C. sativa and/or cannabis-based products have been legalized for medical use in 41 countries (23 in Europe) between 2012–2021. As C. sativa and cannabis-based products are classified based on the Δ9-THC content with psychotropic properties, and most of them contain drug-type C. sativa extracts, various legal limitations in many countries still exist. In total, 50 countries in Europe, Asia, North and South America use the plant for industrial purposes [29]. Cultivation and supply of 69 C. sativa varieties [30] with Δ9-THC content not exceeding 0.2% is legal in EU [31], with some exclusions (Czech Republic and Austria, <0.3%, Switzerland 1.0%).The industrial use of C. sativa is focused on production of >2500 products used in agriculture, textile production, recycling, automotive industry, furniture production, paper industry, production of construction materials, energy production, personal care products and medical supplements [29].
Cultivation and use of marijuana, the crude drug derived from C. sativa for recreational purposes, is not legalized in Europe, but it is decriminalized in 32 countries worldwide (16 in Europe), with various limitations regarding the amount of dry marijuana, number of cultivated plants and punishing public consumption [32].
Several Pharmacopoeias, including the German pharmacopoeia (DAB), Swiss pharmacopoeia (Ph.Helv.), European Pharmacopoeia (Ph.Eur.), and the American Herbal Pharmacopoeia (AHP) comprise monographs defining Cannabis flowers (“Cannabis inflorescence”) as herbal substance that consists of whole or crushed, flowering, dried shoot tips of the female plants of C. sativa L. (Cannabaceae) that contain 90.0–110.0% of the amounts of phytocannabinoids specified in the label, such as Δ9-THC and CBD, as well as cannabinoid carboxylic acids such as Δ9-THCA and CBDA, calculated as Δ9-THC or CBD, based on the dried drug [33,34,35,36].
Due to legal issues, chemotype classification of C. sativa is nowadays much more significant. Depending on the content of Δ9-THC and CBD, authorities have classified generally three chemotypes of C. sativa L.: Δ9-THC-predominant type, i.e., drug-type (CBD/Δ9-THC = 0.00–0.005), CBD-predominant type, i.e., fiber type (“hemp” type) (CBD/Δ9-THC = 15.0–25.0) and intermediate chemotype (CBD/Δ9-THC = 0.5–3.0) [37]. AHP proposes more comprehensive chemotype classification. Six chemotypes are defined: (1) type I-Drug (0.5–15% ∆9-THC; 0.01–0.16%CBD and 50:1 Δ9-THC/CBD ratio); type II-Intermediate (0.5–5% ∆9-THC; 0.9–7.3% CBD and 0.25/~2 Δ9-THC/CBD ratio); type III-Fiber (0.05–0.70% ∆9-THC; 1.0–13.6% CBD and <1:5 Δ9-THC/CBD ratio); type IV-CBG (<0.05% ∆9-THC; <0.5% CBD); type V-non-cannabinoid (∆9-THC = 0; CBD = 0) [33]. In addition, DAB defines a discontinued cannabis extract-Cannabis extractum normatum as an extract from whole or shredded, flowering, dried shoot tips of the female plants of C. sativa L. that contains Δ9-THC at least 1% and at most 25% (m/m) for the extract and 90.0 to 110.0% of the nominal salary specified in the label, and CBD maximum 10.0% (m/m) for the extract and 90.0 to 110.0% of the nominal content stated in the label [38]. High within-chemotype variability is recorded, due to changes in growing and storage conditions, such as environmental factors of cultivation (climates and elevation of cultivated area), the development stage of the plant at harvest time and genetic characteristics of seed-stocks [2,17].
1.5. Incentive for Investigating Phytocannabinoids in C. sativa and Cannabis-Based Products
Under the pressure of its criminal association, the chemical constitution, pharmacological effects, genetic structure, evolutionary and domestication history of remained poorly understood until the last decade of the 20th century. Authorized investigations related to C. sativa were either forensic studies to aid law enforcement or medical and social research specifically intended to document and reduce harmful effects [6]. Since the last decade of the 20th century, a great urge for more thorough investigation of C. sativa appeared, mainly as a result of the resurrection of production of C. sativa for non-narcotic and medical purposes and the growing tolerance of the extremely widespread recreational use. This increased attention C. sativa and cannabis-based products gained due to their high pharmacological potential, updated legislation authorizing many different uses, and, thus, the emerging need to control their quality. This imposes a great challenge for academics, particularly in the field of natural products, from which a contribution to improve and standardize the extraction and characterization of the bioactive compounds from C. sativa species is expected.
Scientific and technological development in regards to C. sativa began, highlighting the need of sensitive, specific and robust analytical methods for identification and quantification of the active constituents of C. sativa. Chemical profiling of the plant became extremely relevant, since the acquired knowledge further enhanced: (1) chemotaxonomic classification; (2) cultivation set-ups examination, and thus adjustment of cultivation conditions and breeding methodologies in order to produce C. sativa varieties with fit-for-purpose physicochemical properties; (3) investigation of potency of seized samples, thus discovering sources of interconnected illegal production and trafficking; (4) association of medical and adverse health effects with potency and/or interplay of certain phytocannabinoids and other active C. sativa constituents and (5) QC of medical cannabis and final medical cannabis-based products and potency examination [1,2].
The multitude of cannabis-based products including cannabis extracts, oils, resins, pharmaceutical dosage forms, cannabis-infused edibles and beverages are obliged to comply with the national regulatories’ quality control regulations, especially in terms of phytocannabinoids content. Accurate qualitative and quantitative analyses of the phytocannabinoids content and chemical profile in cannabis plants are extremely relevant, in order to associate medicinal and possible adverse health effects with the potency of certain phytocannabinoids and other compounds, such as terpenoids [2]. One of the most relevant problems in analytical determinations for QC, especially when there are legal problems related with quantitation, such as for cannabis, relates to the proficiency of laboratories. Both qualitative and quantitative determinations require carrying out of standardized assays that meet the analytical criteria approved by the relevant control authorities.
This review aims to capture the versatility of analytical methods for natural phytocannabinoids profiling in cannabis and cannabis-based products in the past four decades (1980–2021). As such, this thorough overview is first of its kind. Other most recent reviews cover either a shorter time period, i.e., 2002–2016 [1], 2010–2016 [2], 2009–2019 [39], focus on both plant materials and biological matrices [1,39], describe multiple [2] or single (GC) [39] instrumental analytical platforms, omit cannabis-based products [4] or, apart from phytocannabinoids, also include profiling of other bioactive C. sativa constituents [1].
2. Analytical Methods for Phytocannabinoid Profiling
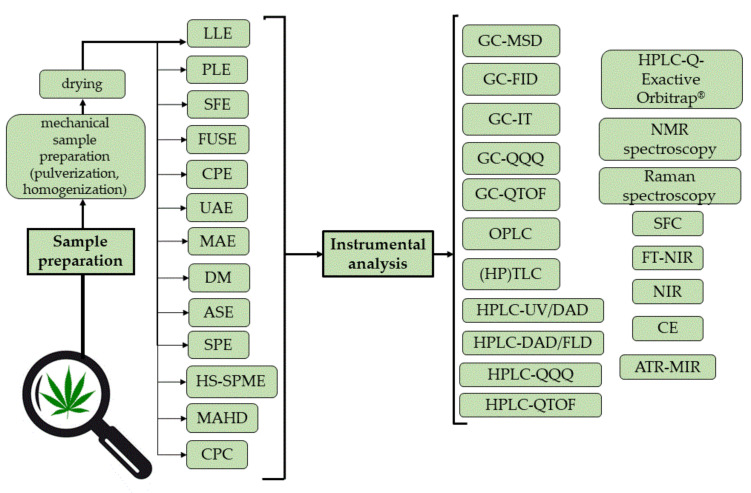
The overview of the analytical methods for phytocannabinoid profiling used in phytocannabinoid profiling of cannabis and cannabis-based products is schematically presented in Figure 2.
Figure 2.
Analytical methods used in phytocannabinoid profiling of cannabis and cannabis-based products.
2.1. Sample Preparation Techniques
Rapid and simple extraction methods are essential for time- and material-efficient high-throughput phytocannabinoid profiling. Optimization of the three key parameters during extraction is crucial for the overall analytical method [40], which are: (1) the granulometry of the solid sample; (2) the system temperature and (3) the affinity of the extraction liquid towards compounds of interest [41]. C. sativa and cannabis-based products are very complex and inhomogeneous matrices, as their different parts may have different cannabinoid profiles due to the variety of phytocannabinoids, terpenes and other volatile compounds and high sugar and fat content. Thus, extraction of phytocannabinoids from plant material and cannabis-based products in an efficient and consistent manner, with acquisition of accurate and reliable potency data can be a challenging task. In addition, there are no standardized preparation procedures for the hemp-based infusions (hemp leaf, hemp-based tea mixtures), and the cannabinoid content could be significantly affected by the infusion preparation procedure [42]. Finally, there is large and unpredictable variability of the average composition as a result of genetic and environmental differences, making the efforts for standardization of sample preparation techniques an ultimatum [43].
Initial steps of sample preparation include mechanical preparation aiming to increase the contact surface between the solvent and the active ingredients. It is of special importance for cannabis plant material, since, despite that most of the active resin is claimed to occur in the superficial glandular trichomes, significant amounts are found in non-glandular tissues. Consequently, immersion of unbroken fresh plant material would give unsatisfactory extraction [44]. Cannabis or its resins are reduced to small pieces by a grater [5] or spatula [45], grinded or pulverized, while cannabis oils are directly proceeded to instrumental analysis.
Manual pulverization and homogenization of the dried plant material can be performed using mortar and pestle [46,47,48,49,50], metal spoon [51] or glass rod [52], by cutting the plant material [53] or crushing and riddling (0.5 mm) [54] or by manual grinder [50,55]. According to the UNODC [5], dried herbal cannabis material and cannabis resins should be pulverized by a cutter (at high revolution speed, i.e., 100 rps) and sieved (mesh size 1 mm). Plant samples can also be homogenized in a crucible [56], in laboratory blender, usually to 60–80 mesh (177–250 µm) particle size, but sometimes a larger (≤335 µm) or smaller (100–150 µm) particle size is required [57,58,59]. Unlike classical, mechanical hand grinders and electrical grinders, some sample preparation methods employ superfine grinding of cannabis plant material [60,61,62]. However, manual grinding with a handheld herb grinder resulted in higher yield of total phytocannabinoids (17.5 ± 0.5%) than with electric blender (12.0 ± 0.3%). The minimization of analyte loss using manual grinder is attributed to the adhesion of cannabis resin to the blades and plastic housing surface of a plastic blender during the high-speed pulverization [50]. Mechanical grinding-activation in an intensity planetary vibrational mill [62,63], ball mill [55], knife mill [64] or freeze mill [65] are also applied. Instead of drying, fresh cannabis plant material can be frozen with liquid nitrogen and crushed [66,67] or frozen, lyophilised at −50 °C and grounded by hand [68] or in a mill [69]. Comparison of coarse homogenization by sieving through a 1-mm mesh and fine homogenization with a ball mill revealed better extraction efficiency for CBDA and THCA for the finely powdered plant material, and no difference for the neutral phytocannabinoids (CBD, Δ9-THC) [55].
In the next step, thermal processing occurs, which aims to remove moisture, usually to 8–13% residual humidity, as recommended by UNODC [5], achieved by drying at room temperature for several days or at 70 °C until the leaves become brittle or, according to EC, within 48 h using any method below 70 °C [70]. Lower drying temperatures should be avoided, as they result in mould growth [71]. Despite this, drying is frequently performed at variety of temperatures and durations, such as at 135 °C, 2 h, 120 °C [72], 103 °C, 4 h [73], 65 °C, 16 h [74] or 48 h [75,76], 60 °C, 12 h [77], 40–50 °C [54], 40 °C,72 h [78], 48 h [17,79] or 24 h [74,80,81], 38 °C, 4–8 h [82], 35 °C, 24 h [83], 30–40 °C, 1–2 days [46], 30 °C [57] on forced ventilation oven, by natural ventilation at 32 °C for 60 h [84], at 30 °C overnight [52] or for 4 h [80] or air-dried at room temperature (20–22 °C) for 24 h [81], for 3 days [44,85], 6 days after harvesting [86], for 4 weeks [87] or until a residual humidity ≤12% is achieved [47].
Dried and mechanically processed samples are extracted using maceration, LLE, PLE, HS-SPME, SFE or FUSE. Other extraction techniques, including ultrasonic assisted extraction (UAE), microwave assisted extraction (MAE), dynamic maceration (DM) and accelerated solvent extraction (ASE), are faster and use less extraction fluids than the “classic” maceration. The number of the consecutive extractions did not have significant effects on total phytocannabinoid yield. Yet, phytocannabinoids yield after sonication was found to be slightly lower than the yield obtained by one-day DM [50]. Phytocannabinoid extraction was omitted in only one study, which, consequently, reported low sensitivity (Table S1); thus difficulties occurred during quantification of trace phytocannabinoidsin cannabis plant tissues [88]. The summary of the properties of the most frequently used sample preparation techniques are given in Table 2.
Table 2.
Sample preparation techniques for phytocannabinoid profiling of cannabis and cannabis-based products.
| Sample Preparation Technique | Advantages | Disadvantages |
|---|---|---|
| LLE |
|
|
| PLE |
|
|
| HS-SPME |
|
|
| SFE |
|
|
| FUSE, UAE |
|
|
| SPE |
|
|
| MHD |
|
|
| CPE |
|
|
| CPC |
|
|
The conventional sample preparation methods for cannabis plant material are maceration and LLE using versatile organic solvents with great affinity towards phytocannabinoids. Although universal and simple, they are time-consuming and not environment-friendly, as they require large quantity of organic solvents.
UNODC recommends maceration prior to GC-flame ionization detector (FID) analysis; 0.2 g dried and homogenized herbal cannabis, 0.1 g cannabis resin or 0.05 g cannabis oil is extracted with internal standard (IS) solution of tribenzylamine in 96% EtOH (0.5 mg/mL) for 15 min in an ultrasonic bath [5]. DAB’s Cannabis flos monograph proposes extraction with EtOH (96%, v/v), while the AHP’s Cannabis inflorescence monograph proposes extraction with MeOH/CHCl3 (9:1, v/v) [33]. EC recommends maceration of 0.1 g semi-fine powdered herbal cannabis with IS solution of 35 mg of squalane/100 mL hexane [70].
The most commonly used solvent and solvent mixtures for extraction of phytocannabinoids from cannabis and cannabis-based products are given in Table 3.
Table 3.
Most commonly used solvents and solvent mixtures in maceration and LLE of phytocannabinoids.
| Solvent/Solvent Mixture | References |
|---|---|
| MeCN | [89,90] |
| MeCN + 1% acetic acid | [65] |
| MeCN saturated with n-hexane | [91] |
| MeOH | [38,42,50,54,56,68,78,79,85,89,92,93,94,95,96,97,98,99,100,101] |
| absolute ethanol (99.7%, v/v) | [10,49,51,53,66,90,102,103,104,105,106,107,108] |
| EtOH(96%, v/v) | [40,54,55,66,90,92,100,109,110,111,112,113] |
| isopropanol | [63,108] |
| cyclohexane | [82,114] |
| EtAc | [69,89,115,116,117] |
| CHCl3 | [44,52,58,77,118,119,120] |
| n-hexane | [40,47,54,66,75,76,78,86,87,101,121,122,123,124,125] |
| light petroleum | [46] |
| petroleum ether | [126,127,128] |
| toluene | [129] |
| benzene | [130] |
| CCl4 (later evaporated and extracts reconstituted in chloroform) | [131] |
| MeCN/MeOH (8:2, v/v) | [132] |
| hexane/isopropanol (9:1, v/v) | [57,94,106,133] |
| hexane/EtAc (9:1, v/v), (7:3, v/v), (6:4, v/v) | [54,57,66,94,104] |
| hexane/CHCl3 (1:1, v/v) | [134,135] |
| MeOH/CHCl3 (4:1, v/v) | [48,136] |
| MeOH/CHCl3 (9:1, v/v), (99:1, v/v) | [57,67,86,106,137] |
| MeOH/hexane (9:1, v/v) | [138] |
| petroleum ether/MeOH (9:1, v/v) | [45] |
| EtOH/H2O (1:1, v/v) | [133] |
| KOH in MeOH and hexane/EtAc (9:1, v/v) | [139] |
| IS (tribenzylamine) in 96% EtOH | [57] |
| IS (tribenzylamine) in MeCN | [140] |
| IS (nonadecane) in EtOH | [138] |
| IS (diphenylhydramine) in EtOH | [74] |
| IS (4-androstene-3,17-dione) in EtOH | [9,137] |
| IS (docosane) in petroleum ether | [128,141] |
| IS (nonadecane) in MeOH/CHCl3 (9:1, v/v) | [67] |
| IS (squalane) in hexane | [76,89,142] |
| IS (chrysene-d12) in hexane | [71] |
| IS (ketamine hydrochloride) in MeCN | [124] |
| IS (4-androstene-3,17-dione) in MeOH/CHCl3 (9:1, v/v) | [9,75,86,87,143,144,145] |
Absolute EtOH is the most preferred organic solvent for maceration and LLE due to its great affinity for phytocannabinoid structure [54,115,146] that leads to high extraction efficiencies. EtOH is, however, known to co-extract significant amount of pigments and ballast from cannabis plant material, much more than CHCl3, enhancing matrix interferences [44]. To avoid this, n-hexane is used [87]. For highly aqueous cannabis-based products, such as coffee beverages, 100% MeCN is preferred LLE solvent [90]. CHCl3 is preferred for extraction of dried glandular plant material (leaves), cannabis resin and reefers (mixtures of tobacco with powdered resin or herbal cannabis), yielding 99% extraction efficiency, much higher than light petroleum [44]. Hexane was found to be the worst performer in terms of recovery of all phytocannabinoids, while EtOH was shown to possess the most appropriate polarity for cannabinoid compounds [40].
Prior to TLC/HPTLC analysis, maceration and/or LLE is the extraction technique of choice. Phytocannabinoids are extracted from cannabis plant material using MeOH, according to Ph.Eur., Ph.Helv. and DAB [34,35,36] and published studies [147], dichloromethane, according to AHP [33], solvent of choice (petroleum ether, MeOH, n-hexane, toluene, CHCl3 and solvent mixtures, e.g., MeOH/CHCl3 (9:1, v/v)), according to UNODC [5]. Prior to maceration/LLE, lactose-containing cannabis products (cream cheese, butter, coffee beverages with milk) require lactase pre-treatment/lactose hydrolysis in order to avoid matrix interferences [90].
Maceration and LLE of semisolid fatty/oily matrices of cannabis-based products, such as butter, margarine, chocolate bars, nonpolar topical ointments and balms requires warming of the samples on a hot plate after addition of the extraction solvent in order to melt the matrix. Prior to maceration/LLE, lactose-containing cannabis products (cream cheese, butter, coffee beverages with milk) require lactase pre-treatment/lactose hydrolysis in order to avoid matrix interferences [90]. For high sugar and carbohydrate matrices including hard candies, honey and fruit preserves, a matrix trapping effect occurs, resulting in the formation of glassy, impervious precipitates which are hard to extract. To avoid this, the aqueous portion of the extractant is added first, followed by warming the matrix in order to dissolve the sugars and carbohydrates, and addition of ACN (to 83–91% final proportion) [90]. Maceration and LLE of cannabis-based products is further aggravated by the presence of glycerine and propylene glycol, especially in oral supplements and vape products. They interfere cannabinoid profiling significantly. High levels of co-extracted glycerine or propylene glycol may swamp the silylating derivatization agents, disabling complete derivatization of CBD to CBD-2TMS, along with undesired side conversion of Δ8-THC and Δ9-THC. The problem can be avoided with CAN extraction, as sugars and glycerine have much lower solubility in ACN than in EtOH [90].
While most of the methods include vortexing, ultrasonication in bath and centrifugation immediately after solvent addition, older methods include immersion, e.g., for 1 h [9,75,121,143,144], overnight [121], 10-days soaking [123], several hours’ maceration [87] or heating near boiling for few hours in solvent, followed by separation of the liquid extract by filtration [108]. Only one study evaluated the shaking time during extraction with MeOH/CHCl3 (9:1, v/v) at room temperature in a range from 10 min to overnight shaking and showed that 20 min of shaking gained sufficient extraction efficiency for Δ9-THC, CBD and CBN [101]. Finally, exhaustive extractions in Soxhlet apparatus are rarely performed [95,117]. In terms of temperature conditions, extraction is performed with highest efficiency at room temperature, with rare exemptions (e.g., at 4 °C) [77], in order to avoid conversion of phytocannabinoids from plant material [1]. If additional heating is required (e.g., when no preliminary decarboxylation was performed), hot extraction (e.g., at 70–78 °C) is performed by sonication [92] or in Soxhlet apparatus [95,117].
After extraction of cannabis plant material, additional filtrationis performed, using sintered glass disc [44], sterile cotton plugs [9,75,143,144], PFTE syringe filters, with 0.22 µm [68,111] or 0.45 µm pore size [56,94,95,108], millipore filter (0.45 µm) [50,84], nylon filters (0.45 µm) [133], membrane filter [49], PVD filter (0.22 µm) [113] or, alternatively, drying on MgSO4 and filtration [67,138]. The insoluble plant material can also be removed by vacuum filtration. The filtered extract is usually dried under nitrogen and dissolved in IS (androst-4-ene-3,17-dione) in EtOH [58,77], or in anhydrous pyridine [119]. Alternatively, IS can be added directly to the supernatant after filtration [44] or centrifugation [10,103,106,111]. As filtration cannot be performed efficiently for cannabis resin extracts due to filter clogging by felt of trichomes and other vegetable debris [44], centrifugation is only performed.
Solvent exchange may also be included as final step, by diluting extracts with solvents and solvent mixtures more similar to the mobile phases employed, in case of (HP)LC analysis. For example, cannabis-infused chocolate is first soaked in IS solutions and isopropyl alcohol, extracted with MeCN + 1% acetic acid and finally diluted with MeCN prior to LC-MS/MS or MeCN/H2O (75:25, v/v) prior to HPLC-UV analysis [65].
Solvent exchange is also performed prior to GC analysis, especially when derivatization is performed [7,80,87,104,121,123,133]. Extracts are reduced to dryness usually under gentle N2 steam, causing least damage to total extracted amounts of phytocannabinoids and terpenoids than drying in rotary evaporator or in a speedvac, the latter reducing the concentrations of Δ9-THC and CBG for two-thirds [66]. Reduced extracts can be dissolved in solvents (e.g., pyridine and benzene [116], CHCl3 [5], MeCN [116], dry EtAc [55]), in a mixture of derivatization agent and solvent (e.g., toluene and BSTFA [94], pyridine and BSTFA + 1% TMCS [118], pyridine, isooctane and MSTFA [99], pyridine and BSTFA [90], pyridine and MSTFA + 1% TMCS [84]) or directly in the derivatization agent [80,99,100,133]. As silylation agents are harmful for GC injection port and column, additional evaporation to dryness is frequently performed, followed by dissolution in solvent, e.g., n-hexane [84] or MeCN [95]. If no derivatization is performed, EtAc [120,126,127] and EtOH [66,123] are the most commonly used solvents for reconstitution prior to GC analysis.
Before instrumental analysis, decarboxylation may be also introduced, initiating thermal degradation of phytocannabinoid acids to neutral counterparts for the purpose of accurate phytocannabinoid profiling and potency examination. Dried extracts are most commonly heated at 150–210 °C for 10–30 min and reconstituted in the same solvent or solvent mixtures [7,52,60,101,128], or, alternatively, at 50 °C for 180 min and then 145 °C for 15 min [69]. A total 15 min of decarboxylation at a temperature range of 120–180 °C showed that maximum yield is achieved at 140–160 °C, with no significant within-range differences [115]. Decarboxylation temperatures higher than 160 °C should be avoided, as Δ9-THC is oxidized to CBN [115] and isomerised to Δ8-THC [87]. However, it is almost impossible for decarboxylation to yield 100%, which initiates significant discrepancies in potency data. Laboratories quantifying the total Δ9-THC as the sum of the Δ9-THC already present in the plant and Δ9-THCA get higher values than laboratories that perform decarboxylation prior to instrumental analysis [115].
Once prepared, cannabis extract should be stored in light-protected conditions, at room temperature, refrigerated at 4 °C [17,48,84,126], at −20 °C [53,103] or at −80 °C [78] prior to instrumental analysis.
HS-SPME is a solvent-free sample preparation method used for analysis of phytocannabinoids in the headspace over solutions or solid samples [5]. Multiple factors affect the extraction efficiency during HS-SPME, including SPME fiber coating, exposure temperature, extraction time and desorption time. Evaluation of the effect of the fiber coating on extraction efficiencies of Δ9-THC, CBD and CBN from herbal cannabis samples showed that among polydimethylsiloxane (PDMS) 100 µm, PDMS/divinylbenzene (PDMS/DVB) 65 µm, Carboxen®/PDMS and divinylbenzene/Carboxen®/PDMS (DVB/Carboxen®/PDMS) 50/30 µm, PDMS 100 µm performed optimally in general, although the PDMS/DVB fiber provided higher extraction efficiency for CBD, due to its higher polarity and affinity to PDMS/DVB. Among the three exposure temperatures (80 °C, 90 °C, 150 °C), 150 °C was optimal, simultaneously promoting volatilization and decarboxylation [59,148]. Extraction time depends upon matrix viscosity and lipophilicity that define the speed of diffusion of analytes from the liquid to the gas phase and, as a result, HS-SPME rate and efficiency. HS-SPME is more appropriate for simpler matrices (e.g., cannabis tea), as the extraction recoveries are proportional to the sample amount [99], while complex liquid- and protein-containing matrices cause significant matrix retention and lower recoveries, with higher LODs and lower method precision. For fatty/oily matrices, such as versatile hemp foods, alkaline hydrolysis with NaOH and Na2CO3 is performed prior to HS-SPME in order to saponify the matrix lipids and reduce lipid matrix interferences [99]. Therefore, extraction time varies depending upon the sample matrix, from 10 min for herbal cannabis [59,148] to 25 min for different hemp food products [99]. Finally, desorption time depends upon analytes’ lipophilicities [148]. It is superior to LLE (n-hexane/EtAc (9:1, v/v)) in terms of chromatographic peak shape and matrix interferences, despite the good agreement of achieved LODs in food samples [99].
SFE uses supercritical fluids (SCFs) and liquefied gases as green solvents for extraction and fractionation of complex samples. SFE offers low solvent consumption and ensures stability of thermolabile and light-sensitive compounds. For the purpose of phytocannabinoid profiling, SFE is rarely used in sample preparation; its main purpose is to separate the aromatic fraction for further analysis. It is usually performed using supercritical CO2 (SC-CO2) as attractive SCF with solvent strength tuned by sensitive changes in temperature and pressure above the critical point (31.1 °C, 73.7 bar), conditions that are experimentally easy to reach [4], along with the low cost, short processing time and low environmental impact [149]. However, SC-CO2 is a low polarity solvent that poorly dissolves phytocannabinoids; therefore, employment of co-solvent, usually H2O, alcohols and acids, to improve the overall extraction rate of phytocannabinoids is required. EtOH (5–20% in CO2) is most commonly used co-solvent, added in constant flow [40,43,143,150,151] or in pulses [143]. Higher SC-CO2 pressures offer lower extraction selectivity, but high initial extraction rate, apparent solubility and total yield, which are also a function of temperature, exposure time and phytocannabinoid content of the plant material [143]. A 90–94% extraction yields for Δ9-THC, CBD and CBN are achieved at 100 bar, 35 °C and 1 mL/min flow during 10 min [43,150]; at 340 bar, 55 °C and 200 g/min maximal yields up to 92% are reported [143], along with satisfactory yields at milder conditions, (37 °C, 250 bar). Extraction efficiency was further improved by washing of the extract with fresh SC-CO2 and addition of a cold separator (separating chamber) immediately after the sample containing chamber [149].
When compared to DM, UAE and MAE with same extraction solvent (EtOH) in same w/v ratio to sample, no significant difference existed between SFE and UAE, with the lowest extraction yields for CBD, CBDA and CBGA. DM and MAE showed higher yield for CBD and CBGA, but DM was selected as the optimal sample preparation technique (EtOH, room °C, 45 min). In case of MAE, increased CBD yield was accompanied by decreased CBDA yield, suggesting partial decarboxylation due to high extraction temperature [142].
FUSE is used for phytocannabinoid extraction from herbal cannabis, employing cyclohexane/isopropanol (1:1, v/v) in an ice-water media in order to avoid degradation and solvent evaporation, followed by centrifugation and filtration through 0.45 µm nylon filter [43]. FUSE is slightly more efficient than SFE for extraction of Δ9-THC, CBD and CBN, as 80% of the phytocannabinoids are extracted at the first extraction, while <40% are extracted after the third extraction with pure SC-CO2, and more than 90% are extracted with the first extraction in the presence of co-solvent. Therefore, adding the ability of SFE to separate terpenes from phytocannabinoids, and therefore minimize matrix interferences, SFE was selected as more optimal sample preparation technique [43].
PLE is one of the fastest and most efficient extraction techniques for plant metabolites. High extraction yields are achieved under pressure, using the extractant at a temperature above its normal boiling point, thus increasing its diffusion into the plant matrix. PLE on herbal cannabis is performed using n-hexane as extraction solvent at 100 °C and 40 bar for 15 min. MeOH and n-hexane are found equally efficient for Δ9-THC and CBN, but not for Δ9-THCA, as it is less soluble in n-hexane [95]. PLE with hot water, i.e., pressurized hot water extraction (PHWE) is used to yield CBD-rich extracts while supressing the THC and CBN content. Here, decarboxylation is performed in situ, i.e., in the extraction cell, heated in the oven prior to the dynamic extraction [80].
SPE with QuEchERS is used for purification of honey extracts, with high recoveries for CBDA, CBGA, Δ9-THCA, CBG, CBD and Δ9-THC and low intra- and inter-day variability. The method was more efficient than UAE with H2O at 40 °C, yielding homogeneous solution with no phase separation or solid residues, followed by extraction of phytocannabinoids from the aqueous phase through LLE with n-hexane or EtAc, observing higher phytocannabinoid yield in n-hexane extracts [40]. QuEChERS is also used for purification of MeCN extracts of hemp seeds, hempseed oil, hemp proteins, raw and skimmed milk, coffee and chocolate, using reaction mixture of MgSO4/NaCl/C6H5Na3O7 × 2H2O/disodium hydrogen citrate sesquihydrate (4:1:1:0.5, w/w); with further supernatant dilution with MeCN/H2O (1:1) or with H2O. d-SPE with MgSO4, different combinations of C18, primary secondary amines and zirconia-coated silica sorbents were also evaluated. When PSA is used, cannabinoids were trapped by interactions with amines, resulting in low recoveries; other combinations achieved satisfactory extraction [144].
Cloud point extraction (CPE) involves employment of non-ionic surfactant, salt (Na2SO4) and deionized water to extract Δ9-THC from cannabis resin using heating (40–90 °C) and centrifugation. Despite the low extraction efficiency (60%), CPE offers many advantages, such as the possibility of extraction and pre-concentration of analytes in a single, solvent-free step and avoidance of analyte loss during solvent evaporation [145].
Centrifugal partition chromatography (CPC) is a liquid-liquid partitioning technique in which the stationary phase is immobilized by centrifugation force, while the mobile phase is pumped through at high flow rates. Compounds are separated based on the differences in partition coefficients. CPC allows large-scale extraction of phytocannabinoids, i.e., Δ9-THC, CBD, CBN, CBG, Δ9-THCA, CBGA and CBDA with high efficiency (>90%) from herbal cannabis material using two-phase system n-hexane/MeOH/H2O with 25 mM formic acid (5:3:2, v/v/v) for Δ9-THCA, CBGA and CBDA and hexane/acetone/MeCN (5:2:3, v/v/v) [87].
Microwave-assisted hydrodistillation (MAHD) can provide a volatile hydrodistillate that is rich in monoterpenes, sesquiterpenes, and a small amount of phytocannabinoids. The optimized MAHD procedure in a pilot-scale reactor yielded 0.35 ± 0.02% w/w of hydrodistillate, while conventional hydrodistillation gave only 0.12 ± 0.01%, w/w (in relation to dry inflorescence mass). During MAHD, phytocannabinoid decarboxylation inside the residual matrix was around 70% (69.01 ± 0.98% and 74.32 ± 1.02% for THC and CBD respectively) [146]. In other studies, MAHD resulting essential oils are dominant in CBD content (2.11–20.06 mg/g); interestingly, the essential oils from dried plant material also contain CBDV, CBL and cannabicitran (CBT) [152].
2.2. Instrumental Analysis
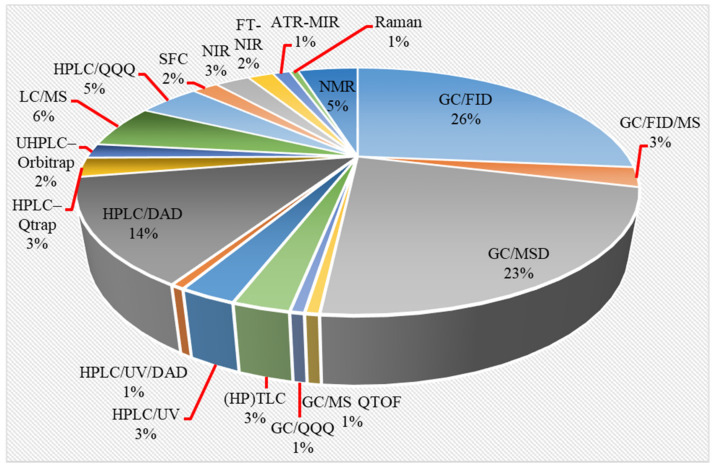
Influenced by the intense scientific and technological development in regard to C. sativa cultivation, analytical platforms for phytocannabinoid profiling in cannabis and cannabis-based products have intensively evolved over the last four decades (Figure 3). GC- and LC-based methods as most commonly used, have achieved comparable accuracy, selectivity, linearity, sensitivity and precision in phytocannabinoid profiling and are both used in routine and investigational analysis of cannabis and cannabis-based products.
Figure 3.
Prevalence of analytical techniques used for phytocannabinoid analyses.
Despite the lack of standardization process for analysis of phytocannabinoids omitting the comparison of reliability of measurement among analytical platforms, a recent interlaboratory study concluded that GC-MS is the most accurate and robust analytical method for phytocannabinoid profiling, performing much better than GC-FID and UHPLC-MS/MS [55].
The advantages and disadvantages of the most frequently used analytical techniques for analysis of cannabis and different products are given in Table 4.
Table 4.
Analytical techniques for phytocannabinoid profiling of cannabis and cannabis-based product.
| Analytical Techniques | Advantages | Disadvantages | Note |
|---|---|---|---|
| GC-FID |
|
|
|
| GC-MSD |
|
|
/ |
| GC-QQQ/QTOF |
|
/ | / |
| (HP)TLC |
|
|
|
| HPLC-UV/DAD |
|
|
/ |
| HPLC-QQQ |
|
|
|
| HPLC-Q-Exactive Orbitrap® |
|
||
| SFC |
|
|
/ |
| NMR |
|
|
/ |
| RAMAN |
|
/ | / |
| FTIR, NIR, MIR |
|
|
/ |
2.2.1. GC-Based Methods
GC coupled to versatile detectors and mass analyzers is one of the oldest, but still the most preferred and researched analytical platforms for phytocannabinoid profiling in both plant material and biological matrices due to its robustness, reproducibility, sensitivity and speed [1,42,58,153]. As such, GC methods are officially employed by authorities for phytocannabinoid profiling [1], including the predominant phytocannabinoids (Δ9-THC, CBD and CBN) and quantification of Δ9-THC/CBD ratio. This analytical platform is also used for terpene profiling, pesticide screening and residual solvents analysis, which affords potential benefits to regulatory bodies and cannabis industry [39].
By combining short columns, fast oven temperature ramps, high carrier gas linear velocities, narrow columns, hydrogen carrier gas and low film thickness, fast and robust GC methods are generated, appropriate for phytocannabinoid profiling in both research and monitoring purposes [39]. The access to the well-established MSLs, such as the National Institute of Standards and Technology (NIST) Mass Spectral Library and the Wiley Registry Mass Spectral Library eases compound identification through GC-MS analysis. Here, phytocannabinoids identification is performed by comparison of acquired MS or MS/MS spectrum to spectra present MSLs, and further confirmed by analysis of analytical standards. Although the main employment of GC-based platforms is for profiling of terpenes, it has been extensively used for phytocannabinoid profiling as well (Table S1).
Derivatizationof Phytocannabinoids
First action, after injection of the sample in the injector port of the GC (regardless of employed detector), is vaporization that is achieved at temperature ranges 250–290 °C and causes in situ decarboxylation of acidic phytocannabinoids (Δ9-THCA, CBDA, CBGA) to the corresponding neutral phytocannabinoids (Δ9-THC, CBD, CBN) prior to chromatographic separation. Thus, acidic and neutral phytocannabinoids are not distinguishable, but rather the result is the sum of neutral cannabinoid present in the extract and neutral cannabinoid generated during decarboxylation. The issue is of no concern for studies aiming to quantify total THC (Δ9-THC and Δ9-THCA) levels, as it is the case with most of the GC-based studies included in this review without prior derivatization [9,17,18,45,47,48,49,52,54,56,58,59,63,67,72,73,74,75,76,79,81,82,85,86,89,93,96,98,101,102,103,105,108,115,121,122,123,124,128,138,139,141,148,150,152,154,155,156,157,158,159,160] (Table S1). However, derivatization is of great importance for studies aiming more thorough phytocannabinoid profiling. In order to prevent their degradation and achieve profiling of the native chemical constitution of the cannabis material, a reaction of derivatization has to be performed prior to GC analysis. In such a way, derivatization improves the limited volatility and thermal stability of phytocannabinoids, and thus their amenability to GC analysis, which further improves peak shape, peak resolution (especially for CBC and CBD) and sensitivity [161]. This comes at the price of increased analyses cost, duration [2] and measurement uncertainty, as derivatization yields are sometimes highly variable and seldomly obtain 100% for phytocannabinoids [23,91,122], making quantification results speculative.
Silylation is the most common derivatization reaction performed. It involves substitution of a hydrogen atom that is bound to a hetero atom (such as -OH, -COOH, -NH2, =NH, and -SH) by a silyl group, i.e., a trimethylsilyl (TMS) or tert-butyldimethylsilyl group (TBDMS). The resulting TMS/TBDMS derivatives have lower polarity and increased thermal and catalytic stability and GC amenability. However, they can be thermally degraded in injector port and/or column system [162].
Versatile silylation agents are used, ordered by reactivity: hexamethyldisilazine (HMDS) [88], N-methyl-(trimethylsilyl) trifluoroacetamide (MSTFA) [153], N, O-bistrifluoroacetamide (BSTFA) [90], alone or accompanied by a catalyst, usually 1% trimethylchlorosilane (TMCS) [58,99,100,123,124,133] for TMS derivatization and N-tert-butyldimethylsilyl-N-methyltrifluoroacetamide (MTBSTFA) alone or with 1% tert-butyldimethylchlorosilane (t-BDMCS) as a catalyst for TBDMS derivatization. A study comparing the derivatization efficiency of different alkylsilylation agents, HMDS + trifluoroacetic acid (TFA), MSTFA, activated MSTFA, MSTFA + 1% TMCS, BSTFA, BSTFA + 1% TMCS, MTBSTFA and MTBSTFA + 1% t-BDMSC, using pyridine as additional catalyst for CBC, CBD, CBG, CBN, Δ9-THC and Δ9-THCA in standard solutions and plant matrix concluded that maximum responses are obtained with HMDS + TFA. Responses were not influenced by catalysts, as well as reaction solvent (pyridine, EtAc, MeCN) [88]. Other less frequently exploited derivatization is methylation of the hydroxyl groups of the phytocannabinoids using trimethylsulfonium hydroxide (TMSH) [97]. Formation of alkylboronate-TMS derivatives using alkylboronic acid and BSTFA + TMCS showed that methyl- and n-butylboronates yielded derivatives that were stable for several weeks at 4 °C had improved GC peaks when compared to TMS derivatives, and MS characteristics, with preserved fragmentation patterns of the underivatized compound [116].
GC Columns
Various GC-based methods became popular and widely used during the 40-year span of phytocannabinoids profiling (Table S1). E.C. recommends use of glass capillary column 25 m long and 0.22 mm wide, impregnated with 5% non-polar phenyl-methyl-siloxane phase, that would allow good separation of phytocannabinoids [70]. Older GC-based methods employ glass columns packed with 2% OV-17 on Chromosorb WHP (mesh 100–120) [119], 2% OV-17 on 100–200 mesh GasChrom Q) [98,123,140], 2% OV-17 [58] and glass column packed with 3% SE-30 on 100/200 mesh Gas Chrom Q [116]. Later, they were replaced by capillary columns with cross-linked and bonded stationary phases with various polarity. Here, analytes are separated based on differences in polarity, molecular mass and boiling point. As most frequently, phytocannabinoid profiling studies are focused on the most prominent phytocannabinoids, that are Δ8-THC, Δ9-THC, CBC, CBD, CBDA, CBDV, CBG, CBGA, CBN, Δ9-THCA and THCV. They contain aromatic, alkyl and alcohol moieties; it is expected that the proportion of phenyl groups in mixed dimethylpolysiloxane-silphenylene or mixed dimethylpolysiloxane-dimethyl-dimephenyl stationary phases to have an impact on their chromatographic separation. Wide employed thin-filmed capillary columns with non-polar stationary phases are used, such as 5%-diphenyl-dimethylpolysiloxane columns, including HP-5 (for FID) or HP-5MS (for MS) [50,52,57,58,62,70,85,89,91,94,101,103,104,126,133,141,142,154,156], DB-5MS [9,99,108,128,151,163,164], Rxi-5MS [73], Mega-5MS [146], BP-5 [45], RTX-5 [94,161], MDN-5S [91], SE-52 [128], ZB-5 [95], Zebron ZB-5HT Inferno [102] and SLB-5MS [152]. 100% dimethylpolysiloxane columns, such as HP-1 [10,109,112,165], SPB-1 [85], OV-1 [74] and DB-1 [17,23,75,77,84,144,148] are preferred for more successful separation of CBC and CBD, apart from all other phytocannabinoids, or are used only for separation of CBC and CBD [10,109,112]. Such columns are appropriate for analysis of CBDV, THCV, CBD, CBC, Δ8-THC, Δ9-THC, CBN but not for CBG [163]. Simultaneous injection on two column with different polarities, i.e., a medium-polar (HP-50+) and non-polar column (DB-1MS) is another option for better separation of CBC and CBD [18].
Columns with intermediate polarity, such as Rxi-35Sil MS [90] and DB-35MS [163] (35% (-phenyl)methylpolysiloxane) and Zebron ZB-624 (6%- cyanopropyl-phenyl, 94-dimethylpolysiloxane) [106] are also used for cannabinoid separation. Rxi-35Sil MS may offer slightly wider retention window than a 5% silphenylene phase (DG-5MS) and 5% diphenyl phase (HP-5MS) [90]. However, columns with 35% (phenyl)methylpolysiloxane stationary phase might produce multiple peaks for CBC, one of which coeluted with THCV. Low to mid-polarity columns, such as DB-170 (14%-cyanopropyl-phenyl)-methylpolysiloxane) are not appropriate, as they produce low responses, distorted peak shape and tailing [163]. Despite this, the nonpolar 100% dimethylpolysiloxane column DB-1HT was used for successful separation of Δ9-THC, CBD, CBC, CBN and other minor cannabinoids, along with terpenes, sesquiterpenes, sterols, diglycerides and triglycerides [166].
GC Detectors
A large proportion of the profiling studies employ FID [10,17,49,52,55,56,58,70,73,74,75,76,79,82,85,93,94,95,96,98,101,102,103,106,108,115,118,119,138,141,157,158,159] or dual FID [9,75,121,144]. FID offers more accurate quantitative response with respect to MS, but at the price of lower sensitivity and specificity. The need of analogue analytical standards only makes FID low-cost and simpler analyzer when compared to MS, which needs the use of the corresponding deuterated analytical standards [1]. Moreover, GC-FID methods are more robust than GC-MS methods both in full scan and SIM mode [107]. However, due to its inability to discriminate CBD and CBC, FID is often replaced by MS detectors for more thorough cannabinoid profiling.
GC-MS is the most researched analytical platform for cannabinoid profiling to date [1,42,153,167]. Electron impact ionization (EI) is the most commonly used ionization technique in cannabinoid profiling, while others, i.e., chemical ionization (CI) in positive/negative mode and atmospheric pressure ionization (API) are preferred in forensic analysis of phytocannabinoids in biological samples. Mass selective detector (MSD) [45,47,49,55,59,74,81,86,89,90,94,96,121,122,123,124,128,139,146,148,154,160,166], single quadrupole (Q) [57,66,76,163] and triple quadrupole (QQQ) are the most frequently used configurations. Improved sensitivity, specificity and reproducibility, with reduced noise level and interferences are achieved by monitoring specific ions (selected ion monitoring, SIM mode, MSDs and Qs) or fragmentation reactions (multiple reaction monitoring mode, MRM mode, QQQ), then using the analyzers in scan mode. Ion trap (IT) is seldomly used [23,70,151], despite its advantageous ability to acquire structural information by higher fragmentation (MS3, MS4 … MSn). Quadrupole-time-of-flight (Q-TOF) mass analyzer is rarely used for quantification purposes, but rather for untargeted cannabinoid profiling of C. sativa extracts [78]. Rarely, FID and Q are simultaneously used by installing a “Y” splitting unit at the column outlet [152]. Finally, a novel variation of GC-EI-MS, cold EI, based on interfacing GC and MS with supersonic molecular beams (SMB) in a fly-through ion source was recently successfully employed for an inaccurate, sensitive, reproducible and comprehensive full (including phytocannabinoid) profiling of herbal cannabis extracts [166].
A relatively novel GC-based analytical platform employs analyser based on vacuum UV (VUV) operating in the UV/VUV spectral range (120–240 nm). UV/VUV absorption events are very sensitive for differentiating isomers (positional isomers and diastereomers). This, together with the ability to deconvolute overlapping spectra [4], which significantly shortens analysis time, makes GC-UV/VUV potentially favourized analytical platform over GC-MS. Almost all phytocannabinoids exhibit maximum absorbance in the region 170–200 nm, with no overlap among different phytocannabinoids and significant spectral differentiability. This is especially important for CBC and CBD. However, this method reports high LODs and, thus, cannot be employed for phytocannabinoid profiling in biological matrices and cannabis-based products, but is sufficiently sensitive for plant matrices [161].
Two-dimensional (2D) gas chromatography (GC × GC) is reported to offer better chromatographic resolution of phytocannabinoids [11,56,150,160]. Despite this, it is rarely used for phytocannabinoid profiling; chemical fingerprinting and classification are more commonly performed GC x GC is usually coupled to MS [56,160] or to FID/MS [150]. Combination of columns of different polarity is used, as, for example, 100% dimethylpolysiloxane and polyethylene glycol in sol-gel matrix [56], or a non-polar column (e.g., DB-5 or HP-5MS) for first-dimension separation and medium-polarity column (e.g., DB-17) in the second dimension [150,160].
2.2.2. LC-Based Methods
LC-based methods are recently becoming methods of choice for qualitative and quantitative phytocannabinoid profiling. The simplified sample preparation and the low temperatures, high pressure and high flow rates used during TLC, HPTLC, HPLC and UHPLC, and the recently emerging supercritical fluid chromatography (SFC) analysis allow sample preservation without decarboxylation and decomposition, reliable separation of neutral and acidic phytocannabinoid species and, thus, direct identification and quantification of both neutral and acidic forms of phytocannabinoids in the extracted samples [18,165]. The simplified sample preparation methods, along with avoidance of analytes loss favourized LC over GC in cannabinoid profiling [66].
TLC and HPTLC Methods
TLC is an attractive method for analyses of herbal drug constituents [168], and especially suitable method for the purpose of preliminary semi-quantitative screening of cannabinoid content in routine tests [164]. It is method of choice for identification of cannabis flowers in all Cannabis flos monographs (DAB, AHP, Ph.Helv., Ph.Eur.) [33,34,35,36] and DAB’s Cannabis extractum normatum monograph [38]. Using TLC, cannabinoid identification is performed by comparing retardation factors (RFs) of analytes with RFs of standards on a TLC plate developed with appropriate mobile phase, whereas visual evaluation is obtained by dipping or spraying the TLC plate into/with the appropriate visualization reagent under UV light, or under daylight. In DAB [36] and Ph.Eur. [35] analytical monographs of cannabis flower, a MeOH extract of 0.1 g pulverized drug is identified by comparison of RFs of analytes to reference solutions of CBD and Δ9-THCA (5 mg each) in MeOH. Solutions are applied on TLC C18 silica gel F254 plate (2 to 10 μm) and developed with H2O/glacial acetic acid/MeOH (15:15:70, v/v/v). After air drying, the TLC plate is sprayed with vanillin reagent, dried at 100–105 °C for 15 min and examined on daylight. Identical procedure applies to Cannabis extractum normatum according to DAB [38]. Ph.Helv. includes filtration of MeOH extract of cannabis flower through membrane filter (0.45 μm) as an additional step prior to application to the C18 silica gel F254 plate and reference solution of CBDA in MeCN and Δ9-THCA in 2-isopropanol, following the identical procedure for development and detection [34]. AHP’s cannabis flower monograph employs TLC C18 F254 plate with MeOH/H2O with 1% glacial acetic acid (75:25, v/v) as a mobile phase for identification of CBC, Δ9-THC, CBN, CBG, CBD THCV, Δ9-THCA and CBDA in dichloromethane extract of 0.1 g pulverized drug. Visualization is performed using Fast Blue reagent and vanillin/H2SO4 under UV (254 nm) [33]. UNODC suggests maceration in ultrasound bath with 10 mL of solvent (MeOH, petroleum ether, n-hexane, toluene, CHCl3 or solvent combinations–MeOH:CHCl3 (9:1, v/v) for 15 min at room °C, using three systems for elution of HPTLC silica gel plates (A: petroleum ether 60/90/diethyl ether (80:20, v/v); B: cyclohexane/di-isopropyl ether/diethylamine (52:40:8, v/v) and C (for cannabinoid acids): n-hexane:dioxane/MeOH (70:20:10, v/v)). Fast Blue reagent BB or RR in MeOH or MeOH:H2O is used as spaying reagent using visualization method 1 or method 2 [5].
The accuracy, repeatability and the acceptable LODs and LOQs in the linear dynamic range of this methodology makes TLC methods attractive for fingerprinting cannabis [4]; however, such parameters are fairly low compared to the more sophisticated LC analytical platforms. The “classic” TLC became further less utilized due to its inconvenience to document for peer review, poor resolution due to systematic errors rising from hand-spotting, temperature/humidity control and imprecise RF measurement [167,169].
Recent advances in TLC are in the development of HPTLC methods. Such reliable methods could offer advantages over both HPLC and GC techniques for cannabis profiling, including its ability to analyse multiple samples simultaneously and the consequently lower running costs and analysis runtime. Further, automation of sample application in HPTLC methods eliminate systematic errors, provide better resolution and generate reports for more convenient documentation for peer review of casework [170]. In that spirit, normal-phase HPTLC with an automated spotter is shown to achieve better separation than TLC for the main neutral phytocannabinoids. The method is comparable within a small degree of error (±0.5%) to a validated HPLC method [110].
Older methods use plates spread with a layer of a slurry of alumina/CaSO4/H2O (22.0 g:3.0 g:50 mL), activated at 110 °C for 30 min and stored under anhydrous CaCl2 [131], silica gel G plates [129], precoated silica gel G plates [171] and silica gel G layers impregnated with dimethylformamide [120]. Reverse phase (RP)-TLC is performed using RP-18 HPTLC plates [129] and RP-C18 bonded silica gel F plates [18]. The more recent TLC/HPTLC methods most commonly use HPTLC silica gel 60 F254 plates for successful separation of 11 phytocannabinoids (Δ9-THC, CBD, CBN, CBC, THCV, Δ8-THC, CBDV, CBG, CBGA, CBDA, Δ9-THCA) [127] or of Δ9-THC, CBD, CBN and CBG [172], or for separation of Δ9-THC, CBD and CBN only [125], silica gel 60 [110], silica gel 60F [135] or silica gel plates [5,126]. For some methods, for instance, the type of TLC plate was not clearly defined [130,147].
Most suitable mobile phases include xylene/hexane/diethylamine (25:10:1, v/v/v) [127], CHCl3, with plate prewashing with MeOH [110], hexane/diethyl ether (80:20, v/v), which allowed clear separation between Δ8-THC, Δ9-THC, CBD and CBN [125], cyclohexane/toluene/diethylether (75:15:10, v/v/v) [126], benzene/n-hexane/diethylamine (25:10:1, v/v/v) [130], benzene/chloroform (50:50, v/v) [131], diethylether/petroleum ether (1:4, v/v) [120], benzene/n-hexane/diethtylamine (25:5:0.5, v/v/v) [147], n-hexane/CHCl3/dioxane (89:8.75:2.25, v/v/v) [135], benzene, benzene/n-hexane (6:4, v/v), benzene/n-hexane/diethylamine (70:25:5, v/v/v) [129], MeOH/dioxane/hexane (1:2:7, v/v/v), hexane/EtAc (4:1, v/v), hexane/diethylether (4:1, v/v) [171], hexane/ethyl ether (8:2, v/v) [172], petroleum ether/deithylether (8:2, v/v), cyclohexane/diisopropyl ether/deithylamine (52:40:8, v/v/v) or n-hexane/dioxane/MeOH (7:2:1, v/v/v) [5]. For 2D TLC, first n-heptane/dichloromethane/butan-2-one (83:5:12, v/v/v) was used for first and n-hexane/acetone (86:14, v/v) for second development after 90° rotation [129]. RP-TLC employs MeCN:H2O (9:1, v/v) [129] or MeOH/5% acetic acid (19:1, v/v) [18] as mobile phase.
Evaluation of 10 mobile phases (hexane/diethylether (80:20, v/v), toluene, n-heptane/diethyl ether/formic acid (75:25:0.3, v/v/v), CHCl3, hexane/acetone (87:13, v/v), benzene, xylene/hexane/diethylamine (25:10:1, v/v/v), 4–8% diethyamine in toluene, MeOH/H2O with 0.1% glacial acetic acid (75:25, v/v) and hexane/acetone (75:25, v/v) on Silica gel 60 F254 plate showed that xylene/hexane/diethylamine (25:10:1, v/v/v) allows most precise bands and best separation of Δ9-THC, CBD and CBN, but without migration of Δ9-THCA, CBDA and CBGA. The cannabinoid acids were successfully separated using n-heptane/diethyl ether/formic acid (75:25:0.3, v/v/v) on C18 F254 plate and EtOH/H2O with 0.1% glacial acetic acid (75:25, v/v) on RP-C18 F254 plate [127]. Another study showed that, when using alkanes as eluents (isooctane, heptane, hexane and pentane/diethylether (90:10, v/v), the capability to separate Δ9-THC, CBD and CBN decreased as the length of the carbon-bearing chain increases [125].
Visualization of (HP)TLC plates is usually performed using 0.1% aqueous solution of Fast Blue B salt reagent [110,125,126,127,130,147], alone, under white light (254 nm and 366 nm) [127], under UV (254 nm) [131], as solution in 0.1M NaOH [5] or under UV (206 nm) [110] or as 0.5% aqueous solution, followed by 0.1M NaOH [23,125,173]. Prior to Fast Blue B, diethylamine can be applied (50 mg·L−1 H2O + 20 mL MeOH) [5]. RP-TLC plates are visualized using Fast Blue B in 0.1M NaOH or in 50 g·L−1H2O/acetone (9:1, v/v) [129]. Fast Blue RR was better for visualization of Δ9-THC, CBD, CBG and CBN than Fast Blue B salt [172]. As qualitative evaluation for the presence of cannabinoids during (HP)TLC analysis is based on color determination, it is often subject of analysts’ erroneous determination. Recent studies made the pioneering efforts in developing a method for standardizing and naming colors using the Sci-Chromus® software, that significantly reduced the subjectivity of the color names in identifying Δ9-THC, CBD, CBN and CBG in cannabis extracts [172].
Apart from TLC and HPTLC, other planar chromatography methods are seldomly used, such as optimum performance laminar chromatography (OPLC) and automated multiple development (AMD) for phytocannabinoid profiling, despite their greater reproducibility due to complete automation. Moreover, OPLC offers extension as semipreparative technique for sample purification, while AMD offers best resolution. The only reported employment of OPLC in AMD in cannabinoid profiling is in hexane extracts of cannabis resins (dried and reconstituted in toluene) and in hexane extracts of cannabis resin. OPLC was performed for determination of Δ9-THC, CBD and CBN on HTSorb BSLA 011 and HT Sorb BSLA 003 columns using isooctane/diethylether (90:10, v/v) as eluent. Semi-preparative OPLC was performed for isolation of CBD from cannabis resin using hexane/diethylether (80:20, v/v). Using AMD, separation was performed on HPTLC with the elution gradient 1C acetone (100, v/v), diisopropylether (100, v/v), hexane (100, v/v), hexane (100, v/v) and hexane (100, v/v) during 20 steps. For both OPLC and AMD, visualisation is performed with Fast Blue B salt reagent [125].
HPLC Methods
The HPLC technique is gaining popularity as the main choice for fingerprinting study for the quality control of herbal drugs [174], thus enabling chemical characterization of herbal medicines [175]. HPLC methods offer larger linear ranges and more consistent calibration curves for all phytocannabinoids in regards to GC-based methods [163]. In terms of reliability, reproducibility and sensitivity, it was shown that high-resolution GC/FID and HPLC-UV methods for quantification of Δ9-THC, CBD and CBN are comparable [98].
HPLC Mobile Phases
Most of the mobile phases used in HPLC/DAD analysis of phytocannabinoids consisted of buffered aqueous solutions of ammonium acetate [176], ammonium formate [83,142], formic acid [11,40,50,60,61,62,63,78,173,177,178,179,180,181,182], acetic acid [19,183,184], o-phosphoric acid [165,185] or 5% MeCN/80% MeCN with 0.1% o-phosphoric acid [69]. Acidic conditions are preferred for cannabinoid acids (Δ9-THCA, CBDA, CBGA).
Pharmacopoeial methods (DAB, Ph.Helv., Ph.Eur.) for assay of Cannabis flos and Cannabis extractum normatum focus on the five main phytocannabinoids: CBDA, CBD, CBN, Δ9-THC and Δ9-THCA using aqueous solution of 85% o-phosphoric acid and MeCN as mobile phases [34,35,36,38]. AHP’s Cannabis flos monography recommends identical mobile phases for quantification of the major phytocannabinoids (Δ9-THCA, Δ9-THC, CBD, CBDA, CBG, CBGA and CBN) (Table S2) [33].
Binary mobile phase system consisted of H2O/MeOH (10:90, v/v) [186], H2O/MeOH (17/83, v/v) [187] and H2O + 0.1% formic acid/MeOH + 0.1%; formic acid is most commonly used for phytocannabinoid profiling [11,63,65,147,185,188]. Other binary systems that provide good peak shape and improved resolution are also used, such as H2O + 0.1% formic acid/MeCN + 0.1% formic acid [40,55,64,80,109,134,144,182,183,185,188,189], H2O + 0.1% TFA/MeOH + 0.1% TFA [68], MeCN/H2O (75:25, + 0.05% formic acid, v/v)/isopropanol:MeCN (80:20 + 0.05% formic acid, v/v) [183,184], 5% MeCN + 0.1% formic acid/MeCN + 5% H2O + 0.1% formic acid [78], H2O + 0.1% formic acid/MeCN [27,63,185], 5% MeCN + 0.1% formic acid/80% MeCN + 0.1% formic acid [69] and MeCN/H2O + 0.85% phosphoric acid [42].
Other buffering solutions are less frequently used, such as 0.1% acetic acid in a tertiary system, e.g., H2O + 0.1% acetic acid/MeCN + 0.1% acetic acid/MeOH [19], MeCN/0.5% acetic acid (66:34, v/v) [190], ammonium formate in a binary system MeOH/H2O + 50 mM ammonium formate (pH 5.19) [83], 5 mM ammonium formate + 0.1% HCOOH/MeCN + 0.1% HCOOH [65,100] or 5 mM ammonium formate/MeCN + 0.1% HCOOH [92].
Decrease in buffer concentration from 50 mM to 25 mM eliminated baseline drifting, thus avoiding decrease in UV absorption. As ammonium formate causes co-elution of Δ9-THCA with CBG, it is preferably replaced by ammonium acetate (25 mM, pH 4.75), which offers more reproducible, reliable and rugged chromatographic separation, especially between CBG and Δ9-THCA with improved peak shape and, thus, sensitivity. Better reproducibility is achieved using H2O/MeCN (15:85, v/v) + 50 mM phosphoric acid than with 0.1% formic acid as buffering solution [185]. Fast separation of 10 phytocannabinoids in less than 8.5 min using binary system H2O + 0.085% phosphoric acid/MeCN + 0.085% phosphoric acid as mobile phase was achieved, that, together with employment of RP-C18 column prevented co-elution of CBD and THCV and both isomers, Δ9-THC and Δ8-THC [165]. Another, less frequently used buffer is triethylammonium phosphate (TMAP) in MilliQ, with MeCN in isocratic elution programme [191].
HPLC Columns
The multitude of LC-based methods for phytocannabinoid profiling use similar columns; it is the variation of the instrumental conditions that produces superior quantification approaches. Only one methods use direct injection [184], bypassing the column. Most of the published methods employ columns with normal phase C18 stationary phase (Ascentis Express C18 [40,178], Luna C18 [69,177], Kinetex C18 [11,19,71], Luna Omega Polar C18 [58,114,118,139], Luna Omega PS C18 [27], XTerra MS C18 [83], Acquity UPLC BEH C18 [181], Acquity BEH Shield RP18 [144], MacMod ACE5 C18-AR [190], ACE 3 C18-PFP [187], ACE Excel 3 C18 [111], Poroshell 120 SB-C18 [182], Poroshell 120 EC-C18 [188,189] or 120 SB-C18 [34,35,36,38], Shim-pack XR-ODSII RP C18 [149], Nucleodur® C18 Gravity [185], Zorbax Eclipse Plus C18 [92,183], Zorbax Eclipse XDBC18 [186], Zorbax SB-C18 [133], Atlantis T3 C18 [42], with [11,19,34,35,36,38,83,188,189] or without [43,184,185,188,189,190] guard column or C18 guard cartridge [177] that allow reliable separation and quantification of a wide range of phytocannabinoids (focused on, but not limited to, CBDV, CBDA, CBGA, CBG, CBD, THCV, CBN, Δ9-THC, Δ8-THC, CBC, Δ9-THCA). Raptor ARC-18 is the C18 column with the widest applicability in phytocannabinoid profiling, offering the most appropriate separation of 17 phytocannabinoids (CBG, CBD, CBN, Δ9-THC, Δ8-THC, THCA, THCV, THCVA, CBC, CBCA, CBGA, CBDA, CBL, CBLA, CBDV, CBDVA, CBLA) at a runtime suitable for commercial environment. It improves peak resolution issue of some of the aforementioned columns, such as Kinetex C18, Luna C18, Luna Polar C18 and Raptor C18 [100] and has been shown to, together with Raptor ARC-18 EXP guard column, be suitable for analysis of pesticides, mycotoxins and cannabinoids [65].
The latest research points out the importance of core-shell technology columns (e.g., Poroshell) for separation of 96 phytocannabinoids by ESI-LC/MS [19]. C18 columns with advanced bonding of the trifunctional C18 phase and end-capping process, such as Acquity UPLC® HSS T3, are also used [183,184]. RP-C18 columns, most commonly Synergi Hydro RP C18 [63,65,66], RP-C18 Hydro [61,62], Mediterranea RP-C18 [78], LiChrospher 60, RP-Select B [191], RP-C18 [165], with [60,61,62,63,191] or without [78,165] C18 guard column are also used. Other columns, such as Ascentis Express RP-amide are also used [64].
A better chromatographic performance (in terms of both resolution and sensitivity), a shorter analysis time (10 min vs. 12 min) and a considerable saving of solvent consumed while working at a flow rate of 0.5 mL/min instead of 1.5 mL/min, was observed while working on a fuse-core stable bond (SB) RP-C18 column rather than fully porous RP-C18 column [182]. Another study evaluated three different columns, RP-C18, fused-core stable bond (SB) RP-C18 and fused-core end-capped (EC) RP-C18 with numerous mobile phases and gradient conditions in an attempt to shorten the run time and to increase the separation of 8 phytocannabinoids (CBDA, CBGA, CBD, CBG, CBN, Δ9-THCA, Δ9-THC and Δ8-THCA). The SB RP-C18 core shell column provided the best performance due to significant improvement in separation and symmetry of chromatographic peaks with a baseline separation between CBD and CBG within 20 min shorter run time [176].
HPLC Detectors
For the purpose of phytocannabinoid profiling, (U)HPLC analytical platforms are coupled to UV, DAD, PAD or MS. Phytocannabinoids have low molar absorptivity, which results in relatively low sensitivity of LC methods employing UV and DAD. This restricts employment of DAD detection to low wavelengths where there is often strong background absorbance from the eluent components, especially during gradient elution experiments [176]. Additionally, UV/DAD methods often have low specificity for some phytocannabinoids, e.g., CBDA and CBGA, due to similar UV/DAD spectra [178].
Phytocannabinoids have different UV behaviour on the basis of their chemical structure. Cannabinoid acids (CBDA and CBGA) are characterized by three absorption maxima (λmax), one stronger at 220–223 nm, the second at 266–270 nm and the third one around 305 nm, while neutral phytocannabinoids (CBD and CBG) show a first λmax at 210–215 nm and an additional one at 270 nm. Generally, the ranges 190–600 nm and 200–650 nm are most commonly used for UV acquisition, while two wavelengths are selected–210 nm for neutral phytocannabinoids and 220 nm for cananbinolic acids [43,72,185]. For DAD, a narrower range is selected (i.e., 200–400 nm [83], 190–500 nm [182]). Single wavelength can be selected for evaluation of multiple phytocannabinoids in hemp seed oils [179], in plant material (230 nm) [68], 214 nm [188,189] or 220 nm in plant material and resins [69,165] or cannabis extracts [27], in commercial veterinary supplements (225 nm) [192] or for quantification of Δ9-THC, Δ9-THCA, CBN and CBD (210 nm) [191] or Δ9-THC and Δ9-THCA in plant material (211 nm and 220 nm) [185]. For wide range methods, such as cannabis-based medical extracts [182], cannabis-infused cholcolate [65] and 17 phytocannabinoids in cannabis inflorescences and oils [100], 228 nm has been shown to be the most suitable. Multiple detection wavelengths, e.g., 220 nm, 240 nm, 270 nm and 307 nm are also used for phytocannabinoids profiling [111,190]. Evaluation of these detection wavelengths for five phytocannabinoids (CBD, CBDA, CBN, Δ9-THC and Δ9-THCA) in versatile cannabis-based products was performed. While none of the phytocannabinoids showed λmax at 240 nm, this wavelength tended to equalize the response (slope) across the five phytocannabinoids, except for CBN, which has the highest response. The highest response for all five components was found with 220 nm and was useful for low level quantification (Table S2). 270 nm and 307 nm provided high selectivity for CBDA and Δ9-THCA, which was used to minimize or eliminate detection of matrix interferences, as needed. Detection wavelengths in the range of 270–280 nm are inappropriate for CBD, CBN, and Δ9-THC due to retention time (Rt) interferences [90].
Although many studies employ UV/DAD for separation of the major phytocannabinoids (CBDA, CBD, CBN, Δ9-THC and Δ9-THCA), most do not account for interference from minor phytocannabinoids (e.g, CBNA). Such interference is of special importance during profiling of concentrates where minor phytocannabinoids can be enriched to detectable levels. Additionally, some terpenes absorb UV light at the same wavelength as phytocannabinoids. All these issues decrease sensitivity, specificity and selectivity of UV/DAD methods, which are easily overcome by employment of MS detection. Detection of neutral phytocannabinoids based on their ability to absorb fluorescence under the acidic conditions used in RP-LC is only recently reported [111] as a fast, low-cost and selective alternative, but without the ability to detect phytocannabinoid acids and a somewhat narrower linear range than DAD due to saturation at high concentrations.
Most commonly used MS analyzers include simple Q spectrometers [181], QQQ analyzers [11,58,68,97,114,147,193,194], IT analyzers [28,43,72,185], QTRAP [67,159,191,195] or high resolution-accurate mass MS (HRAM-MS) analysers, such as Q-TOF [83,88,139,189] and Q-ExactiveTM Orbitrap [19,63,65,66].
Phytocannabinoid profiling is most commonly performed using ESI, rarely using variations such as dual source [78] or heated ESI source [19,63]. Acquisitions are performed in positive (+) [88,147,189,191,193,194], negative (−) [134] or both (+) and (−) modes [27,40,55,62,63,64,92,144,178,181]. In fact, all major phytocannabinoids are detected in both ionization modes, except for THCV [78]. However, it is noted that acidic phytocannabinoids (CBDA, THCA, CBCA, CBGA, CBNA, CBCVA) give better signals in the (−) mode, while neutral phytocannabinoids are better ionized in (+) mode (CBDV, CBG, CBD, CBC, CBDA, CBDVA, CBGA, Δ9-THCA, Δ9-THC and Δ8-THC) [43,58,83]. ESI (−) provides identification and quantification of additional minor phytocannabinoids, such as CBGA methyl ester (CBGMA) [40] and improves identification accuracy for two neutral phytocannabinoids (CBL and CBN) [78].
Atmospheric pressure chemical ionization (APCI) is also used in (+) [11] and (−) mode [69] for phytocannabinoid profiling in plant material. Formation of (+) charged sodium adducts [M+Na]+ instead of the precursor ion (M+ H)+ is observed in (+) ionization mode. This feature increases sensitivity and allows accurate identification of 7 phytocannabinoids (cannabicoumaric acid, CBCA, CBGA, CBGAM, 10-ethoxy-9-hydroxy-Δ6α-THC, 4-acetoxycannabichromeand Δ9-THCA-C4). APCI (−) is shown to be suitable for CBD, CBG and CBGA [69].
MS information from HRAM-MS acquisitions, that is, the accurate mass and mass fragmentation patterns, is used for untargeted phytocannabinoid profiling [19,63,65,66,83]. Compound identification is performed using one or more MSLs, such as mzCloud (HighChem LLC, Bratislava, Slovakia) [196], in-house MSL, such as the recent MSL of LC-MS/MS spectra of 94 phytocannabinoids accompanied with metadata (names, Rts, accurate masses, fragmentation patterns and fragments structures) [19], compound DBs, such as and ChemSpider [197] and Human Metabolome DB (HMDB) [198] or cheminformatics software, such as Compound Discoverer (Thermo Fischer Scientific, Waltham, MA, USA).
HPLC-UV high-resolution MS (HRMS) is employed for simultaneous quantification of the two main impurities in “pure” commercial CBG samples (cannabigerovarin (CBGV) and cannabigerobutol (CBGB)) with subsequent confirmation by comparison with synthesized compounds [193].
Matrix Effect
The sample, i.e., matrix type greatly affects selection of extraction technique, extraction solvent(s), HPLC column, mobile phase and detection method, which further enhances method sensitivity, selectivity and specificity. All three validation parameters are affected by the presence of matrix constituents that co-extracts with phytocannabinoids, causing signal alteration (suppression or enhancement). In that spirit, matrix effect is frequently reported during LC-MS-based phytocannabinoid profiling. Cannabis plant material is complex matrix with high fat, pigment and polar compounds content, being flavonoids and terpenes most prominent. Cannabis-based products are much more versatile in terms of fat-, sugar- and polar-interferences content, thus being more prominent to expressing significant matrix suppression during instrumental analysis.
Significant polar matrix interferences are reported to occur when EtOH is used for extraction of phytocannabinoids from honey, which also co-extracts several interfering matrix components, such as flavonoids [194]. Matrix effect is also examined during phytocannabinoid profiling of commercial products including oils, creams, and plant material. No significant matrix effect is observed in oil for Δ9-THC, CBD, CBDA and Δ9-THCA (110.4 ± 116.0%, 105.4 ± 112.2%, 96.3 ± 117.8% and 92.7 ± 107.8%, respectively); acceptable matrix effects for Δ9-THC and CBD in plant material (102.0 ± 112.8% and 91.2 ± 129.4%, respectively) and in creams (79.4 ± 93.1% and 83.8 ± 100.2%, respectively). Matrix effect of CBDA was especially pronounced in plant material, with signal enhancement particularly at low concentrations [173].
2.2.3. SFC Methods
Despite being efficient, SFC is an analytical technique that has still not been fully exploited for the analysis, separation and quantification of cannabis plants and cannabis-based products, compared to GC and LC. The limited number of studies available report SFC as a fast (8–10 min runtime), cost-effective method with high specificity and separation power for phytocannabinoid profiling [195,199,200]. Prior to SFC analysis, derivatization and/or decarboxylation of phytocannabinoids is not required, thus reducing the risk of sample contamination (unlike GC). Additionally, SFC allows separation of the neutral from the acidic phytocannabinoids, simultaneously due to the properties of the supercritical fluids, offers shorter analysis time, better resolution and definitive identification in a single chromatogram of cannabis products when compared to both GC-MS and HPLC methods [199]. UHPSFC is shown to offer greater selectivity than UHPLC, but at the price of lower sensitivity, as a result of considerable variation of the refractive index of CO2, resulting in greater baseline noise [188].
Recently, the development of ultra-high performance SFC (UHPSFC) improved resolving power and efficiency, such that SFC has regained its popularity as an alternative phytocannabinoid profiling of cannabis plants and cannabis-based products. SFC combined with a 2 µm particle size column offers rapid separation and when coupled to UV or MS detection, offers highly efficient analysis of the main phytocannabinoids, using inexpensive and environmentally friendly SC-CO2 as solvent. On the other hand, UHPSFC is considered as highly orthogonal technique which provides different elution order and relative retention of the investigated components compared to UHPLC; therefore, in combination with MS, it could increase the discrimination power of phytocannabinoids in complex matrices.
For the purpose of phytocannabinoid profiling, SFC using cyanopropyl silica packed column was employed [199], while the reported UHPLSFC methods used BEH 2-EP (2-ethylpyridine) column [195,200]. Evaluation of columns with different stationary phases, Torus 1-AA (1-aminoanthracene), Viridis BEH-2EP (ethyl-pyridine) and Torus Diol (OH) revealed that the latter column achieved the highest number of (although not completely separated) peaks; thus, it is most appropriate for routine phytocannabinoid profiling [188]. SC-CO2 is used with MeOH as co-solvent, with a constant (2%) [188] or gradually increasing concentration from 2% to 7% [199], often with the addition of 0.1% formic acid to improve peak shape of cannabinoid acids [188]. UHPSFC methods employ SC-CO2 with isopropanol/MeCN (80:20, v/v) with 1% H2O and linear gradient [195,200]. SFC and UHPSFC are usually coupled either to PDA detectors [188] or to mass analyzers, such as APCI-QQQ [199] and ESI-Q mass analyser [195,200]. The reported linearity, sensitivity and specificity confirm the potential of SFC and UHPSFC to become the main profiling analytical platforms instead of GC- and LC-based methods in near future.
2.2.4. Vibrational Spectroscopy Methods
In the past decade, vibrational spectroscopy techniques (IR, NIR, MIR, FTIR and Raman) emerged as process analytical tool in the pharmaceutical industry for monitoring various quality attributes, and as such were recognized by United States Food and Drug Administration (FDA) [201]. Their ability for high-throughput screening of large volume of sample for a short period of time can exert sampling-based errors and provide rapid, versatile and non-invasive approach in qualitative and quantitative profiling and growth staging of cannabis plant and extracts (Table S3).
The vibrational IR and Raman spectroscopy are considered complementary techniques; even though both are relying on different physical processes, their main observations are focused on light-induced molecular excitation [202]. Vibrational spectroscopy is based on sample’s absorption of light at a defined wavelength range, which occurs as a consequence of the vibrational features of the sample that result in the formation of overtones and combination bands that form the spectrum. The relationship between the spectrum and the physicochemical properties of the sample are mathematically modelled using various multivariate regression methods (principal component analysis (PCA) and increment PCA (iPCA) [203], alone [204] or together with partial least-square (PLS) regression analysis [205,206], based on which the compound concentration in the sample is predicted.
NIR spectroscopy, in conjunction with multivariate data analysis, is a widely accepted approach for the abovementioned analysis. Quantitative data generated by NIR strongly agree with UHPLC-UV data, confirming the potential of employment of NIR spectroscopy in routine monitoring of cannabis plant material and cannabis resins [189]. Dispersive NIR and FT-NIR methods were developed for quantification of eight different phytocannabinoids (CBDV, Δ9-THCV, CBD, CBC, Δ8-THC, Δ9-THC, CBG and CBN) in ground leaves and inflorescences from C. sativa [205] and for discriminating illegal and legal cannabis varieties [207]. A similar NIR method demonstrated sensitivity and specificity for CBD quantification in different liquid pharmaceutical products, thus showcasing its potential as a fast method for monitoring of CBD in the production process [206]. Moreover, an NIR method for the growth staging of Cannabis plants was reported as being sensitive to concentrations of phytocannabinoids and volatile substances in the samples, which are also correlated to the plant age, thus justifying the feasibility of the method for growth staging of cannabis [203]. Dispersive NIR using a scanning monochromator [205], FT-NIR spectrometer with integrated Michelson interferometer and a highly sensitive PbS detector [205], FT-NIR spectrometer based on measurement by diffuse reflectance [206], NIR spectrometer with In-Ga-As detector [203], and a handheld NIR with In-Ga-As array detector [189] were so far employed in phytocannabinoid profiling in cannabis ground leaves and inflorescences [205], in cannabis seeds [203] and in liquid pharmaceutical products (medium-chain triglyceride and propylene glycol-based formulations) [206]. Two handheld NIR devices (NIR-S-GI and MicroNIR) are used for in-field determination of Δ9-THC content in cannabis inflorescences and cannabis resins. For this purpose, spectrophotometers with a larger sample analysis window are more appropriate for highly heterogenous samples, such as whole cannabis inflorescences [189].
The literature data regarding phytocanabinnoids’ structural and molecular analysis, to date, is very scarce, lacking band assignation and in-depth structural analysis of the molecules [23,208,209] despite the documented ability to provide chemical fingerprinting and qualitative profiling of phytocannabinoids, especially of FTIR in quantification of biological compounds in complex matrices [210]. However, the interest in qualitative profiling of cannabis (identification/classification) and quantitative profiling of the main phytocannabinoids is slowly gaining momentum in the last few years (Supporting information, Table S3). A recent study for ATR mid-IR quantification of Δ9-THC and CBD in cannabis flowers and extracts described a stepwise approach in developing multivariate quantification models accompanied by detailed band assignment of the mentioned phytocannabinoids, both for pure compounds and analysed samples (complex matrices) [21]. In a further study by the same group, the potential of ATR mid-IR as a process analytical tool (PAT) for continuous monitoring of Δ9-THCA decarboxylation was showcased [22].
The new portable vibrational spectroscopy apparatus versions are very applicable, especially for continuous monitoring of the main phytocannabinoids in all growth stages of cannabis and cannabis-based products manufacturing. Thus, a handheld Raman spectrometer in conjunction with orthogonal PLS-DA was utilized to construct a classification model for discriminating Δ9-THCA rich, CBD rich Cannabis plants and hemp (low Δ9-THCA, CBDA and CBD) [211,212]. Reference standards from the main phytocannabinoids were used to perform a detailed band assignation of the spectra that were further correlated with the loading plot of the multivariate models. In both cases, favourable accuracy descriptors for the classification models were reported, thus showcasing the applicability of the portable Raman device for accurate and fast Cannabis plant classification. Raman spectroscopy is a highly sensitive analytical technique, that, due to the variety of monochromatic light sources, and the emergence of surface-enhanced Raman scattering (SERS), stimulated resonance and coherent anti-Stokes Raman scattering (CARS) offers greatly enhanced capability and resolution, especially in its imaging mode. CARS imaging at different Raman vibrations, known as hyperspectral CARS imaging, is a spectroscopic imaging technique with high-resolution capabilities for a chemical distinction that employs sophisticated data processing methods [208]. This analytical method was used to analyze the secondary metabolites (Δ9-THCA and CBDA) in glandular cannabis trichomes with distinct spatial resolution, without the need to extract the resin [213]. To get additional morphological data, the authors superimposed the image over a single photon fluorescence and SEM image of the trichomes. The similarity of the chemical fingerprints of the distinct regions with the secondary metabolites was determined with hierarchical clustering analysis (HCA). The proposed methodology enables an easy discrimination between trichomes with high-Δ9-THCA and high-CBDA content.
2.2.5. Other Analytical Techniques
CE
CE is analytical platform used in cannabinoid profiling in only one study [68]. MeCN-based background electrolyte (with 6.5 mM NaOH) in the presence of β-cyclodextrin (βCD), improving orthogonal separation media by transiently interacting with compounds based on their geometry and polarity, was used to separate 14 phytocannabinoids (CBG, CBGA, CBD, CBDA, CBN, Δ9-THC, CBC, CBCA, Δ9-THCA, THCV, CBDV and CBGVA) by constant transition between the background electrolyte and βCD. CE performed better than HPLC-DAD in terms of selectivity and runtime, but with significantly lower sensitivity.
CE’s variety, capillary electromatography (CEC), coupling the benefits of CE and HPLC methods, has been used in phytocannabinoid profiling coupled with UV PDA detector in only one study [214]. Baseline separation of seven phytocannabinoids (CBG, CBD, CBN, Δ9-THC, Δ8-THC, CBC, Δ9-THCA) was achieved by using C18 column and MeCN/25 mM phosphate buffer (75:25, v/v) as mobile phase for analysis of MeOH/CHCl3 (9:1, v/v) cannabis plant material extracts, while improved sensitivity is achieved using UV cell with extended path length and injection size.
NMR Spectroscopy
NMR-based methods are superior for the purpose of 3D-structure elucidation, especially ζ-resolving, 1H-1H COSY and 1H-13C heteronuclear multiple quantum coherence (HMQC) and heteronuclear multiple bond correlation (HMBC) spectroscopy. The complete 1H- and 13C-NMR assignments of the major Cannabis constituents, ∆9-THC, Δ9-THCA, ∆8-THC, CBG, CBN, CBD, CBDA, cannflavin A and cannflavin B have been determined on the basis of one- and two-dimensional NMR spectra, including 1H- and 13C-NMR, 1H-1H-COSY, HMQC and HMBC [20]. However, they are seldomly used for quantification purposes, due to the laborious separation and isolation steps required, where significant loss of mass can occur and where there is low sensitivity [4,215]. Additional issues are the high instrumental costs and necessity of highly specialized personnel. Despite that, NMR is considered as a highly accurate, reproducible and fast technique [1].
For the purpose of phytocannabinoid profiling, NMR spectroscopy is used as (semi)quantitative method alone [20,209] or as an orthogonal technique to LC [216,217,218] or GC [219] for the purpose of qualitative peak assignment of major phytocannabinoids [20], chemical and morphological examination [220], chemotaxonomic classification [20,219,220], metabolomics-based chemovar distinction [51] or quantitative analysis of cannabis plant material without the need of pre-purification step [221], chromatographic separation or use of certified reference standards [219]. Cryogenic NMR spectroscopy combines improved sensitivity and noise reduction with a cryogenic cooling system for the receiver coil and preamplifiers. Its improved spectral quality is employed in compound identification from mass limited samples and as orthogonal analytical technique to HPLC in phytocannabinoid profiling in laser-micro dissected samples of capitate-stalked and capitate-sessile trichomes [220].
3. Conclusions and Future Directions
Scientific and technological advancements in cultivation, manufacturing, recreational, industrial and medical use of cannabis, as well as updated legislation, led to the development of multitude of analytical methods for phytocannabinoid profiling. Matrix nature greatly affects selection of extraction technique, sample preparation and analytical method due to the fact that significant matrix interferences can occur and aggravate the overall analysis of target phytocannabinoids. Sample preparation for phytocannabinoid profiling in the past four decades is mainly based on versatile types of accelerated maceration, such as SLE, LLE, PLE, SPE, USE, FUSE and MAHD. Recently, new trends have enlightened environmental-friendly techniques, such as easily-automatable HS-SPME and SFE, which adds speed, repeatability and reproducibility to the analyses. From the multitude of analytical platforms, TLC and HPTLC, HPLC-DAD, GC and LC coupled with mass spectrometry (MS or MS/MS), are most commonly used; however, recently emerging techniques are NMR and vibrational spectroscopy methods, such as IR, NIR, FTIR and FT-NIR. TLC, together with HPTLC, which is a suitable method for screening of samples and is included in the pharmacopoeias in the identification methods. Cannabinoid profiling for research, industrial and QC purposes is based mostly on two analytical platforms: GC and LC. GC coupled to versatile detectors and mass analyzers is one of the oldest, the most preferred and researched analytical platforms for phytocannabinoid profiling due to its robustness, reproducibility, sensitivity and speed.
As a result of the advancement of computational tools, mass spectral libraries (MSLs), public compound repositories and compound databases (DBs), as well as various advanced detection techniques, GC has become the analytical platform in forensic, pharmacokinetic and phytochemical analysis of natural phytocannabinoids. As such, GC methods are also officially employed by authorities for terpene profiling, pesticide screening and residual solvents analysis, which affords potential benefits to regulatory bodies and cannabis industry. High pressure and high flow rates used during TLC, HPTLC, HPLC and UHPLC, and the recently emerging SFC technique allow sample preservation without decarboxylation and decomposition, reliable separation of neutral and acidic cannabinoid species and, thus, direct identification and quantification of both neutral and acidic forms of phytocannabinoids in the extracted samples. In the past decades, LC has become an analytical platform of choice (HPLC-DAD and LC-MS) in first line for potency studies but also for untargeted analysis of cannabis and cannabis-based products. Despite the fact that vibrational spectroscopy methods, such as NIR, FTIR, FT-NIR and Raman spectroscopy are reserved for structural elucidation, in the last few years there is an evident trend of their utilization for rapid quantitative phytocannabinoid profiling. Although these vibrational spectroscopy techniques can provide rapid, versatile and non-invasive approach in qualitative and quantitative profiling and growth staging of cannabis plant and extracts, they demonstrate far higher LOD and LOQ than the described chromatography-‘wet’ methods, they are fast, inexpensive, non-destructive and require minimum (e.g., drying, grinding) or no sample preparation. Regardless of high instrumental costs and necessity of highly specialized personnel, NMR is considered as a highly accurate, reproducible and fast technique that offers quantitative analysis of cannabis without the need of pre-purification step, chromatographic separation or use of certified reference standards. Even though there are currently various well-established methods available for chemical analyses of phytocannabinoids, there is still a need for adaptations and enhancement of these methods in the light of new scientific evidence regarding the plant and its plant metabolites, especially taking into account the pharmacological activity and its medical use, association of medical and adverse health effects with potency and/or interplay of certain phytocannabinoids and other active constituents, quality control and stability studies of cannabis and cannabis-based products. Further advancements in phytocannabinoid profiling should move towards untargeted analysis of cannabis plant material and cannabis-based products using orthogonal analytical methods. By employment of cheminformatics approaches for small molecule identification and MSLs, a multitude of new phytocannabinoids and other compounds is expected to be identified in the near future, thus allowing access to complete and accurate phytocannabinoid and terpene profiles.
Supplementary Materials
The following are available online. Table S1: GC-based analytical methods for cannabinoid profiling [5,9,10,17,18,43,44,45,46,47,48,49,51,52,53,54,55,56,57,58,59,66,67,70,71,72,73,74,75,77,78,79,81,82,84,85,86,87,88,89,90,91,93,94,95,96,97,98,99,101,102,103,104,105,106,107,108,114,115,116,118,119,121,122,123,124,128,132,136,137,138,139,140,141,148,150,152,153,154,155,156,157,158,160,161,163,166,216,222,223,224]; Table S2: LC-based analytical methods for cannabinoid profiling [11,19,27,40,42,50,55,60,61,62,63,64,65,68,69,78,80,83,92,100,107,109,111,113,133,134,142,144,149,165,173,176,177,178,179,180,182,183,185,186,187,188,190,191,192,194,200,215,217]; Table S3: Vibrational spectroscopy-based analytical methods in conjunction with multivariate data analysis for phytocannabinoid profiling and/or classification of cannabis plant material [21,189,203,204,205,206,207,211,212,218].
Author Contributions
Conceptualization, G.S. and S.K.; methodology, I.C.K.; investigation, V.S.G. and A.T.; data curation, I.C.K., V.S.G. and A.T.; writing—original draft preparation, I.C.K. and N.G.; writing—review and editing G.S., M.K. and S.K.; supervision, G.S. and S.K; project administration, G.S.; funding acquisition, S.K. and G.S. All authors have read and agreed to the published version of the manuscript.
Funding
This research received no external funding.
Conflicts of Interest
The authors declare no conflict of interest.
Sample Availability
Samples of the compounds are available from the authors.
Footnotes
Publisher’s Note: MDPI stays neutral with regard to jurisdictional claims in published maps and institutional affiliations.
References
- 1.Citti C., Braghiroli D., Vandelli M.A., Cannazza G. Pharmaceutical and biomedical analysis of cannabinoids: A critical review. J. Pharm. Biomed. Anal. 2018;147:565–579. doi: 10.1016/j.jpba.2017.06.003. [DOI] [PubMed] [Google Scholar]
- 2.Borille B.T., González M., Steffens L., Ortiz R.S., Limberger R.P. Cannabis sativa: A systematic review of plant analysis. Drug Anal. Res. 2017;1:1–23. doi: 10.22456/2527-2616.73676. [DOI] [Google Scholar]
- 3.Sawler J., Stout J.M., Gardner K.M., Hudson D., Vidmar J., Butler L., Page J.E., Myles S. The Genetic Structure of Marijuana and Hemp. PLoS ONE. 2015;10:e0133292. doi: 10.1371/journal.pone.0133292. [DOI] [PMC free article] [PubMed] [Google Scholar]
- 4.Ramirez C.L., Fanovich M.A., Churio M.S. Studies in Natural Products Chemistry. Elsevier; Amsterdam, The Netherlands: 2019. Cannabinoids: Extraction Methods, Analysis, and Physicochemical Characterization; pp. 143–173. [DOI] [Google Scholar]
- 5.United Nations Office on Drugs and Crime . Recommended Methods for the Identification and Analysis of Cannabis and Cannabis Products Manual for Use by National Drug Analysis Laboratories. United Nations; New York, NY, USA: 2009. [(accessed on 5 July 2020)]. Available online: http://search.ebscohost.com/login.aspx?direct=true&scope=site&db=nlebk&db=nlabk&AN=450863. [Google Scholar]
- 6.Small E., Cronquist A. A Practical and Natural Taxonomy for Cannabis. Taxon. 1976;25:405–435. doi: 10.2307/1220524. [DOI] [Google Scholar]
- 7.Small E. Evolution and Classification of Cannabis sativa (Marijuana, Hemp) in Relation to Human Utilization. Bot. Rev. 2015;81:189–294. doi: 10.1007/s12229-015-9157-3. [DOI] [Google Scholar]
- 8.ElSohly M.A., Slade D. Chemical constituents of marijuana: The complex mixture of natural cannabinoids. Life Sci. 2005;78:539–548. doi: 10.1016/j.lfs.2005.09.011. [DOI] [PubMed] [Google Scholar]
- 9.Mehmedic Z., Chandra S., Slade D., Denham H., Foster S., Patel A.S., Ross S.A., Khan I.A., ElSohly M.A. Potency Trends of Δ9-THC and Other Cannabinoids in Confiscated Cannabis Preparations from 1993 to 2008*. J. Forensic Sci. 2010;55:1209–1217. doi: 10.1111/j.1556-4029.2010.01441.x. [DOI] [PubMed] [Google Scholar]
- 10.de Meijer E.P.M., Bagatta M., Carboni A., Crucitiit P., Moliterni C.V.M., Ranalli P., Mandolino G. The Inheritance of Chemical Phenotype in Cannabis sativa L. Genetics. 2003;163:335–346. doi: 10.1093/genetics/163.1.335. [DOI] [PMC free article] [PubMed] [Google Scholar]
- 11.Aizpurua-Olaizola O., Omar J., Navarro P., Olivares M., Etxebarria N., Usobiaga A. Identification and quantification of cannabinoids in Cannabis sativa L. plants by high performance liquid chromatography-mass spectrometry. Anal. Bioanal. Chem. 2014;406:7549–7560. doi: 10.1007/s00216-014-8177-x. [DOI] [PubMed] [Google Scholar]
- 12.Mechoulam R., Shvo Y. The structure of cannabidiol. Tetrahedron. 1963;19:2073–2078. doi: 10.1016/0040-4020(63)85022-X. [DOI] [PubMed] [Google Scholar]
- 13.Gaoni Y., Mechoulam R. Isolation, Structure, and Partial Synthesis of an Active Constituent of Hashish. J. Am. Chem. Soc. 1964;86:1646–1647. doi: 10.1021/ja01062a046. [DOI] [Google Scholar]
- 14.Gaoni Y., Mechoulam R. Cannabichromene, a new active principle in hashish. Chem. Commun. 1966:20–21. doi: 10.1039/c19660000020. [DOI] [Google Scholar]
- 15.Vollner L., Bieniek D., Korte F. Cannabidivarin, ein neur Haschisch-Inhalsstoff. Tetrahedron Lett. 1969;10:145–147. doi: 10.1016/S0040-4039(01)87494-3. [DOI] [PubMed] [Google Scholar]
- 16.Gill E.W., Paton W.D.M., Pertwee R.G. Preliminary Experiments on the Chemistry and Pharmacology of Cannabis. Nature. 1970;228:134–136. doi: 10.1038/228134a0. [DOI] [PubMed] [Google Scholar]
- 17.Tipparat P., Kunkaew W., Julsrigival S., Pinmanee S., Natakankitkul S. Classification of Cannabis Plants Grown in Northern Thailand using physico-chemical properties. J. Nat. Sci. Res. 2014;10:46–54. [Google Scholar]
- 18.Hazekamp A., Peltenburg A., Verpoorte R., Giroud C. Chromatographic and Spectroscopic Data of Cannabinoids from Cannabis sativa L. J. Liq. Chromatogr. Relat. Technol. 2005;28:2361–2382. doi: 10.1080/10826070500187558. [DOI] [Google Scholar]
- 19.Berman P., Futoran K., Lewitus G.M., Mukha D., Benami M., Shlomi T., Meiri D. A new ESI-LC/MS approach for comprehensive metabolic profiling of phytocannabinoids in Cannabis. Sci. Rep. 2018;8:14280. doi: 10.1038/s41598-018-32651-4. [DOI] [PMC free article] [PubMed] [Google Scholar]
- 20.Choi Y.H., Hazekamp A., Peltenburg-Looman A.M.G., Frédérich M., Erkelens C., Lefeber A.W.M., Verpoorte R. NMR assignments of the major cannabinoids and cannabiflavonoids isolated from flowers of Cannabis sativa. Phytochem. Anal. 2004;15:345–354. doi: 10.1002/pca.787. [DOI] [PubMed] [Google Scholar]
- 21.Geskovski N., Stefkov G., Gigopulu O., Stefov S., Huck C.W., Makreski P. Mid-infrared spectroscopy as process analytical technology tool for estimation of THC and CBD content in Cannabis flowers and extracts. Spectrochim. Acta Part A Mol. Biomol. Spectrosc. 2021;251:119422. doi: 10.1016/j.saa.2020.119422. [DOI] [PubMed] [Google Scholar]
- 22.Gigopulu O., Geskovski N., Stefkov G., Stoilkovska V., Spirevska I.S., Huck C.W., Makreski P. Synergistic use of FTIR spectroscopy and TG to elucidate the solid state THCA decarboxylation reaction kinetics in THCA standard and cannabis flower. Anal. Chem. 2022;267:18. [Google Scholar]
- 23.Russo E.B. History of Cannabis and Its Preparations in Saga, Science, and Sobriquet. Chem. Biodivers. 2007;4:1614–1648. doi: 10.1002/cbdv.200790144. [DOI] [PubMed] [Google Scholar]
- 24.Pertwee R.G. Oxford Scholarship. Oxford University Press; London, UK: 2014. Handbook of Cannabis. [Google Scholar]
- 25.Leonard W., Zhang P., Ying D., Fang Z. Hempseed in food industry: Nutritional value, health benefits, and industrial applications. Compr. Rev. Food Sci. Food Saf. 2020;19:282–308. doi: 10.1111/1541-4337.12517. [DOI] [PubMed] [Google Scholar]
- 26.Geshtakovska G., Stefkov G. Modern Pharmacist-Bridging Science with Practice. Macedonian Pharmaceutical Bulletin; Macedonian Pharmaceutical Association; Ohrid, Macedonia: 2016. Routes of cannabis administration: A brief review; pp. 515–516. [Google Scholar]
- 27.Muscarà C., Smeriglio A., Trombetta D., Mandalari G., la Camera E., Grassi G., Circosta C. Phytochemical characterization and biological properties of two standardized extracts from a non-psychotropic Cannabis sativa L. cannabidiol (CBD)-chemotype. Phytother. Res. 2021;35:5269–5281. doi: 10.1002/ptr.7201. [DOI] [PMC free article] [PubMed] [Google Scholar]
- 28.Klein R.F.X. Analysis of “Marijuana Edibles”—Food Products Containing Marijuana or Marijuana Extracts—An Overview, Review, and Literature Survey. Microgram J. 2017;14:24. [Google Scholar]
- 29.Johnson R. Hemp as an Agricultural Commodity. Congressional Research Service; Washington, DC, USA: 2018. [Google Scholar]
- 30.European Commission . Official Journal of the European Union. European Commission; Brussels, Belgium: 2012. Common Catalogue of Varieties of Agricultural Plant Species; p. 39. [Google Scholar]
- 31.European Commission . Official Journal of the European Communities. European Commission; Brussels, Belgium: 2002. Commission Regulation (EC) No. 327/2002. [Google Scholar]
- 32.Vereinte Nationen, Büro für Drogenkontrolle und Verbrechensbekämpfung . World Drug Report. Vereinte Nationen; New York, NY, USA: 2018. [Google Scholar]
- 33.Upton R., Craker L., ElSohly M., Romm A., Russo E., Sexton M. American Herbal Pharmacopoeia, Cannabis Inflorescence: Cannabis spp.; Standards of Identity, Analysis, and Quality Control. American Herbal Pharmacopoeia; Scotts Valley, CA, USA: 2013. [Google Scholar]
- 34.Swissmedic Swiss Agency for Therapeutic Products Pharmacopoeia Division . Pharmacopoeia Helvetica. 11th ed. Supplement 11.3; Swissmedic Swiss Agency for Therapeutic Products Pharmacopoeia Division; Bern, Switzerland: 2019. Fleur de Cannabis. [Google Scholar]
- 35.Council of Europe . European Pharmacopoeia. 10th ed. Council of Europe; Strasbourg, France: 2020. Cannabis flos Monograph N°: 3028. [Google Scholar]
- 36.Geschäftsstelle der Arzneibuch-Kommissionen . German Pharmacopoeia. 2020th ed. Geschäftsstelle der Arzneibuch-Kommissionen: Bundesinstitut fur Arzneimittel und Miedizinprodukte; Bonn, German: 2020. Bundesinstitut fur Arzneimittel und Miedizinprodukte, Monografie Cannabisblüten. [Google Scholar]
- 37.Fernandez E.B., Peterseil V., Hackl G., Menges S., de Meijer E., Staginnus C. Distribution of Chemical Phenotypes (Chemotypes) in European Agricultural Hemp (Cannabis sativa L.) Cultivars. J. Forensic Sci. 2020;65:715–721. doi: 10.1111/1556-4029.14242. [DOI] [PubMed] [Google Scholar]
- 38.Geschäftsstelle der Arzneibuch-Kommissionen . German Pharmacopoeia. Geschäftsstelle der Arzneibuch-Kommissionen, Bundesinstitut fur Arzneimittel und Miedizinprodukte; Bern, Switzerland: 2020. Bundesinstitut fur Arzneimittel und Miedizinprodukte, Monografie Cannabis extractum normatum (Eingestellter Cannabis-Extrakt) [Google Scholar]
- 39.Nahar L., Guo M., Sarker S.D. Gas chromatographic analysis of naturally occurring cannabinoids: A review of literature published during the past decade. Phytochem. Anal. 2020;31:135–146. doi: 10.1002/pca.2886. [DOI] [PubMed] [Google Scholar]
- 40.Brighenti V., Pellati F., Steinbach M., Maran D., Benvenuti S. Development of a new extraction technique and HPLC method for the analysis of non-psychoactive cannabinoids in fibre-type Cannabis sativa L. (hemp) J. Pharm. Biomed. Anal. 2017;143:228–236. doi: 10.1016/j.jpba.2017.05.049. [DOI] [PubMed] [Google Scholar]
- 41.Naviglio D., Scarano P., Ciaravolo M., Gallo M. Rapid Solid-Liquid Dynamic Extraction (RSLDE): A Powerful and Greener Alternative to the Latest Solid-Liquid Extraction Techniques. Foods. 2019;8:245. doi: 10.3390/foods8070245. [DOI] [PMC free article] [PubMed] [Google Scholar]
- 42.Knezevic F., Nikolai A., Marchart R., Sosa S., Tubaro A., Novak J. Residues of herbal hemp leaf teas—How much of the cannabinoids remain? Food Control. 2021;127:108146. doi: 10.1016/j.foodcont.2021.108146. [DOI] [Google Scholar]
- 43.Omar J., Olivares M., Alzaga M., Etxebarria N. Optimisation and characterisation of marihuana extracts obtained by supercritical fluid extraction and focused ultrasound extraction and retention time locking GC-MS: Gas Chromatography. J. Sep. Sci. 2013;36:1397–1404. doi: 10.1002/jssc.201201103. [DOI] [PubMed] [Google Scholar]
- 44.Fairbairn J.W., Liebmann J.A. The extraction and estimation of the cannabinoids in Cannabis sativa L. and its products. J. Pharm. Pharmacol. 1973;25:150–155. doi: 10.1111/j.2042-7158.1973.tb10609.x. [DOI] [PubMed] [Google Scholar]
- 45.Lewis R., Ward S., Johnson R., Burns D.T. Distribution of the principal cannabinoids within bars of compressed cannabis resin. Anal. Chim. Acta. 2005;538:399–405. doi: 10.1016/j.aca.2005.02.014. [DOI] [Google Scholar]
- 46.UNODC . Bulletin on Narcotics. Office on Drugs and Crime; Vienna, Austria: 1971. [Google Scholar]
- 47.Mechtler K., Bailer J., de Hueber K. Variations of ∆9-THC Content in Single Plants of Hemp Varieties. Ind. Crops Prod. 2004;19:19–24. doi: 10.1016/S0926-6690(03)00077-3. [DOI] [Google Scholar]
- 48.Niesink R.J.M., Rigter S., Koeter M.W., Brunt T.M. Potency trends of Δ9-tetrahydrocannabinol, cannabidiol and cannabinol in cannabis in the Netherlands: 2005-15: Potency trends of Dutch cannabis. Addiction. 2015;110:1941–1950. doi: 10.1111/add.13082. [DOI] [PubMed] [Google Scholar]
- 49.Tsumura Y., Aoki R., Tokieda Y., Akutsu M., Kawase Y., Kataoka T., Takagi T., Mizuno T., Fukada M., Fujii H., et al. A survey of the potency of Japanese illicit cannabis in fiscal year 2010. Forensic Sci. Int. 2012;221:77–83. doi: 10.1016/j.forsciint.2012.04.005. [DOI] [PubMed] [Google Scholar]
- 50.Jin D., Dai K., Xie Z., Chen J. Secondary Metabolites Profiled in Cannabis Inflorescences, Leaves, Stem Barks, and Roots for Medicinal Purposes. Sci. Rep. 2020;10:3309. doi: 10.1038/s41598-020-60172-6. [DOI] [PMC free article] [PubMed] [Google Scholar]
- 51.Fischedick J.T., Hazekamp A., Erkelens T., Choi Y.H., Verpoorte R. Metabolic fingerprinting of Cannabis sativa L., cannabinoids and terpenoids for chemotaxonomic and drug standardization purposes. Phytochemistry. 2010;71:2058–2073. doi: 10.1016/j.phytochem.2010.10.001. [DOI] [PubMed] [Google Scholar]
- 52.Hillig K.W., Mahlberg P.G. A chemotaxonomic analysis of cannabinoid variation in Cannabis (Cannabaceae) Am. J. Bot. 2004;91:966–975. doi: 10.3732/ajb.91.6.966. [DOI] [PubMed] [Google Scholar]
- 53.Hazekamp A., Tejkalová K., Papadimitriou S. Cannabis: From Cultivar to Chemovar II—A Metabolomics Approach to Cannabis Classification. Cannabis Cannabinoid Res. 2016;1:202–215. doi: 10.1089/can.2016.0017. [DOI] [Google Scholar]
- 54.Bruci Z., Papoutsis I., Athanaselis S., Nikolaou P., Pazari E., Spiliopoulou C., Vyshka G. First systematic evaluation of the potency of Cannabis sativa plants grown in Albania. Forensic Sci. Int. 2012;222:40–46. doi: 10.1016/j.forsciint.2012.04.032. [DOI] [PubMed] [Google Scholar]
- 55.Béres T., Černochová L., Zeljković S.Ć., Benická S., Gucký T., Berčák M., Tarkowski P. Intralaboratory comparison of analytical methods for quantification of major phytocannabinoids. Anal. Bioanal. Chem. 2019;411:3069–3079. doi: 10.1007/s00216-019-01760-y. [DOI] [PubMed] [Google Scholar]
- 56.Gröger T., Schäffer M., Pütz M., Ahrens B., Drew K., Eschner M., Zimmermann R. Application of two-dimensional gas chromatography combined with pixel-based chemometric processing for the chemical profiling of illicit drug samples. J. Chromatogr. A. 2008;1200:8–16. doi: 10.1016/j.chroma.2008.05.028. [DOI] [PubMed] [Google Scholar]
- 57.Janatová A., Fraňková A., Tlustoš P., Hamouz K., Božik M., Klouček P. Yield and cannabinoids contents in different cannabis (Cannabis sativa L.) genotypes for medical use. Ind. Crops Prod. 2018;112:363–367. doi: 10.1016/j.indcrop.2017.12.006. [DOI] [Google Scholar]
- 58.Field B.I., Arndt R.R. Cannabinoid compounds in South African Cannabis sativa L. J. Pharm. Pharmacol. 1980;32:21–24. doi: 10.1111/j.2042-7158.1980.tb12838.x. [DOI] [PubMed] [Google Scholar]
- 59.Ilias Y., Rudaz S., Mathieu P., Christen P., Veuthey J.-L. Extraction and analysis of different Cannabis samples by headspace solid-phase microextraction combined with gas chromatography-mass spectrometry. J. Sep. Sci. 2005;28:2293–2300. doi: 10.1002/jssc.200500130. [DOI] [PubMed] [Google Scholar]
- 60.Pavlovic R., Nenna G., Calvi L., Panseri S., Borgonovo G., Giupponi L., Cannazza G., Giorgi A. Quality Traits of “Cannabidiol Oils”: Cannabinoids Content, Terpene Fingerprint and Oxidation Stability of European Commercially Available Preparations. Molecules. 2018;23:1230. doi: 10.3390/molecules23051230. [DOI] [PMC free article] [PubMed] [Google Scholar]
- 61.Giupponi L., Leoni V., Pavlovic R., Giorgi A. Influence of Altitude on Phytochemical Composition of Hemp Inflorescence: A Metabolomic Approach. Molecules. 2020;25:1381. doi: 10.3390/molecules25061381. [DOI] [PMC free article] [PubMed] [Google Scholar]
- 62.Pavlovic R., Panseri S., Giupponi L., Leoni V., Citti C., Cattaneo C., Cavaletto M., Giorgi A. Phytochemical and Ecological Analysis of Two Varieties of Hemp (Cannabis sativa L.) Grown in a Mountain Environment of Italian Alps. Front. Plant Sci. 2019;10:1265. doi: 10.3389/fpls.2019.01265. [DOI] [PMC free article] [PubMed] [Google Scholar]
- 63.Calvi L., Pentimalli D., Panseri S., Giupponi L., Gelmini F., Beretta G., Vitali D., Bruno M., Zilio E., Pavlovic R., et al. Comprehensive quality evaluation of medical Cannabis sativa L. inflorescence and macerated oils based on HS-SPME coupled to GC–MS and LC-HRMS (q-exactive orbitrap®) approach. J. Pharm. Biomed. Anal. 2018;150:208–219. doi: 10.1016/j.jpba.2017.11.073. [DOI] [PubMed] [Google Scholar]
- 64.Pisciottano I.D.M., Guadagnuolo G., Soprano V., Esposito M., Gallo P. A survey of Δ9-THC and relevant cannabinoids in products from the Italian market: A study by LC–MS/MS of food, beverages and feed. Food Chem. 2021;346:128898. doi: 10.1016/j.foodchem.2020.128898. [DOI] [PubMed] [Google Scholar]
- 65.Reyes-Garcés N., Myers C. Analysis of the California list of pesticides, mycotoxins, and cannabinoids in chocolate using liquid chromatography and low-pressure gas chromatography-based platforms. J. Sep. Sci. 2021;44:2564–2576. doi: 10.1002/jssc.202001265. [DOI] [PMC free article] [PubMed] [Google Scholar]
- 66.Namdar D., Mazuz M., Ion A., Koltai H. Variation in the compositions of cannabinoid and terpenoids in Cannabis sativa derived from inflorescence position along the stem and extraction methods. Ind. Crops Prod. 2018;113:376–382. doi: 10.1016/j.indcrop.2018.01.060. [DOI] [Google Scholar]
- 67.Stambouli H., Bouri A.E., Bellimam M.A., Bouayoun T., Karni N.E. Cultivation of Cannabis sativa L. in northern Morocco. Bull. Narc. 2005;57:79–118. [PubMed] [Google Scholar]
- 68.Zaripov E.A., Lee T., Dou Y., Harris C.S., Egorov A., Berezovski M.V. Single-Run Separation and Quantification of 14 Cannabinoids Using Capillary Electrophoresis. Separations. 2021;8:30. doi: 10.3390/separations8030030. [DOI] [Google Scholar]
- 69.Kalinová J.P., Vrchotová N., Tříska J., Hellerová Š. Industrial hemp (Cannabis sativa L.) as a possible source of cannabidiol. J. Cent. Eur. Agric. 2021;22:110–118. doi: 10.5513/JCEA01/22.1.2860. [DOI] [Google Scholar]
- 70.European Commission Union method for the quantitative determination of the Δ9-tetrahydrocannabinol content in hemp varieties. Delegated regulation (EU) No 639/2014, Annex III as amended by Regulation (EU) 2017/1155. [(accessed on 8 February 2021)];Official Journal of the European Communities. 2017 Volume 167:1–15. Available online: http://data.europa.eu/eli/reg_del/2017/1155/oj. [Google Scholar]
- 71.Hewavitharana A.K., Golding G., Tempany G., King G., Holling N. Quantitative GC-MS Analysis of Δ9-Tetrahydrocannabinol in Fiber Hemp Varieties. J. Anal. Toxicol. 2005;29:258–261. doi: 10.1093/jat/29.4.258. [DOI] [PubMed] [Google Scholar]
- 72.Chandra S., Lata H., Mehmedic Z., Khan I., ElSohly M. Assessment of Cannabinoids Content in Micropropagated Plants of Cannabis sativa and Their Comparison with Conventionally Propagated Plants and Mother Plant during Developmental Stages of Growth. Planta Med. 2010;76:743–750. doi: 10.1055/s-0029-1240628. [DOI] [PubMed] [Google Scholar]
- 73.Delta9-THC determination by the EU official method: Evaluation of Measurement Uncertainty and Compliance Assessment of Hemp Samples|SpringerLink, (n.d.) [(accessed on 18 July 2021)]. Available online: https://link.springer.com/article/10.1007/s00216-021-03283-x. [DOI] [PMC free article] [PubMed]
- 74.Florian-Ramirez N.M., Parada-Alfonso F., Garzon-Mendez W.F. Estudio del contenido de cannabinoids en muestras de marihuana (Cannabis sativa L.) cultivadas en varies regiones de Colombia, Vitae. Rev. De La Faculdad De Quim. Farm. 2009;16:237–244. [Google Scholar]
- 75.Pacifico D., Miselli F., Micheler M., Carboni A., Ranalli P., Mandolino G. Genetics and Marker-assisted Selection of the Chemotype in Cannabis sativa L. Mol. Breed. 2006;17:257–268. doi: 10.1007/s11032-005-5681-x. [DOI] [Google Scholar]
- 76.Pacifico D., Miselli F., Carboni A., Moschella A., Mandolino G. Time course of cannabinoid accumulation and chemotype development during the growth of Cannabis sativa L. Euphytica. 2008;160:231–240. doi: 10.1007/s10681-007-9543-y. [DOI] [Google Scholar]
- 77.Turner J.C., Hemphill J.K., Mahlberg P.G. Gland distribution and cannabinoid content in clones of Cannabis sativa L. Am. J. Bot. 1977;64:687–693. doi: 10.1002/j.1537-2197.1977.tb11910.x. [DOI] [Google Scholar]
- 78.Delgado-Povedano M.M., Callado C.S., Priego-Capote F., Ferreiro-Vera C. Untargeted characterization of extracts from Cannabis sativa L. cultivars by gas and liquid chromatography coupled to mass spectrometry in high resolution mode. Talanta. 2020;208:120384. doi: 10.1016/j.talanta.2019.120384. [DOI] [PubMed] [Google Scholar]
- 79.Tipparat P., Natakankitkul S., Chamnivikaipong P., Chutiwat S. Characteristics of cannabinoids composition of Cannabis plants grown in Northern Thailand and its forensic application. Forensic Sci. Int. 2012;215:164–170. doi: 10.1016/j.forsciint.2011.05.006. [DOI] [PubMed] [Google Scholar]
- 80.Nuapia Y., Maraba K., Tutu H., Chimuka L., Cukrowska E. In Situ Decarboxylation-Pressurized Hot Water Extraction for Selective Extraction of Cannabinoids from Cannabis sativa. Chemometric Approach. Molecules. 2021;26:3343. doi: 10.3390/molecules26113343. [DOI] [PMC free article] [PubMed] [Google Scholar]
- 81.Cadola L., Broséus J., Esseiva P. Chemical profiling of different hashish seizures by gas chromatography–mass spectrometry and statistical methodology: A case report. Forensic Sci. Int. 2013;232:e24–e27. doi: 10.1016/j.forsciint.2013.08.014. [DOI] [PubMed] [Google Scholar]
- 82.Zamengo L., Frison G., Bettin C., Sciarrone R. Variability of cannabis potency in the Venice area (Italy): A survey over the period 2010–2012: Variability of cannabis potency in the Venice area (Italy): A survey over the period 2010–2012. Drug Test. Anal. 2014;6:46–51. doi: 10.1002/dta.1515. [DOI] [PubMed] [Google Scholar]
- 83.de Backer B., Debrus B., Lebrun P., Theunis L., Dubois N., Decock L., Verstraete A., Hubert P., Charlier C. Innovative development and validation of an HPLC/DAD method for the qualitative and quantitative determination of major cannabinoids in cannabis plant material. J. Chromatogr. B. 2009;877:4115–4124. doi: 10.1016/j.jchromb.2009.11.004. [DOI] [PubMed] [Google Scholar]
- 84.Cardenia V., Toschi T.G., Scappini S., Rubino R.C., Rodriguez-Estrada M.T. Development and validation of a Fast gas chromatography/mass spectrometry method for the determination of cannabinoids in Cannabis sativa L. J. Food Drug Anal. 2018;26:1283–1292. doi: 10.1016/j.jfda.2018.06.001. [DOI] [PMC free article] [PubMed] [Google Scholar]
- 85.Kaa E. Cannabis plants illicitly grown in Jutland (Denmark) Z. Rechtsmed. 1989;102:367–375. doi: 10.1007/BF00200245. [DOI] [PubMed] [Google Scholar]
- 86.de CássiaMariotti K., Marcelo M.C.A., Ortiz R.S., Borille B.T., Reis M.d., Fett M.S., Ferrão M.F., Limberger R.P. Seized cannabis seeds cultivated in greenhouse: A chemical study by gas chromatography–mass spectrometry and chemometric analysis. Sci. Justice. 2016;56:35–41. doi: 10.1016/j.scijus.2015.09.002. [DOI] [PubMed] [Google Scholar]
- 87.Hazekamp A., Simons R., Peltenburg-Looman A., Sengers M., van Zweden R., Verpoorte R. Preparative Isolation of Cannabinoids from Cannabis sativa by Centrifugal Partition Chromatography. J. Liq. Chromatogr. Relat. Technol. 2004;27:2421–2439. doi: 10.1081/JLC-200028170. [DOI] [Google Scholar]
- 88.Fodor B., Boldizsár I., Molnár-Perl I. Alkylsilyl speciation and direct sample preparation of plant cannabinoids prior to their analysis by GC-MS. Anal. Chim. Acta. 2018;1021:51–59. doi: 10.1016/j.aca.2018.03.049. [DOI] [PubMed] [Google Scholar]
- 89.Jang E., Kim H., Jang S., Lee J., Baeck S., In S., Kim E., Kim Y., Han E. Concentrations of THC, CBD, and CBN in commercial hemp seeds and hempseed oil sold in Korea | Elsevier Enhanced Reader. Forensic Sci. Int. 2020;306:110064. doi: 10.1016/j.forsciint.2019.110064. [DOI] [PubMed] [Google Scholar]
- 90.Ciolino L.A., Ranieri T.L., Taylor A.M. Commercial cannabis consumer products part 1: GC–MS qualitative analysis of cannabis cannabinoids. Forensic Sci. Int. 2018;289:429–437. doi: 10.1016/j.forsciint.2018.05.032. [DOI] [PubMed] [Google Scholar]
- 91.Yotoriyama M., Ishiharajima E., Kato Y., Nagato A., Sekita S., Watanabe K., Yamamoto I. Identification and Determination of Cannabinoids in both Commercially Available and Cannabis Oils Stored Long Term. J. Health Sci. 2005;51:483–487. doi: 10.1248/jhs.51.483. [DOI] [Google Scholar]
- 92.Scheunemann A., Elsner K., Germerott T., Hess C., Zörntlein S., Röhrich J. Extensive phytocannabinoid profiles of seized cannabis and cannabis-based medicines—Identification of potential distinguishing markers. Forensic Sci. Int. 2021;322:110773. doi: 10.1016/j.forsciint.2021.110773. [DOI] [PubMed] [Google Scholar]
- 93.Pitts J.E., O’Neil P.J., Leggo K.P. Variation in the THC Content of Illicitly Imported Cannabis* Products-1984–1989. J. Pharm. Pharmacol. 1990;42:817–820. doi: 10.1111/j.2042-7158.1990.tb07032.x. [DOI] [PubMed] [Google Scholar]
- 94.Casiraghi A., Roda G., Casagni E., Cristina C., Musazzi U., Franzè S., Rocco P., Giuliani C., Fico G., Minghetti P., et al. Extraction Method and Analysis of Cannabinoids in Cannabis Olive Oil Preparations. Planta Med. 2018;84:242–249. doi: 10.1055/s-0043-123074. [DOI] [PubMed] [Google Scholar]
- 95.Wianowska D., Dawidowicz A.L., Kowalczyk M. Transformations of Tetrahydrocannabinol, tetrahydrocannabinolic acid and cannabinol during their extraction from Cannabis sativa L. J. Anal. Chem. 2015;70:920–925. doi: 10.1134/S1061934815080183. [DOI] [Google Scholar]
- 96.Trofin I.G., Vlad C.C., Noja V.V., Dabija G. Identification and characterization of special types of herbal Cannabis. UPB Sci. Bull. 2012;74:13. [Google Scholar]
- 97.Mölleken H., Husmann H. Cannabinoids in seed extracts of Cannabis sativa cultivars. [(accessed on 5 July 2020)];J. Int. Hemp Assoc. 1997 4:76–79. Available online: http://www.druglibrary.org/olsen/hemp/IHA/jiha4201.html. [Google Scholar]
- 98.Gambaro V., Dell’Acqua L., Farè F., Froldi R., Saligari E., Tassoni G. Determination of primary active constituents in Cannabis preparations by high-resolution gas chromatography/flame ionization detection and high-performance liquid chromatography/UV detection. Anal. Chim. Acta. 2002;468:245–254. doi: 10.1016/S0003-2670(02)00660-8. [DOI] [Google Scholar]
- 99.Lachenmeier D.W., Kroener L., Musshoff F., Madea B. Determination of cannabinoids in hemp food products by use of headspace solid-phase microextraction and gas chromatography-mass spectrometry. Anal. Bioanal. Chem. 2004;378:183–189. doi: 10.1007/s00216-003-2268-4. [DOI] [PubMed] [Google Scholar]
- 100.Galettis P., Williams M., Gordon R., Martin J.H. A Simple Isocratic HPLC Method for the Quantitation of 17 Cannabinoids. Aust. J. Chem. 2021;74:453. doi: 10.1071/CH20380. [DOI] [Google Scholar]
- 101.de Oliveira G.L., Voloch M.H., Sztulman G.B., Neto O.N., Yonamine M. Cannabinoid contents in cannabis products seized in São Paulo, Brazil, 2006–2007. Forensic Toxicol. 2008;26:31–35. doi: 10.1007/s11419-008-0046-x. [DOI] [Google Scholar]
- 102.Potter D.J., Hammond K., Tuffnell S., Walker C., di Forti M. Potency of Δ9-tetrahydrocannabinol and other cannabinoids in cannabis in England in 2016: Implications for public health and pharmacology. Drug Test. Anal. 2018;10:628–635. doi: 10.1002/dta.2368. [DOI] [PubMed] [Google Scholar]
- 103.Hazekamp A., Fischedick J.T. Cannabis—From cultivar to chemovar: Towards a better definition of Cannabis potency. Drug Test. Anal. 2012;4:660–667. doi: 10.1002/dta.407. [DOI] [PubMed] [Google Scholar]
- 104.Potter D.J., Clark P., Brown M.B. Potency of Δ9–THC and Other Cannabinoids in Cannabis in England in 2005: Implications for Psychoactivity and Pharmacology. J. Forensic Sci. 2008;53:90–94. doi: 10.1111/j.1556-4029.2007.00603.x. [DOI] [PubMed] [Google Scholar]
- 105.Knight G., Hansen S., Connor M., Poulsen H., McGovern C., Stacey J. The results of an experimental indoor hydroponic Cannabis growing study, using the ‘Screen of Green’ (ScrOG) method—Yield, tetrahydrocannabinol (THC) and DNA analysis. Forensic Sci. Int. 2010;202:36–44. doi: 10.1016/j.forsciint.2010.04.022. [DOI] [PubMed] [Google Scholar]
- 106.de Meijer E.P.M., Hammond K.M., Sutton A. The inheritance of chemical phenotype in Cannabis sativa L. (IV): Cannabinoid-free plants. Euphytica. 2009;168:95–112. doi: 10.1007/s10681-009-9894-7. [DOI] [Google Scholar]
- 107.Florian-Ramirez N.M., Garzon-Mendez W.F., Parada-Alfonso F. Gas Chromatography in Forensic Chemistry: Cannabinoids Content in Marijuana Leaves (Cannabis sativa L.) from Colombia. In: Salih B., editor. Gas Chromatography—Biochemicals Narcotics and Essential Oils. InTech; London, UK: 2012. [DOI] [Google Scholar]
- 108.Poulsen H.A., Sutherland G.J. The potency of cannabis in New Zealand from 1976 to 1996. Sci. Justice. 2000;40:171–176. doi: 10.1016/S1355-0306(00)71972-1. [DOI] [PubMed] [Google Scholar]
- 109.Tremlová B., Mikulášková H.K., Hajduchová K., Jancikova S., Kaczorová D., Zeljković S.Ć., Dordevic D. Influence of Technological Maturity on the Secondary Metabolites of Hemp Concentrate (Cannabis sativa L.) Foods. 2021;10:1418. doi: 10.3390/foods10061418. [DOI] [PMC free article] [PubMed] [Google Scholar]
- 110.Fischedick J.T., Glas R., Hazekamp A., Verpoorte R. A qualitative and quantitative HPTLC densitometry method for the analysis of cannabinoids in Cannabis sativa L. Phytochem. Anal. 2009;20:421–426. doi: 10.1002/pca.1143. [DOI] [PubMed] [Google Scholar]
- 111.Dubrow G.A., Pawar R.S., Srigley C., Sam J.F., Talavera C., Parker C.H., Noonan G.O. A survey of cannabinoids and toxic elements in hemp-derived products from the United States marketplace. J. Food Compos. Anal. 2021;97:103800. doi: 10.1016/j.jfca.2020.103800. [DOI] [PMC free article] [PubMed] [Google Scholar]
- 112.Glivar T., Eržen J., Kreft S., Zagožen M., Čerenak A., Čeh B., Benković E.T. Cannabinoid content in industrial hemp (Cannabis sativa L.) varieties grown in Slovenia. Ind. Crops Prod. 2020;145:112082. doi: 10.1016/j.indcrop.2019.112082. [DOI] [Google Scholar]
- 113.Saloner A., Bernstein N. Nitrogen supply affects cannabinoid and terpenoid profile in medical cannabis (Cannabis sativa L.) Ind. Crops Prod. 2021;167:113516. doi: 10.1016/j.indcrop.2021.113516. [DOI] [Google Scholar]
- 114.Zamengo L., Frison G., Bettin C., Sciarrone R. Cannabis potency in the Venice area (Italy): Update 2013: Cannabis potency in the Venice area (Italy): Update 2013. Drug Test. Anal. 2015;7:255–258. doi: 10.1002/dta.1690. [DOI] [PubMed] [Google Scholar]
- 115.Dussy F.E., Hamberg C., Luginbühl M., Schwerzmann T., Briellmann T.A. Isolation of Δ9-THCA-A from hemp and analytical aspects concerning the determination of Δ9-THC in cannabis products. Forensic Sci. Int. 2005;149:3–10. doi: 10.1016/j.forsciint.2004.05.015. [DOI] [PubMed] [Google Scholar]
- 116.Harvey D.J. Cyclic alkylboronates as derivatives for the characterization of cannabinolic acids by combined gas chromatography and mass spectrometry. Biol. Mass Spectrom. 1977;4:88–93. doi: 10.1002/bms.1200040206. [DOI] [PubMed] [Google Scholar]
- 117.Pandohee J., Holland B.J., Li B., Tsuzuki T., Stevenson P.G., Barnett N.W., Pearson J.R., Jones O.A.H., Conlan X.A. Screening of cannabinoids in industrial-grade hemp using two-dimensional liquid chromatography coupled with acidic potassium permanganate chemiluminescence detection: Liquid Chromatography. J. Sep. Sci. 2015;38:2024–2032. doi: 10.1002/jssc.201500088. [DOI] [PubMed] [Google Scholar]
- 118.Fetterman P.S., Doorenbos N.J. A simple gas liquid chromatography procedure for determination of cannabinoldlc Acids In Cannabis sativa L. Experimentia. 1971;27:988–990. doi: 10.1007/BF02135794. [DOI] [PubMed] [Google Scholar]
- 119.Tucker R.B., Graham B.F. Cannabinoid Content of Colombian Cannabis. Can. Soc. Forensic Sci. J. 1981;14:41–45. doi: 10.1080/00085030.1981.10756878. [DOI] [Google Scholar]
- 120.Krishnamurty H.G., Kaushal R. Analysis of Indian Marihuana. Indian J. Pharmacol. 1974;36:152–154. [Google Scholar]
- 121.Stefanidou M., Dona A., Athanaselis S., Papoutsis I., Koutselinis A. The cannabinoid content of marihuana samples seized in Greece and its forensic application. Forensic Sci. Int. 1998;95:153–162. doi: 10.1016/S0379-0738(98)00083-8. [DOI] [Google Scholar]
- 122.Stefanidou M., Athanaselis S., Alevisopolous G., Papoutsis I., Koutselinis A. Delta9-tetrahydrocannabinol content in cannabis plants of Greek origin. Chem. Pharm. Bull. 2000;48:743–745. doi: 10.1248/cpb.48.743. [DOI] [PubMed] [Google Scholar]
- 123.Tayyab M., Shahwar D. GCMS analysis of Cannabis sativa L. from four different areas of Pakistan. Egypt. J. Forensic Sci. 2015;5:114–125. doi: 10.1016/j.ejfs.2014.07.008. [DOI] [Google Scholar]
- 124.Kladar N., Čonić B.S., Božin B., Torović L. European hemp-based food products—Health concerning cannabinoids exposure assessment. Food Control. 2021;129:108233. doi: 10.1016/j.foodcont.2021.108233. [DOI] [Google Scholar]
- 125.Galand N., Ernouf D., Montigny F., Dollet J., Pothier J. Separation and Identification of Cannabis Components by Different Planar Chromatography Techniques (TLC, AMD, OPLC) J. Chromatogr. Sci. 2004;42:130–134. doi: 10.1093/chromsci/42.3.130. [DOI] [PubMed] [Google Scholar]
- 126.dos Santos N.A., Souza L.M., Domingos E., França H.S., Lacerda V., Beatriz A., Vaz B.G., Rodrigues R.R.T., Carvalho V.V., Merlo B.B., et al. Evaluating the selectivity of colorimetric test (Fast Blue BB salt) for the cannabinoids identification in marijuana street samples by UV–Vis, TLC, ESI(+)FT-ICR MS and ESI(+)MS/MS. Forensic Chem. 2016;1:13–21. doi: 10.1016/j.forc.2016.07.001. [DOI] [Google Scholar]
- 127.Liu Y., Brettell T.A., Victoria J., Wood M.R., Staretz M.E. High performance thin-layer chromatography (HPTLC) analysis of cannabinoids in cannabis extracts. Forensic Chem. 2020;19:1–11. doi: 10.1016/j.forc.2020.100249. [DOI] [Google Scholar]
- 128.Caligiani A., Palla G., Bernardelli B. GC-MS Analysis of Hashish Samples: A Case of Adulteration with Colophony. J. Forensic Sci. 2006;51:1096–1100. doi: 10.1111/j.1556-4029.2006.00202.x. [DOI] [PubMed] [Google Scholar]
- 129.Vollner L., Bieniek D., Korte F. Review of analytical methods for identification and quantification of Cannabis products. Regul. Toxicol. Pharmacol. 1986;6:348–358. doi: 10.1016/0273-2300(86)90003-6. [DOI] [PubMed] [Google Scholar]
- 130.Matsunaga T., Nagatomo H., Yamamoto I., Yoshimura H. Identification and determination of cannabinoids in commercially available cannabis seeds. Eisei Kagaku. 1990;36:545–547. doi: 10.1248/jhs1956.36.545. [DOI] [Google Scholar]
- 131.Tewari S.N., Harpalani S.P., Sharma S.C. Separation and identification of the constituents of hashish (cannabis indica linn.) by thin-layer chromatography and its application in forensic analysis. Mikrochim Acta. 1974;62:991–995. doi: 10.1007/BF01221877. [DOI] [PubMed] [Google Scholar]
- 132.Ibrahim E., Gul W., Gul S., Stamper B., Hadad G., Salam R.A., Ibrahim A., Ahmed S., Chandra S., Lata H., et al. Determination of Acid and Neutral Cannabinoids in Extracts of Different Strains of Cannabis sativa Using GC-FID. Planta Med. 2018;84:250–259. doi: 10.1055/s-0043-124088. [DOI] [PubMed] [Google Scholar]
- 133.Schettino L., Prieto M., Benedé J.L., Chisvert A., Salvador A. A Rapid and Sensitive Method for the Determination of Cannabidiol in Cosmetic Products by Liquid Chromatography–Tandem Mass Spectrometry. Cosmetics. 2021;8:30. doi: 10.3390/cosmetics8020030. [DOI] [Google Scholar]
- 134.Piccolella S., Formato M., Pecoraro M.T., Crescente G., Pacifico S. Discrimination of CBD-, THC- and CBC-type acid cannabinoids through diagnostic ions by UHPLC-HR-MS/MS in negative ion mode. J. Pharm. Biomed. Anal. 2021;201:114125. doi: 10.1016/j.jpba.2021.114125. [DOI] [PubMed] [Google Scholar]
- 135.UNODC . Bulletin on Narcotics. United Nations, Office on Drugs and Crime; Vienna, Austria: 1994. [Google Scholar]
- 136.Baker P.B., Taylor B.J., Gough T.A. The tetrahydrocannabinol and tetrahydrocannabinolic acid content of cannabis products. J. Pharm. Pharmacol. 1981;33:369–372. doi: 10.1111/j.2042-7158.1981.tb13806.x. [DOI] [PubMed] [Google Scholar]
- 137.ElSohly M.A., Mehmedic Z., Foster S., Gon C., Chandra S., Church J.C. Changes in Cannabis Potency Over the Last 2 Decades (1995–2014): Analysis of Current Data in the United States. Biol. Psychiatry. 2016;79:613–619. doi: 10.1016/j.biopsych.2016.01.004. [DOI] [PMC free article] [PubMed] [Google Scholar]
- 138.Stambouli H., el Bouri A., Bouayoun T. Évolution de la teneur en Δ9-THC dans les saisies de résines de cannabis au Maroc de 2005 à 2014. Toxicol. Anal. Et Clin. 2016;28:146–152. doi: 10.1016/j.toxac.2015.11.001. [DOI] [Google Scholar]
- 139.Ross S.A., Mehmedic Z., Murphy T.P., Elsohly M.A. GC-MS Analysis of the total delta9-THC content of bBoth drug- and fiber-type cannabis seeds. J. Anal. Toxicol. 2000;24:715–717. doi: 10.1093/jat/24.8.715. [DOI] [PubMed] [Google Scholar]
- 140.Petrović M., Debeljak Ž., Kezić N., Džidara P. Relationship between cannabinoids content and composition of fatty acids in hempseed oils. Food Chem. 2015;170:218–225. doi: 10.1016/j.foodchem.2014.08.039. [DOI] [PubMed] [Google Scholar]
- 141.Licata M., Verri P., Beduschi G. δ9 THC content in illicit cannabis products. Ann. Ist Super Sanita. 2005;41:483–485. [PubMed] [Google Scholar]
- 142.Swift W., Wong A., Li K.M., Arnold J.C., McGregor I.S. Analysis of Cannabis Seizures in NSW, Australia: Cannabis Potency and Cannabinoid Profile. PLoS ONE. 2013;8:e70052. doi: 10.1371/journal.pone.0070052. [DOI] [PMC free article] [PubMed] [Google Scholar]
- 143.Rovetto L.J., Aieta N.V. Supercritical carbon dioxide extraction of cannabinoids from Cannabis sativa L. J. Supercrit. Fluids. 2017;129:16–27. doi: 10.1016/j.supflu.2017.03.014. [DOI] [Google Scholar]
- 144.Christinat N., Savoy M.-C., Mottier P. Development, validation and application of a LC-MS/MS method for quantification of 15 cannabinoids in food. Food Chem. 2020;318:126469. doi: 10.1016/j.foodchem.2020.126469. [DOI] [PubMed] [Google Scholar]
- 145.Ameur S., Haddou B., Derriche Z., Canselier J.P., Gourdon C. Cloud point extraction of Δ9-tetrahydrocannabinol from cannabis resin. Anal. Bioanal. Chem. 2013;405:3117–3123. doi: 10.1007/s00216-013-6743-2. [DOI] [PubMed] [Google Scholar]
- 146.Gunjević V., Grillo G., Carnaroglio D., Binello A., Barge A., Cravotto G. Selective recovery of terpenes, polyphenols and cannabinoids from Cannabis sativa L. inflorescences under microwaves. Ind. Crops Prod. 2021;162:113247. doi: 10.1016/j.indcrop.2021.113247. [DOI] [Google Scholar]
- 147.Poddar M.K., Ghosh J.J., Datta J. Micromethod for the estimation of Cannabis components. Sci. Cult. 1975;41:492–495. [Google Scholar]
- 148.Ilias Y., Rudaz S., Mathieu P., Veuthey J.-L., Christen P. Analysis of Cannabis Material by Headspace Solid-Phase Microextraction Combined with Gas Chromatography-Mass Spectrometry. Chim. Int. J. Chem. 2004;58:219–221. doi: 10.2533/000942904777677957. [DOI] [PubMed] [Google Scholar]
- 149.Qamar S., Manrique Y.J., Parekh H.S., Falconer J.R. Development and Optimization of Supercritical Fluid Extraction Setup Leading to Quantification of 11 Cannabinoids Derived from Medicinal Cannabis. Biology. 2021;10:481. doi: 10.3390/biology10060481. [DOI] [PMC free article] [PubMed] [Google Scholar]
- 150.Omar J., Olivares M., Amigo J.M., Etxebarria N. Resolution of co-eluting compounds of Cannabis Sativa in comprehensive two-dimensional gas chromatography/mass spectrometry detection with Multivariate Curve Resolution-Alternating Least Squares. Talanta. 2014;121:273–280. doi: 10.1016/j.talanta.2013.12.044. [DOI] [PubMed] [Google Scholar]
- 151.Grijó D.R., Osorio I.A.V., Cardozo-Filho L. Supercritical Extraction Strategies Using CO2 and Ethanol to Obtain Cannabinoid Compounds from Cannabis Hybrid Flowers. J. CO2 Util. 2019;30:241–248. doi: 10.1016/j.jcou.2018.12.014. [DOI] [Google Scholar]
- 152.Micalizzi G., Alibrando F., Vento F., Trovato E., Zoccali M., Guarnaccia P., Dugo P., Mondello L. Development of a Novel Microwave Distillation Technique for the Isolation of Cannabis sativa L. Essential Oil and Gas Chromatography Analyses for the Comprehensive Characterization of Terpenes and Terpenoids, Including Their Enantio-Distribution. Molecules. 2021;26:1588. doi: 10.3390/molecules26061588. [DOI] [PMC free article] [PubMed] [Google Scholar]
- 153.Pellegrini M., Marchei E., Pacifici R., Pichini S. A rapid and simple procedure for the determination of cannabinoids in hemp food products by gas chromatography-mass spectrometry. J. Pharm. Biomed. Anal. 2005;36:939–946. doi: 10.1016/j.jpba.2004.07.035. [DOI] [PubMed] [Google Scholar]
- 154.Broséus J., Anglada F., Esseiva P. The differentiation of fibre- and drug type Cannabis seedlings by gas chromatography/mass spectrometry and chemometric tools. Forensic Sci. Int. 2010;200:87–92. doi: 10.1016/j.forsciint.2010.03.034. [DOI] [PubMed] [Google Scholar]
- 155.Chandra S., Radwan M.M., Majumdar C.G., Church J.C., Freeman T.P., ElSohly M.A. New trends in cannabis potency in USA and Europe during the last decade (2008–2017) Eur. Arch. Psychiatry Clin. Neurosci. 2019;269:5–15. doi: 10.1007/s00406-019-00983-5. [DOI] [PubMed] [Google Scholar]
- 156.Qureshi M.N., Kanwal F., Siddique M., Akram M. Estimation of Biologically Active Cannabinoids in Cannabis indica by Gas Chromatography-mass Spectrometry (GC-MS) World Appl. Sci. J. 2012;19:918–923. doi: 10.5829/idosi.wasj.2012.19.07.1922. [DOI] [Google Scholar]
- 157.Pijlman F., Rigter S., Hoek J., Goldschmidt H., Niesink R. Strong increase in total delta-THC in cannabis preparations sold in Dutch coffee shops. Addict. Biol. 2005;10:171–180. doi: 10.1080/13556210500123217. [DOI] [PubMed] [Google Scholar]
- 158.Vanhove W., van Damme P., Meert N. Factors determining yield and quality of illicit indoor cannabis (Cannabis spp.) production. Forensic Sci. Int. 2011;212:158–163. doi: 10.1016/j.forsciint.2011.06.006. [DOI] [PubMed] [Google Scholar]
- 159.Thomsen K.R., Lindholst C., Thylstrup B., Kvamme S., Reitzel L.A., Worm-Leonhard M., Englund A., Freeman T.P., Hesse M. Changes in the composition of cannabis from 2000–2017 in Denmark: Analysis of confiscated samples of cannabis resin. Exp. Clin. Psychopharmacol. 2019;27:402–411. doi: 10.1037/pha0000303. [DOI] [PubMed] [Google Scholar]
- 160.dos Santos N., Tose L., da Silva S., Murgu M., Kuster R., Ortiz R., Camargo F., Vaz B., Lacerda V., Jr., Romão W. Analysis of Isomeric Cannabinoid Standards and Cannabis Products by UPLC-ESI-TWIM-MS: A Comparison with GC-MS and GC × GC-QMS. J. Braz. Chem. Soc. 2019;30:60–70. doi: 10.21577/0103-5053.20180152. [DOI] [Google Scholar]
- 161.Leghissa A., Smuts J., Qiu C., Hildenbrand Z.L., Schug K.A. Detection of cannabinoids and cannabinoid metabolites using gas chromatography with vacuum ultraviolet spectroscopy. Sep. Sci. Plus. 2018;1:37–42. doi: 10.1002/sscp.201700005. [DOI] [Google Scholar]
- 162.Giese M.W., Lewis M.A., Giese L., Smith K.M. Method for the Analysis of Cannabinoids and Terpenes in Cannabis. J. AOAC Int. 2015;98:1503–1522. doi: 10.5740/jaoacint.15-116. [DOI] [PubMed] [Google Scholar]
- 163.Trigg S. Bachelor Thesis. Murdoch University; Perth, Australia: 2017. Development of Gas and Liquid Chromatographic Methods for the Separation and Quantification of 11 Cannabinoids. [Google Scholar]
- 164.Sherma J., Rabel F. Thin layer chromatography in the analysis of cannabis and its components and synthetic cannabinoids. J. Liq. Chromatogr. Relat. Technol. 2019;42:613–628. doi: 10.1080/10826076.2019.1663529. [DOI] [Google Scholar]
- 165.Mandrioli M., Tura M., Scotti S., Gallina T. Fast Detection of 10 Cannabinoids by RP-HPLC-UV Method in Cannabis sativa L. Molecules. 2019;24:2113. doi: 10.3390/molecules24112113. [DOI] [PMC free article] [PubMed] [Google Scholar]
- 166.Amirav A., Neumark B., Eren K.J.M., Fialkov A.B., Tal N. Cannabis and its cannabinoids analysis by gas chromatography–mass spectrometry with Cold EI. J. Mass Spectrom. 2021;6:56. doi: 10.1002/jms.4726. [DOI] [PubMed] [Google Scholar]
- 167.Kowalska T., Sajewicz M., Sherma J. Planar Chromatography—Mass Spectrometry. CRC Press; Boca Raton, FL, USA: 2020. [Google Scholar]
- 168.Sherma J., Fried B., editors. Handbook of Thin-Layer Chromatography. 3rd ed. Marcel Dekker; New York, NY, USA: 2003. rev.expanded. [Google Scholar]
- 169.de Carvalho T.C., Tosato F., Souza L.M., Santos H., Merlo B.B., Ortiz R.S., Rodrigues R.R.T., Filgueiras P.R., França H.S., Augusti R., et al. Thin layer chromatography coupled to paper spray ionization mass spectrometry for cocaine and its adulterants analysis. Forensic Sci. Int. 2016;262:56–65. doi: 10.1016/j.forsciint.2016.02.039. [DOI] [PubMed] [Google Scholar]
- 170.National Research Council (U.S.), editor. Strengthening Forensic Science in the United States: A Path Forward. National Academies Press; Washington, DC, USA: 2009. [Google Scholar]
- 171.Hanus L. Our Experience with Identification and Separation of Compounds from Marijuana (Cannabis Sativa L.) by Thin Layer Chromatography. Acta Univ. Palacki. Olomuc. Fac. Med. 1987;116:15–24. [PubMed] [Google Scholar]
- 172.Mano-Sousa B.J., Maia G.A.S., Lima P.L., Campos V.A., Negri G., Chequer F.M.D., Duarte-Almeida J.M. Color determination method and evaluation of methods for the detection of cannabinoids by thin-layer chromatography (TLC) J. Forensic Sci. 2021;66:854–865. doi: 10.1111/1556-4029.14659. [DOI] [PubMed] [Google Scholar]
- 173.Meng Q., Buchanan B., Zuccolo J., Poulin M.-M., Gabriele J., Baranowski D.C. A reliable and validated LC-MS/MS method for the simultaneous quantification of 4 cannabinoids in 40 consumer products. PLoS ONE. 2018;13:e0196396. doi: 10.1371/journal.pone.0196396. [DOI] [PMC free article] [PubMed] [Google Scholar]
- 174.Fan X.-H., Cheng Y.-Y., Ye Z.-L., Lin R.-C., Qian Z.-Z. Multiple chromatographic fingerprinting and its application to the quality control of herbal medicines. Anal. Chim. Acta. 2006;555:217–224. doi: 10.1016/j.aca.2005.09.037. [DOI] [Google Scholar]
- 175.Cheng Y., Chen M., Tong W. An Approach to Comparative Analysis of Chromatographic Fingerprints for Assuring the Quality of Botanical Drugs. J. Chem. Inf. Comput. Sci. 2003;43:1068–1076. doi: 10.1021/ci034034c. [DOI] [PubMed] [Google Scholar]
- 176.Patel B., Wene D., Fan Z. Qualitative and quantitative measurement of cannabinoids in cannabis using modified HPLC/DAD method. J. Pharm. Biomed. Anal. 2017;146:15–23. doi: 10.1016/j.jpba.2017.07.021. [DOI] [PubMed] [Google Scholar]
- 177.Gul W., Gul S.W., Radwan M.M., Wanas A.S., Mehmedic Z., Khan I.I., Sharaf M.H.M., ElSohly M.A. Determination of 11 Cannabinoids in Biomass and Extracts of Different Varieties of Cannabis Using High-Performance Liquid Chromatography. J. AOAC Int. 2015;98:1523–1528. doi: 10.5740/jaoacint.15-095. [DOI] [PubMed] [Google Scholar]
- 178.Pellati F., Brighenti V., Sperlea J., Marchetti L., Bertelli D., Benvenuti S. New Methods for the Comprehensive Analysis of Bioactive Compounds in Cannabis sativa L. (hemp) Molecules. 2018;23:2639. doi: 10.3390/molecules23102639. [DOI] [PMC free article] [PubMed] [Google Scholar]
- 179.Citti C., Pacchetti B., Vandelli M.A., Forni F., Cannazza G. Analysis of cannabinoids in commercial hemp seed oil and decarboxylation kinetics studies of cannabidiolic acid (CBDA) J. Pharm. Biomed. Anal. 2018;149:532–540. doi: 10.1016/j.jpba.2017.11.044. [DOI] [PubMed] [Google Scholar]
- 180.Pacifici R., Marchei E., Salvatore F., Guandalini L., Busardò F.P., Pichini S. Evaluation of cannabinoids concentration and stability in standardized preparations of cannabis tea and cannabis oil by ultra-high performance liquid chromatography tandem mass spectrometry. Clin. Chem. Lab. Med. 2017;55:1555–1563. doi: 10.1515/cclm-2016-1060. [DOI] [PubMed] [Google Scholar]
- 181.Yang Y., Lewis M.M., Bello A.M., Wasilewski E., Clarke H.A., Kotra L.P. Cannabis sativa (Hemp) Seeds, Δ9-Tetrahydrocannabinol, and Potential Overdose. Cannabis Cannabinoid Res. 2017;2:274–281. doi: 10.1089/can.2017.0040. [DOI] [PMC free article] [PubMed] [Google Scholar]
- 182.Citti C., Ciccarella G., Braghiroli D., Parenti C., Vandelli M.A., Cannazza G. Medicinal cannabis: Principal cannabinoids concentration and their stability evaluated by a high performance liquid chromatography coupled to diode array and quadrupole time of flight mass spectrometry method. J. Pharm. Biomed. Anal. 2016;128:201–209. doi: 10.1016/j.jpba.2016.05.033. [DOI] [PubMed] [Google Scholar]
- 183.Palermiti A., Cafaro A., Barco S., Bucchioni P., Franceschini P., Cusato J., de Nicolò A., Manca A., de Vivo E.D., Russo E., et al. Analysis of Cannabinoids Concentration in Cannabis Oil Galenic Preparations: Harmonization between Three Laboratories in Northern Italy. Pharmaceuticals. 2021;14:462. doi: 10.3390/ph14050462. [DOI] [PMC free article] [PubMed] [Google Scholar]
- 184.Carcieri C., Tomasello C., Simiele M., de Nicolò A., Avataneo V., Canzoneri L., Cusato J., di Perri G., D’Avolio A. Cannabinoids concentration variability in cannabis olive oil galenic preparations. J. Pharm. Pharmacol. 2018;70:143–149. doi: 10.1111/jphp.12845. [DOI] [PubMed] [Google Scholar]
- 185.Burnier C., Esseiva P., Roussel C. Quantification of THC in Cannabis plants by fast-HPLC-DAD: A promising method for routine analyses. Talanta. 2019;192:135–141. doi: 10.1016/j.talanta.2018.09.012. [DOI] [PubMed] [Google Scholar]
- 186.Peace M.R., Butler K.E., Wolf C.E., Poklis J.L., Poklis A. Evaluation of Two Commercially Available Cannabidiol Formulations for Use in Electronic Cigarettes. Front. Pharmacol. 2016;7:279. doi: 10.3389/fphar.2016.00279. [DOI] [PMC free article] [PubMed] [Google Scholar]
- 187.Yangsud J., Santasanasuwan S., Ahkkarachinoreh P., Maha A., Madaka F., Suksaeree J., Songsak T., Vutthipong A., Monton C. Stability of cannabidiol, ∆9-tetrahydrocannabinol, and cannabinol under stress conditions. Adv. Tradit. Med. 2021;21:475–484. doi: 10.1007/s13596-021-00590-7. [DOI] [Google Scholar]
- 188.Deidda R., Schelling C., Roussel J.-M., Dispas A., Bleye C.D., Ziemons É., Hubert P., Veuthey J.-L. The analysis of cannabinoids in cannabis samples by supercritical fluid chromatography and ultra-high-performance liquid chromatography: A comparison study. Anal. Sci. Adv. 2021;2:2–14. doi: 10.1002/ansa.202000091. [DOI] [PMC free article] [PubMed] [Google Scholar]
- 189.Deidda R., Coppey F., Damergi D., Schelling C., Coïc L., Veuthey J.-L., Sacré P.-Y., de Bleye C., Hubert P., Esseiva P., et al. New perspective for the in-field analysis of cannabis samples using handheld near-infrared spectroscopy: A case study focusing on the determination of Δ9-tetrahydrocannabinol. J. Pharm. Biomed. Anal. 2021;202:114150. doi: 10.1016/j.jpba.2021.114150. [DOI] [PubMed] [Google Scholar]
- 190.Ciolino L.A., Ranieri T.L., Taylor A.M. Commercial cannabis consumer products part 2: HPLC-DAD quantitative analysis of cannabis cannabinoids. Forensic Sci. Int. 2018;289:438–447. doi: 10.1016/j.forsciint.2018.05.033. [DOI] [PubMed] [Google Scholar]
- 191.Ambach L., Penitschka F., Broillet A., König S., Weinmann W., Bernhard W. Simultaneous quantification of delta-9-THC, THC-acid A, CBN and CBD in seized drugs using HPLC-DAD. Forensic Sci. Int. 2014;243:107–111. doi: 10.1016/j.forsciint.2014.06.008. [DOI] [PubMed] [Google Scholar]
- 192.Wakshlag J.J., Cital S., Eaton S.J., Prussin R., Hudalla C. Cannabinoid, Terpene, and Heavy Metal Analysis of 29 Over-the-Counter Commercial Veterinary Hemp Supplements. VMRR. 2020;11:45–55. doi: 10.2147/VMRR.S248712. [DOI] [PMC free article] [PubMed] [Google Scholar]
- 193.Tolomeo F., Russo F., Vandelli M.A., Biagini G., Capriotti A.L., Laganà A., Carbone L., Gigli G., Cannazza G., Citti C. HPLC-UV-HRMS analysis of cannabigerovarin and cannabigerobutol, the two impurities of cannabigerol extracted from hemp. J. Pharm. Biomed. Anal. 2021;203:114215. doi: 10.1016/j.jpba.2021.114215. [DOI] [PubMed] [Google Scholar]
- 194.Brighenti V., Licata M., Pedrazzi T., Maran D., Bertelli D., Pellati F., Benvenuti S. Development of a new method for the analysis of cannabinoids in honey by means of high-performance liquid chromatography coupled with electrospray ionisation-tandem mass spectrometry detection. J. Chromatogr. A. 2019;1597:179–186. doi: 10.1016/j.chroma.2019.03.034. [DOI] [PubMed] [Google Scholar]
- 195.Wang M., Wang Y.-H., Avula B., Radwan M.M., Wanas A.S., van Antwerp J., Parcher J.F., ElSohly M.A., Khan I.A. Decarboxylation Study of Acidic Cannabinoids: A Novel Approach Using Ultra-High-Performance Supercritical Fluid Chromatography/Photodiode Array-Mass Spectrometry. Cannabis Cannabinoid Res. 2016;1:262–271. doi: 10.1089/can.2016.0020. [DOI] [PMC free article] [PubMed] [Google Scholar]
- 196.mzCloud—Advanced Mass Spectral Database (n.d.) [(accessed on 28 October 2020)]. Available online: https://www.mzcloud.org/
- 197.Pence H.E., Williams A. ChemSpider: An Online Chemical Information Resource. J. Chem. Educ. 2010;87:1123–1124. doi: 10.1021/ed100697w. [DOI] [Google Scholar]
- 198.Wishart D.S., Feunang Y.D., Marcu A., Guo A.C., Liang K., Vázquez-Fresno R., Sajed T., Johnson D., Li C., Karu N., et al. HMDB 4.0: The human metabolome database for 2018. Nucleic Acids Res. 2018;46:D608–D617. doi: 10.1093/nar/gkx1089. [DOI] [PMC free article] [PubMed] [Google Scholar]
- 199.Bäckström B., Cole M.D., Carrott M.J., Jones D.C., Davidson G., Coleman K. A preliminary study of the analysis of Cannabis by supercritical fluid chromatography with atmospheric pressure chemical ionisation mass spectroscopic detection. Sci. Justice. 1997;37:91–97. doi: 10.1016/S1355-0306(97)72153-1. [DOI] [PubMed] [Google Scholar]
- 200.Wang M., Wang Y.-H., Avula B., Radwan M.M., Wanas A.S., Mehmedic Z., van Antwerp J., ElSohly M.A., Khan I.A. Quantitative Determination of Cannabinoids in Cannabis and Cannabis Products Using Ultra-High-Performance Supercritical Fluid Chromatography and Diode Array/Mass Spectrometric Detection. J. Forensic Sci. 2017;62:602–611. doi: 10.1111/1556-4029.13341. [DOI] [PubMed] [Google Scholar]
- 201.U.S. Department of Health and Human Services, Food and Drug Administration . Guidance for Industry PAT—A Framework for Innovative Pharmaceutical Development, Manufacturing, and Quality Assurance. Food and Drug Administration; Silver Spring, MD, USA: 2004. [Google Scholar]
- 202.Griffiths P.R., de Haseth J.A. Fourier Transform Infrared Spectrometry. 2nd ed. Wiley; Hoboken, NJ, USA: 2007. [Google Scholar]
- 203.Borille B.T., Marcelo M.C.A., Ortiz R.S., Mariotti K.d., Ferrão M.F., Limberger R.P. Near infrared spectroscopy combined with chemometrics for growth stage classification of cannabis cultivated in a greenhouse from seized seeds. Spectrochim. Acta Part A: Mol. Biomol. Spectrosc. 2017;173:318–323. doi: 10.1016/j.saa.2016.09.040. [DOI] [PubMed] [Google Scholar]
- 204.Mendez J., Francisco S. Optimization of Cannabis Grows Using Introduction Fourier Transform Mid-Infrared Spectroscopy. Perkin Elmer Inc.; Waltham, MA, USA: 2016. [Google Scholar]
- 205.Callado C.S., Núñez-Sánchez N., Casano S., Ferreiro-Vera C. The potential of near infrared spectroscopy to estimate the content of cannabinoids in Cannabis sativa L.: A comparative study. Talanta. 2018;190:147–157. doi: 10.1016/j.talanta.2018.07.085. [DOI] [PubMed] [Google Scholar]
- 206.Grekopoulos J.E. Construction and Validation of Quantification Methods for Determining the Cannabidiol Content in Liquid Pharma-Grade Formulations by Means of Near-Infrared Spectroscopy and Partial Least Squares Regression. Med. Cannabis Cannabinoids. 2019;2:43–55. doi: 10.1159/000500266. [DOI] [PMC free article] [PubMed] [Google Scholar]
- 207.Duchateau C., Kauffmann J., Canfyn M., Stévigny C., de Braekeleer K., Deconinck E. Discrimination of legal and illegal Cannabis spp. according to European legislation using near infrared spectroscopy and chemometrics. Drug Test. Anal. 2020;12:1309–1319. doi: 10.1002/dta.2865. [DOI] [PubMed] [Google Scholar]
- 208.Lu G., Fei B. Medical hyperspectral imaging: A review. J. Biomed. Opt. 2014;19:010901. doi: 10.1117/1.JBO.19.1.010901. [DOI] [PMC free article] [PubMed] [Google Scholar]
- 209.Politi M., Peschel W., Wilson N., Zloh M., Prieto J.M., Heinrich M. Direct NMR analysis of cannabis water extracts and tinctures and semi-quantitative data on Δ9-THC and Δ9-THC-acid. Phytochemistry. 2008;69:562–570. doi: 10.1016/j.phytochem.2007.07.018. [DOI] [PubMed] [Google Scholar]
- 210.Martin F.L. Shining a new light into molecular workings. Nat. Methods. 2011;8:385–387. doi: 10.1038/nmeth.1594. [DOI] [PubMed] [Google Scholar]
- 211.Sanchez L., Baltensperger D., Kurouski D. Raman-Based Differentiation of Hemp, Cannabidiol-Rich Hemp, and Cannabis. Anal. Chem. 2020;92:7733–7737. doi: 10.1021/acs.analchem.0c00828. [DOI] [PubMed] [Google Scholar]
- 212.Sanchez L., Filter C., Baltensperger D., Kurouski D. Confirmatory non-invasive and non-destructive differentiation between hemp and cannabis using a hand-held Raman spectrometer. RSC Adv. 2020;10:3212–3216. doi: 10.1039/C9RA08225E. [DOI] [PMC free article] [PubMed] [Google Scholar]
- 213.Ebersbach P., Stehle F., Kayser O., Freier E. Chemical fingerprinting of single glandular trichomes of Cannabis sativa by Coherent anti-Stokes Raman scattering (CARS) microscopy. BMC Plant Biol. 2018;18:275. doi: 10.1186/s12870-018-1481-4. [DOI] [PMC free article] [PubMed] [Google Scholar]
- 214.Lurie I.S., Meyers R.P., Conver T.S. Capillary Electrochromatography of Cannabinoids. Anal. Chem. 1998;70:3255–3260. doi: 10.1021/ac980077u. [DOI] [PubMed] [Google Scholar]
- 215.Peschel W., Politi M. 1 H NMR and HPLC/DAD for Cannabis sativa L. chemotype distinction, extract profiling and specification. Talanta. 2015;140:150–165. doi: 10.1016/j.talanta.2015.02.040. [DOI] [PubMed] [Google Scholar]
- 216.Isahq M.S., Afridi M.S., Ali J., Hussain M.M., Ahmad S., Kanwal F. Proximate composition, phytochemical screening, GC-MS studies of biologically active cannabinoids and antimicrobial activities of Cannabis indica. Asian Pac. J. Trop. Dis. 2015;5:897–902. doi: 10.1016/S2222-1808(15)60953-7. [DOI] [Google Scholar]
- 217.Uziel A., Gelfand A., Amsalem K., Berman P., Lewitus G.M., Meiri D., Lewitus D.Y. Full-Spectrum Cannabis Extract Microdepots Support Controlled Release of Multiple Phytocannabinoids for Extended Therapeutic Effect. ACS Appl. Mater. Interfaces. 2020;12:23707–23716. doi: 10.1021/acsami.0c04435. [DOI] [PMC free article] [PubMed] [Google Scholar]
- 218.Risoluti R., Gullifa G., Battistini A., Materazzi S. The Detection of Cannabinoids in Veterinary Feeds by MicroNIR/Chemometrics: A New Analytical Platform. Analyst. 2020;145:1777–1782. doi: 10.1039/C9AN01854A. [DOI] [PubMed] [Google Scholar]
- 219.Hazekamp A., Choi Y.H., Verpoorte R. Quantitative Analysis of Cannabinoids from Cannabis sativa Using 1H-NMR. Chem. Pharm. Bull. 2004;52:718–721. doi: 10.1248/cpb.52.718. [DOI] [PubMed] [Google Scholar]
- 220.Happyana N., Agnolet S., Muntendam R., van Dam A., Schneider B., Kayser O. Analysis of cannabinoids in laser-microdissected trichomes of medicinal Cannabis sativa using LCMS and cryogenic NMR. Phytochemistry. 2013;87:51–59. doi: 10.1016/j.phytochem.2012.11.001. [DOI] [PubMed] [Google Scholar]
- 221.Choi Y.H., Kim H.K., Hazekamp A., Erkelens C., Lefeber A.W.M., Verpoorte R. Metabolomic Differentiation of Cannabis sativa Cultivars Using 1H NMR Spectroscopy and Principal Component Analysis. J. Nat. Prod. 2004;67:953–957. doi: 10.1021/np049919c. [DOI] [PubMed] [Google Scholar]
- 222.van der Pol P., Liebregts N., de Graaf R., Korf D.J., van den Brink W., van Laar M. Validation of Self-Reported Cannabis Dose and Potency: An Ecological Study: Self-Reported Cannabis Dose and Potency. Addiction. 2013;108:1801–1808. doi: 10.1111/add.12226. [DOI] [PubMed] [Google Scholar]
- 223.van der Pol P., Liebregts N., Brunt T., van Amsterdam J., de Graaf R., Korf D.J., van den Brink W., van Laar M. Cross-Sectional and Prospective Relation of Cannabis Potency, Dosing and Smoking Behaviour with Cannabis Dependence: An Ecological Study: Cannabis Potency, Titration and Dependence. Addiction. 2014;109:1101–1109. doi: 10.1111/add.12508. [DOI] [PubMed] [Google Scholar]
- 224.Leghissa A. Method Development for Qualification and Quantification of Cannabinoids and Terpenes in Extracts by Gas Chromatography-Mass Spectrometry. 91. [(accessed on 8 January 2022)]. Available online: https://rc.library.uta.edu/uta-ir/handle/10106/26115?show=full.
Associated Data
This section collects any data citations, data availability statements, or supplementary materials included in this article.


