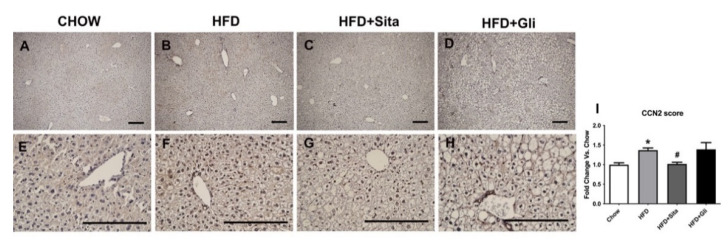
Figure 7.
Liver CCN2 immunohistochemistry. Representative images at 100× (A–D) and 400× magnification (E–H). The scale bar is 200 microns. Results are shown as mean ± SEM of fold change compared with staining intensity scores of controlled mice (I). * p < 0.05, significantly different from chow alone; # p < 0.05, significantly different from HFD, by unpaired T-test.

