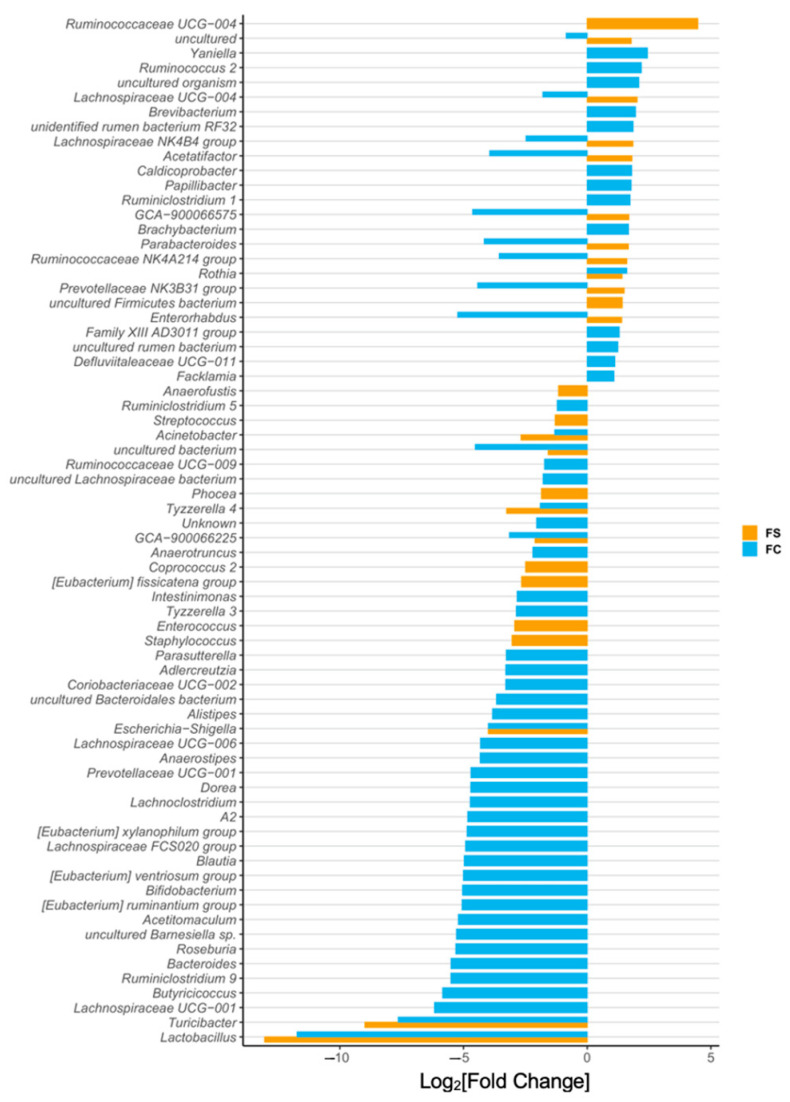
Figure 6.
Differentially abundant genera in young adult (YA) rats due to iron form (n = 19–23/group, 4 litters/group). Differentially abundant genera are represented as log2[Fold Change] from CON for each iron group. Genera are ordered by magnitude of change. Differential abundance was assessed with DESeq2, and FDR-adjusted p-values < 0.05 were considered significant. All significant comparison results are shown in the plot, and their adjusted p-values are listed in Table S8.

